Abstract
We describe open-loop and closed-loop multiplexed force measurements using holographic optical tweezers. We quantify the performance of our novel video-based control system in a driven suspension of colloidal particles. We demonstrate our system's abilities with the measurement of the mechanical coupling between Aplysia bag cell growth cones and beads functionalized with the neuronal cell adhesion molecule, apCAM. We show that cells form linkages which couple beads to the underlying cytoskeleton. These linkages are intermittent, stochastic and heterogeneous across beads distributed near the leading edge of a single growth cone.
1. Introduction
Cell motility is a highly regulated mechanical process important in wound healing, metastasis and embryogenesis. In order for a cell to move, it must form a stiff mechanical connection between its cytoskeleton and the extracellular matrix. This linkage acts as a molecular clutch transducing cytoskeletal motion into traction forces [1]. Directed cell motility requires that the cell regulates the formation and strength of these linkages. Typically, interactions of transmembrane proteins and receptors in the extracellular matrix trigger signalling cascades which regulate the mechanics of these linkages [2].
Traction force microscopy on thick elastic substrates has revealed that forces generated by cells are heterogeneous within both migrating and adherent cells [3]. Furthermore, it appears that migrating cells can be guided by the rigidity of the substrate in a phenomenon called durotaxis. Here, cells tend to migrate toward the stiffer part of the substrate where higher traction forces are generated [4]. Such experiments suggest that cells probe the rigidity of their environment and adapt their motility accordingly. While traction force microscopy enables measurement of forces throughout the cell, local stimulation of the cell and force feedback cannot be readily achieved.
Optical tweezers enable the precise control of localized mechanical and biochemical stimuli. Optical tweezers can position microparticles with nanometer precision; displacements from the center of an optical trap encode forces applied to the bead. Functionalized beads manipulated with optical tweezers can form mechanical linkages to the cytoskeleton. The strength of the linkages appears to be dependent on the ligand density on the bead's surface and the stiffness of the optical trap [5, 6, 7]. Furthermore, optical tweezers can be controlled dynamically to perform closed-loop force measurements [8]. While traction force microscopy is the natural choice for wide-field force measurements, optical tweezers can be extended to measure the forces at multiple positions using time-sharing [7, 9] or holographic optical tweezers [10, 11, 12]. Measurements at multiple positions enable the direct comparison of cell response to different stimuli on a single cell at the same time.
Here, we describe a system for multiplexed open-loop and closed-loop force measurements with holographic optical tweezers and real-time video-based particle tracking. We demonstrate its capabilities with force measurements on live cells. We observe transient coupling of optically manipulated apCAM-coated microspheres to the actin cytoskeleton of an Aplysia bag cell neuron growth cone.
2. Materials and methods
2.1. Optical microscopy
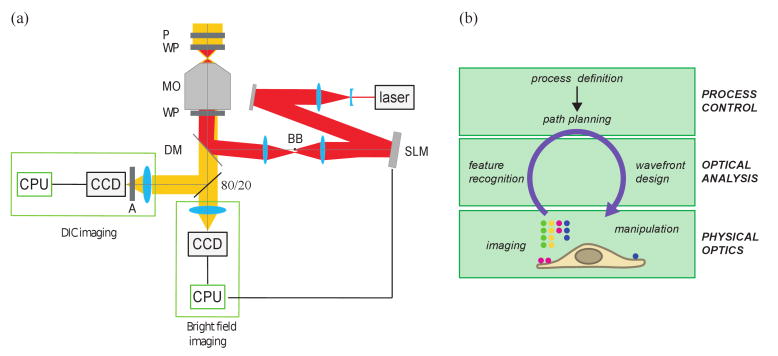
We image samples in two simultaneous channels on an inverted microscope (Nikon TE-2000) (Fig. 1(a)). The bright field channel images microparticles at high temporal and spatial resolution for force measurements. The Differential Interference Contrast (DIC) channel images the morphology of the cell. Light passes through a polarizer (P) and a Wollaston prism (WP) before reaching the sample, which rests in the focal plane of an oil immersion microscope objective 100× NA 1.49 (MO). After passing through a second Wollaston prism (WP) below the objective, the visible light passes through a dichroic mirror (DM). Then a 80/20 beam splitter sends twenty percent of the light to a CCD camera (Marlin, Allied Vision Technologies) to image the beads in bright field. The rest of the light passes through an analyzer (A) before being collected on a second CCD camera (Orca ER, Hamamatsu) to image the cell in DIC. Bright field images are acquired at 5-10 Hz and DIC images at 1 Hz using custom software written in MATLAB on two separate computers.
Fig. 1.
Holographic optical tweezers setup. (a) Schematic layout of the instrument. (b) Schematic layout of the feedback control system.
2.2. Micro-manipulation
A 1064nm wavelength laser beam (Compass 1064 4W, Coherent) is expanded with a first telescope to match the size of the spatial light modulator (SLM) display (HEO 1080P, Holoeye) (Fig. 1(a)). The SLM modulates the phase profile of the laser beam to create the desired pattern of traps in the focal plan [13]. A second telescope fills the effective back aperture of the microscope objective with an image of the SLM. At the intermediate focal plane within the second telescope, a ball bearing (BB) blocks the undiffracted light. The laser beam is reflected by a dichroic mirror (DM) and gets focused by the microscope objective (MO).
2.3. Feedback control system
Our control system, outlined schematically in Fig. 1(b), is implemented in MATLAB [13]. After acquisition, each image is processed to track bead centers [14]. Our spatial resolution is about 3 nm. The coordinates of the new traps' positions are then calculated based on the current position of the beads, as described below. A hologram is then calculated and displayed on the SLM to create the new pattern of traps in the focal plane. We use the method of prisms and lenses [11] which enables the placement of traps with nanometer precision [15].
2.4. Calibration
The stiffnesses of optical tweezers are calibrated from quantification of thermal fluctuations of beads in each trap. The centers of the beads are tracked over time using the algorithms described above. Using Boltzmann statistics, the potential profile is deduced from the probability distribution. Potentials are well-fit by quadratic forms which return the stiffnesses of each trap. To avoid artifacts due to motion blur, we use exposure times less than or equal to 500 μs [16, 17].
2.5. Cell culture, substrate and beads preparation
Aplysia bag cell neurons were cultured on poly-L-lysine-coated coverslips in L15 media (Life Technologies) supplemented with artificial sea water as previously described [18]. The recombinant extracellular domain of apCAM with a C-terminal 6×-His tag was prepared as previously described [19]. A 2% (w/v) stock of 2 μm diameter latex Ni-NTA beads (Micromod) were coated with His-apCAM (600 μg/mL in PBS). Beads were stored in ligand solution at 4°C. Beads were diluted and experiments conducted in a low ionic strength artificial seawater (LIS-ASW) containing (in mM) 100 NaCl, 10 KCl, 15 HEPES, 5 CaCl2, 5 MgCl2, and 60 g/L Glycine at pH 7.8. LIS-ASW was also supplemented with 2 mg/mL BSA, 0.5 mM Vitamin E, and 2 mg/mL Carnosine to block non-specific bead binding and reduce photo-damage from imaging illumination. The chemical and protein reagents were obtained from Sigma-Aldrich.
3. Multiplexed force measurements
During directed migration, cells are capable of generating traction forces on substrates through adhesions in response to biochemical and mechanical stimuli present in their environment. Previous studies showed that restrained beads coated with proteins can act as substrates on which cells can form linkages to the cytoskeleton [20, 21]. As a result, beads restrained with optical tweezers can be used to study the dynamic mechanical response of a cell to localized biochemical and mechanical stimuli [5, 6].
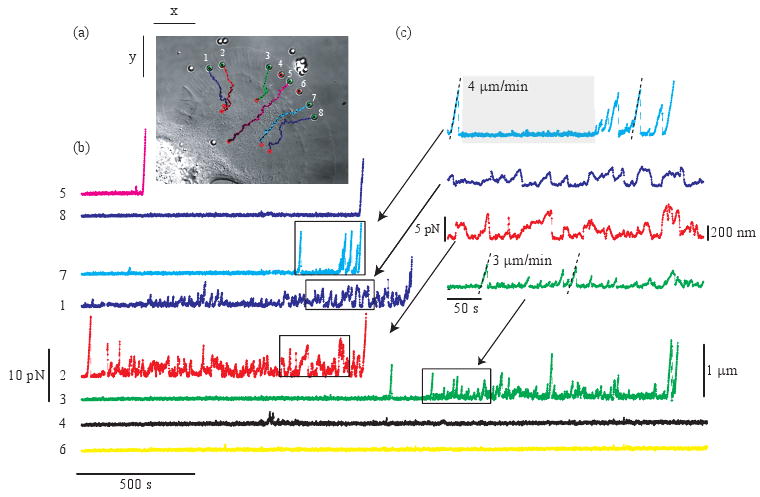
We extend this approach to multiple locations on a single cell with holographic optical tweezers. Eight apCAM-coated beads are placed on the membrane of an Aplysia growth cone with an average distance between beads of about 4/μm as shown in Fig. 2(a). When held near the leading edge, the cell pulls on the beads causing them to be displaced within the traps. Displacements are tracked over time using our centroid tracking algorithm. The forces generated by the cell are then calculated by multiplying the displacement of the beads in the trap by the stiffness of that trap F⃗ = kxΔxx̂ + kyΔyŷ (Fig. 2(b) and movie). We measured the stiffnesses of all the optical traps afterward with identical beads in the same configuration of the traps without a cell. The average stiffness was kx = (11.4 ± 1.2) pN/μm and ky = (10 ± 0.7) pN/μm (mean value across beads ± the standard deviation) where kx and ky are the stiffnesses in the x and y direction respectively as labeled in Fig. 2(a). Since the lamellipodium of an Aplysia growth cone is so thin, about 100 nm, [22] and has very low index mismatch with the surrounding fluid, we do not expect significant changes to the trap stiffnesses due to the cell. Figures 2(a)(Media 1) and (b) display the time dependence of the forces on all the beads.
Fig. 2.

Multiplexed force measurements. (a) (Media 1) Eight apCAM-coated beads are held on the membrane of an Aplysia growth cone with holographic optical tweezers. Bead trajectories are superimposed (points represent bead position every 50 s). Movie: sped up 120 times, field of view 75 × 65 μm, arrows indicate forces generated by the cell. (b) Magnitude of bead displacements and measured forces generated by the cells. (c) Close up of the forces for four of the beads.
Observed forces vary significantly from bead to bead and over time. Sometimes, beads display no directed motion and the distribution of the displacements is similar to that expected for a freely diffusing bead in a trap of the same stiffness as shown, e.g. bead 7 highlighted in gray in Fig. 2(c). These random fluctuations alternate with directed motion toward the axon shaft. In some cases, beads accelerate suddenly to a velocity ranging from 3 to 4 μm/min (e.g. beads 3 and 7). As the beads move away from trap centers, they either escape the traps or rapidly snap back at a few picoNewtons of force. In other cases, beads exhibit an overall directed motion toward the axon shaft but the velocity and the direction appear less deterministic than in the previous case (e.g. beads 1 and 2). These dynamics are reminiscent of that seen by N-Cadherin-coated beads in neurons with a single trap [5].
The directed motion observed is the consequence of the mechanical coupling between the beads and the motion of the underlying F-actin cytoskeleton [1]. Indeed, actin treadmilling at the leading edge and tensile force generated by actin-associated motor proteins result in a net F-actin flow from the leading edge toward the axon shaft called retrograde flow [23, 24]. This mechanical coupling is transient as shown by the intermittent snapping back of displaced beads into trap centers. Furthermore, the time intervals between couplings appear stochastic. Ultimately, most of the beads are tightly coupled to the cell cytoskeleton and move toward the axon shaft at a velocity comparable to the retrograde flow rate.
4. Feedback control system
Cells dynamically regulate adhesions and ultimately traction force in response to mechanical stimuli [6, 20, 21]. This process can be seen as a feedback system consisting of a cycle of force transduction, biochemical signalling and generation of a mechanical response. During neuronal development, cells can adhere to each other through cell adhesion receptors (e.g. apCAM) by mutually adapting their mechanical behaviors. To mimic a cell-cell interaction, we developed a closed-loop force measurement system which adjusts the optical forces applied to each bead to compensate for the cell's mechanical response. Closed-loop force measurements offer additional advantages such as increasing the effective trap stiffness at low frequency and lengthening the experiment [25]. Here we describe the implementation of multiplexed closed-loop force measurements, quantify the efficacy of our system and apply the technique to a live cell.
4.1. Implementation
Our proportional-gain position clamp is implemented in MATLAB. The position of multiple optically trapped beads is determined using our centroid tracking algorithms. The optical traps are then steered according to
| (1) |
where x⃗trap is the trap position, Δt is the feedback loop time, x⃗bead is the bead position, Gp is the proportional gain and x⃗set point is the setpoint position. Each bead is treated independently and simultaneously. The feedback loop time ranges from 0.1 to 0.3 s depending on the size of the field of view and the number of traps.
4.2. Quantification of feedback loop efficiency
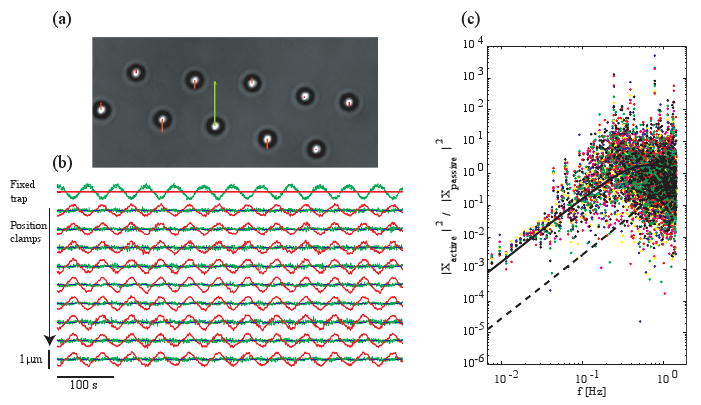
To test our position clamp, a piezoelectric stage applies a sinusoidal drag force to ten beads trapped at about 10 μm from the bottom coverslip (Fig. 3(a)(Media 2)). We tune the drag force in order to mimic the force and time scales of the cell. In the experiment shown in Fig. 2, beads, strongly coupled to the cell, were moving at about 3 μm/min within the trap resulting in a loading rate of about 0.55 pN/s. To achieve a similar velocity and loading rate, the beads are suspended in a poly(ethylene glycol) solution with a viscosity η = 0.08 Pa.s, about 80 times higher than water. The trap stiffnesses are about 15 pN/μm. With these parameters, the average velocity is about 2 μm/min and the maximum loading rate is 0.5 pN/s. A setpoint for each trap is defined and the proportional gain is set to 0.3, the highest possible value which does not cause the bead to oscillate. The feedback loop time is measured to be 0.26 s, the rate limiting steps being image processing and hologram calculation. Nine of the beads are position-clamped and one bead is held in a stationary trap as a reference to account for external forces and any possible instrumental drift (Fig. 3(a)).
Fig. 3.

Position clamp efficiency (a) (Media 2) A sinusoidal drag force is applied to 10 trapped beads with holographic optical tweezers. Nine beads are position-clamped (Gp = 0.3) and one is in a stationary trap (Gp = 0) (bottom center). The arrows represent the error, xbead(t) − xset point(t). Movie: sped up 5 times, 39 × 22 μm. (b) Bead displacements (green), trap positions (red) and setpoint positions (blue). (c) Power spectral density of the position-clamped beads relative to the power spectral density of the reference bead (different color points for different beads, solid line: model for our experiment, dashed line: model for a 30 Hz feedback loop).
Under the sinusoidal drag force, the root mean-squared displacement of the bead held in a stationary trap is 236 nm and the average root mean-squared displacement of the position-clamped beads is 48 ± 8 nm (average ± standard deviation) (Fig. 3(b)). To quantify the frequency dependence of the feedback system, the power spectral density of each clamped-bead is compared to the power spectral density of the reference bead as shown in Fig. 3(c). For frequencies lower than 0.1 Hz, the amplitudes of the displacements of the position-clamped beads are attenuated. At the lowest frequency, the amplitude of the bead motion is attenuated thirty-fold. At higher frequencies, the position clamp is ineffective.
4.3. Modeling the feedback loop efficiency
To understand the measured position clamp efficiency, we derive the expected power spectral density of a position-clamped bead with respect to the power spectral density of a reference bead in the same conditions. Newton's second law for a trapped bead undergoing an external force (ignoring inertia) is
| (2) |
where γ is the hydrodynamic drag and Fext is the external force (drag force and thermal noise). In a proportional-gain position clamp, the trap is steered according to Eq. (1). The time delay, Δt, between acquisition of the image and the update of the hologram is readily accounted for in the frequency domain. Fourier transforming Eqs. (1) and (2), we get
| (3) |
| (4) |
where τ0 = γ/k is the relaxation time of the trap.
Combining Eqs. (3) and (4), we find the power spectral density of a position-clamped bead with respect to the power spectral density of a reference bead is
| (5) |
To compare our experimental data to our model, we use Δt = 0.26 s, τ0 = 0.10 s (calculated from the measured trap stiffness and the Stokes drag from measured viscosity) and Gp = 0.3 (Fig. 3(c), solid line). Without any free parameters, we found a good agreement between our model and the experimental data.
Our video-based feedback is slower than feedback systems that use a quadrant photodetector for motion detection and can operate in the KHz range [8]. However, quadrant detector systems cannot readily detect more than two beads. In conditions mimicking the time and force scales of the cell, our feedback system operating at 4 Hz can control the motion of nine beads up to 0.1 Hz. Based on our model, control of bead motion up to 1 Hz may be achieved by speeding up the feedback loop to 30 Hz, which is within the range of speeds for conventional CCD cameras, as indicated by the dashed line in Fig. 3(c).
4.4. Closed-loop force measurements on live cells
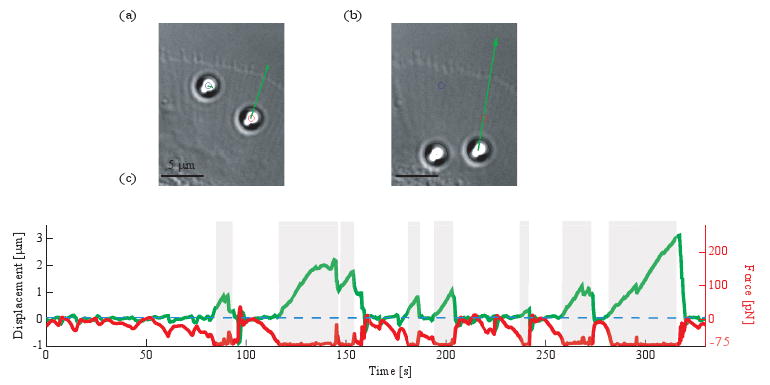
We apply our feedback system to measure coupling dynamics on a live cell. Two apCAM-coated beads are placed near the leading edge of a growth cone with holographic optical tweezers. One of the beads is controlled actively while the other one is kept in a stationary trap as a reference (Fig. 4(a)(Media 3)). To recover beads that move too far, the position clamp switches reversibly to a force clamp whenever the forces generated by the cell reach the maximum optical force (Fig. 4(a) and (b)). In a force clamp, the trap is kept at a fixed distance from the bead so that the maximum optical force is constantly applied to the bead. The direction of the optical forces points from the bead to the setpoint. In this experiment, the measured stiffness of each trap is 75 pN/μm and the proportional gain is set at 0.3.
Fig. 4.

Closed-loop force measurement on a live cell (a) (Media 3) Left bead is in a fixed trap (Gp = 0), right bead is in an active trap (Gp = 0.3). Both beads are pulled toward the axon shaft (arrow represents the optical forces). Movie: sped up 30 times, 42 × 54 μm. (b) Force-clamped bead is being displaced toward the axon shaft. (c) Displacement of the bead (green) and optical forces projected along the underlying filopodium (red) over time (shaded regions indicate times when the bead is force-clamped).
When the bead is held on the membrane of the cell, the optical forces are adapted in response to the forces applied by the cell on the bead. At first, the position-clamped bead remains within 50 ± 38nm from the setpoint while the optical forces are dynamically changing (Fig. 4(c)). In some cases, fast relaxation of the bead into the center of the trap is observed causing the beads to overshoot pass the setpoint. In other cases, if the optical forces reach the maximum value, 75 pN, the feedback loop switches into force clamp. Held under constant force, the bead moves at a constant rate toward the axon shaft revealing a strong mechanical coupling between the bead and the cell. However, transient slippage events are also observed suggesting that the coupling to the underlying cytoskeleton weakens intermittently.
5. Conclusions
Calibrated holographic optical tweezers can be used to study mechanical properties of live cells in open-loop and closed-loop measurements. We observed that the coupling dynamics between an Aplysia growth cone and multiple apCAM-coated beads is intermittent, stochastic and varies from bead to bead. Improvements to the basic technique such as faster feedback loops and higher forces might reveal other dynamics not probed by our current setup. Combining this technique with the imaging of cytoskeletal proteins and drug treatments will offer unique opportunities for investigating the biophysical basis of cell adhesion and related motility.
Acknowledgments
The authors acknowledge support from the National Institutes of Health (1U54-RR022232, R01 NS28695, R01 NS051786) and National Science Foundation (DBI-0619674).
References and links
- 1.Lin CH, Forscher P. Growth cone advance is inversely proportional to retrograde F-actin flow. Neuron. 1995;14:763–771. doi: 10.1016/0896-6273(95)90220-1. [DOI] [PubMed] [Google Scholar]
- 2.Geiger B, Spatz JP, Bershadsky AD. Environmental sensing through focal adhesions. Nat Rev Mol Cell Biol. 2009;10:21–33. doi: 10.1038/nrm2593. [DOI] [PubMed] [Google Scholar]
- 3.Sabass B, Gardel ML, Waterman CM, Schwarz US. High resolution traction force microscopy based on experimental and computational advances. Biophys J. 2008;94:207–220. doi: 10.1529/biophysj.107.113670. [DOI] [PMC free article] [PubMed] [Google Scholar]
- 4.Lo CM, Wang HB, Dembo M, Wang YL. Cell movement is guided by the rigidity of the substrate. Biophys J. 2000;79:144–152. doi: 10.1016/S0006-3495(00)76279-5. [DOI] [PMC free article] [PubMed] [Google Scholar]
- 5.Bard L, Boscher C, Lambert M, Mege RM, Choquet D, Thoumine O. A molecular clutch between the actin flow and N-cadherin adhesions drives growth cone migration. J Neurosci. 2008;28:5879–5890. doi: 10.1523/JNEUROSCI.5331-07.2008. [DOI] [PMC free article] [PubMed] [Google Scholar]
- 6.Choquet D, Felsenfeld DP, Sheetz MP. Extracellular matrix rigidity causes strengthening of integrin-cytoskeleton linkages. Cell. 1997;88:39–48. doi: 10.1016/s0092-8674(00)81856-5. [DOI] [PubMed] [Google Scholar]
- 7.Allioux-Guerin M, Icard-Arcizet D, Durieux C, Henon S, Gallet F, Mevel JC, Masse MJ, Tramier M, Coppey-Moisan M. Spatiotemporal analysis of cell response to a rigidity gradient: a quantitative study using multiple optical tweezers. Biophys J. 2009;96:238–247. doi: 10.1529/biophysj.108.134627. [DOI] [PMC free article] [PubMed] [Google Scholar]
- 8.Lang MJ, Asbury CL, Shaevitz JW, Block SM. An automated two-dimensional optical force clamp for single molecule studies. Biophys J. 2002;83:491–501. doi: 10.1016/S0006-3495(02)75185-0. [DOI] [PMC free article] [PubMed] [Google Scholar]
- 9.Emiliani V, Sanvitto D, Zahid M, Gerbal F, Coppey-Moisan M. Multi force optical tweezers to generate gradients of forces. Opt Express. 2004;12:3906–3910. doi: 10.1364/opex.12.003906. [DOI] [PubMed] [Google Scholar]
- 10.Dufresne ER, Grier DG. Optical tweezer arrays and optical substrates created with diffractive optics. Rev Sci Instrum. 1998;69:1974–1977. [Google Scholar]
- 11.Liesener J, Reicherter M, Haist T, Tiziani HJ. Multi-functional Optical Tweezers Using Computer-Generated Holograms. Opt Commun. 2000;185:77–82. [Google Scholar]
- 12.van der Horst A, Forde NR. Calibration of dynamic holographic optical tweezers for force measurements on biomaterials. Opt Express. 2008;16:20987–21003. doi: 10.1364/oe.16.020987. [DOI] [PubMed] [Google Scholar]
- 13.Chapin SC, Germain V, Dufresne ER. Automated trapping, assembly, and sorting with holographic optical tweezers. Opt Express. 2006;14:13095–13100. doi: 10.1364/OE.14.013095. [DOI] [PMC free article] [PubMed] [Google Scholar]
- 14.Crocker JC, Grier DG. Methods of digital video microscopy for colloidal studies. J Colloid Interface Sci. 1996;179:298–310. [Google Scholar]
- 15.Schmitz CHJ, Spatz JP, Curtis JE. High-precision steering of multiple holographic optical traps. Opt Express. 2005;13:8678–8685. doi: 10.1364/opex.13.008678. [DOI] [PubMed] [Google Scholar]
- 16.Wong WP, Halvorsen K. The effect of integration time on fluctuation measurements: calibrating an optical trap in the presence of motion blur. Opt Express. 2006;14:12517–12531. doi: 10.1364/oe.14.012517. [DOI] [PubMed] [Google Scholar]
- 17.Savin T, Doyle PS. Static and dynamic errors in particle tracking microrheology. Biophys J. 2005;88:623–638. doi: 10.1529/biophysj.104.042457. [DOI] [PMC free article] [PubMed] [Google Scholar]
- 18.Forscher P, Kaczmarek LK, Buchanan JA, Smith SJ. Cyclic-AMP induces changes in distribution and transport of organelles within growth cones of Aplysia bag cell neurons. J Neurosci. 1987;7:3600–3611. doi: 10.1523/JNEUROSCI.07-11-03600.1987. [DOI] [PMC free article] [PubMed] [Google Scholar]
- 19.Suter DM, Schaefer AW, Forscher P. Microtubule dynamics are necessary for Src family kinase-dependent growth cone steering. Curr Biol. 2004;14:1194–1199. doi: 10.1016/j.cub.2004.06.049. [DOI] [PubMed] [Google Scholar]
- 20.Suter DM, Errante LD, Belotserkovsky V, Forscher P. The Ig superfamily cell adhesion molecule, apCAM, mediates growth cone steering by substrate-cytoskeletal coupling. J Cell Biol. 1998;141:227–240. doi: 10.1083/jcb.141.1.227. [DOI] [PMC free article] [PubMed] [Google Scholar]
- 21.Schaefer AW, Schoonderwoert VTG, Ji L, Mederios N, Danuser G, Forscher P. Coordination of actin filament and microtubule dynamics during neurite outgrowth. Dev Cell. 2008;15:146–162. doi: 10.1016/j.devcel.2008.05.003. [DOI] [PMC free article] [PubMed] [Google Scholar]
- 22.Grzywa EL, Lee AC, Lee GU, Suter DM. High-resolution analysis of neuronal growth cone morphology by comparative atomic force and optical microscopy. J Neurobiol. 2006;66:1529–1543. doi: 10.1002/neu.20318. [DOI] [PubMed] [Google Scholar]
- 23.Lin CH, Espreafico EM, Mooseker MS, Forscher P. Myosin drives retrograde F-actin flow in neuronal growth cones. Neuron. 1996;16:769–782. doi: 10.1016/s0896-6273(00)80097-5. [DOI] [PubMed] [Google Scholar]
- 24.Medeiros NA, Burnette DT, Forscher P. Myosin II functions in actin-bundle turnover in neuronal growth cones. Nat Cell Biol. 2006;8:215–226. doi: 10.1038/ncb1367. [DOI] [PubMed] [Google Scholar]
- 25.Wallin AE, Ojala H, Haeggstrom E, Tuma R. Stiffer optical tweezers through real-time feedback control. Appl Phys Lett. 2008;92:224104. [Google Scholar]


