Abstract
We present the design, synthesis, and biological applications of Mitochondria Peroxy Yellow 1 (MitoPY1), a new type of bifunctional fluorescent probe for imaging hydrogen peroxide levels within the mitochondria of living cells. MitoPY1 combines a chemoselective boronate-based switch and a mitochondrial-targeting phosphonium moiety for detection of hydrogen peroxide localized to cellular mitochondria. Confocal microscopy and flow cytometry experiments in a variety of mammalian cell types show that MitoPY1 can visualize localized changes in mitochondrial hydrogen peroxide concentrations generated by situations of oxidative stress.
Hydrogen peroxide (H2O2) is an increasingly recognized small-molecule mediator of physiology, aging, and disease in living organisms.1–6 In this regard, aberrant production or accumulation of H2O2 within cellular mitochondria over time due to environmental stress(es) and/or genetic mutation(s) is connected to serious diseases where age is a risk factor, including cancer7 and neurodegenerative Alzheimer’s, Parkinson’s, and Huntington’s diseases.8,9 Indeed, overexpression and mitochondrial targeting of catalase, a peroxide-detoxifying enzyme, can increase life span in mouse models.10 On the other hand, newer data suggest that controlled bursts of mitochondrial H2O2 can also serve beneficial roles for cell survival, growth, differentiation, and maintenance.3–6
New imaging methods that allow visualization of localized production and accumulation of mitochondrial H2O2 in living samples are potentially useful for disentangling the complex contributions of this reactive oxygen species (ROS) to both healthy and diseased states. Synthetic fluorescent H2O2 indicators that can be targeted to precise subcellular locations offer one approach to this goal and do not require transfection like their protein counterparts,11–12 but traditional ROS indicators such as dihydrorhodamine (DHR) are uncharged and hence not preferentially localized in cells before oxidation.13 In addition, DHR and related dyes are not specific for H2O2 over other ROS. Accordingly, mitochondrial-targeted small molecules for detection of specific ROS remain rare13,14 and none of the probes reported to date are selective for H2O2. We now report the synthesis and applications of Mitochondria Peroxy Yellow 1 (MitoPY1), a new type of fluorophore for imaging mitochondrial H2O2 in living cells with ROS and spatial specificity.
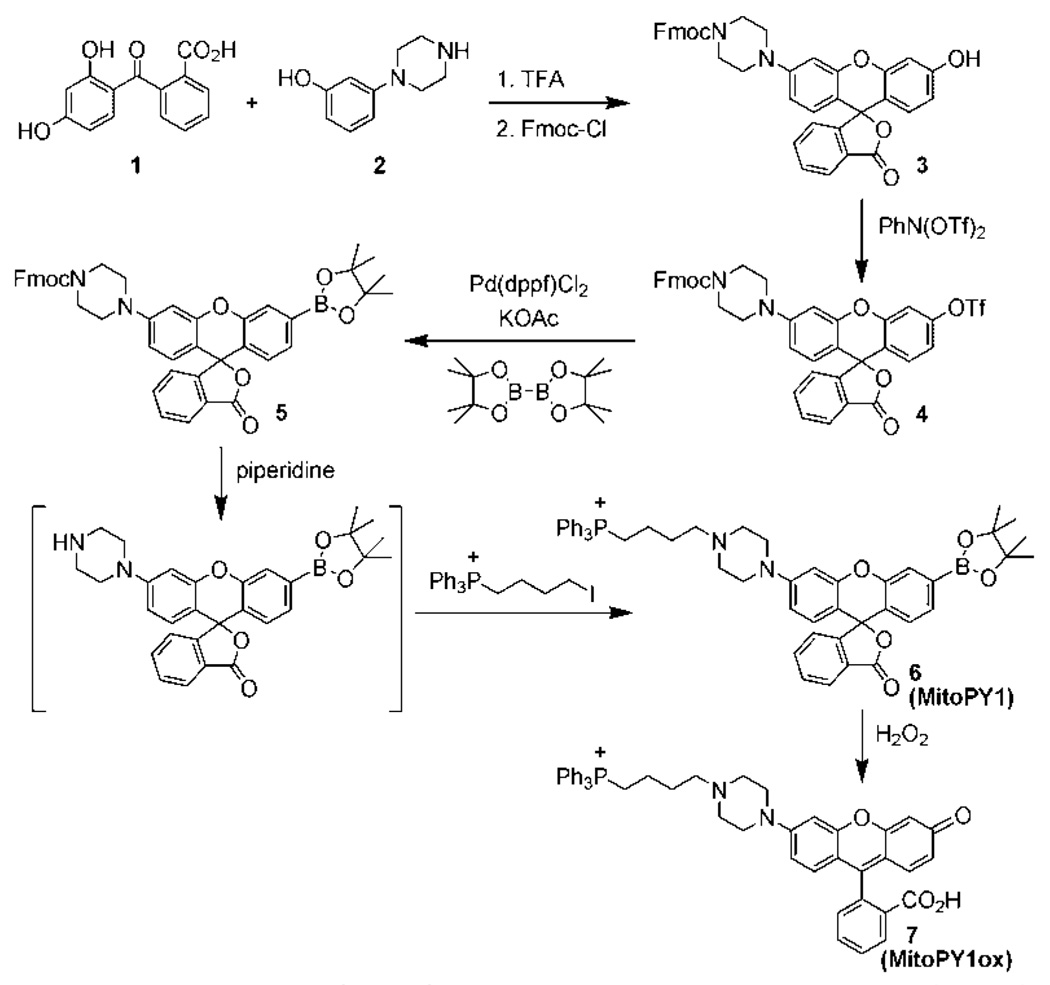
Our overall strategy for fluorescence imaging of mitochondrial H2O2 in living systems is to create bifunctional dyes that contain both a peroxide-responsive element and a mitochondrial-targeting moiety. For the latter purpose, we were inspired by the use of phosphonium head groups by Murphy and others to deliver antioxidants, electrophiles, and EPR and optical probes to mitochondria, as these and related lipophilic cations selectively accumulate in this organelle due to proton gradient considerations.14–16 In addition, we sought a modular synthetic route that would allow facile introduction of a phosphonium or any other desired targeting group after installation of the boronate switch, which circumvents potential complications arising from sensitive functionalities that are incompatible with palladium-catalyzed Miyaura-Suzuki reactions typically used to introduce the H2O2-cleavable boronate cage. Both of these design criteria can be met by the approach outlined in Scheme 1 for the synthesis of MitoPY1. The ability to append additional groups post-boronation offers a host of opportunities for generating new multifunctional H2O2 imaging probes.
Scheme 1.
Synthesis and Activation of MitoPY1
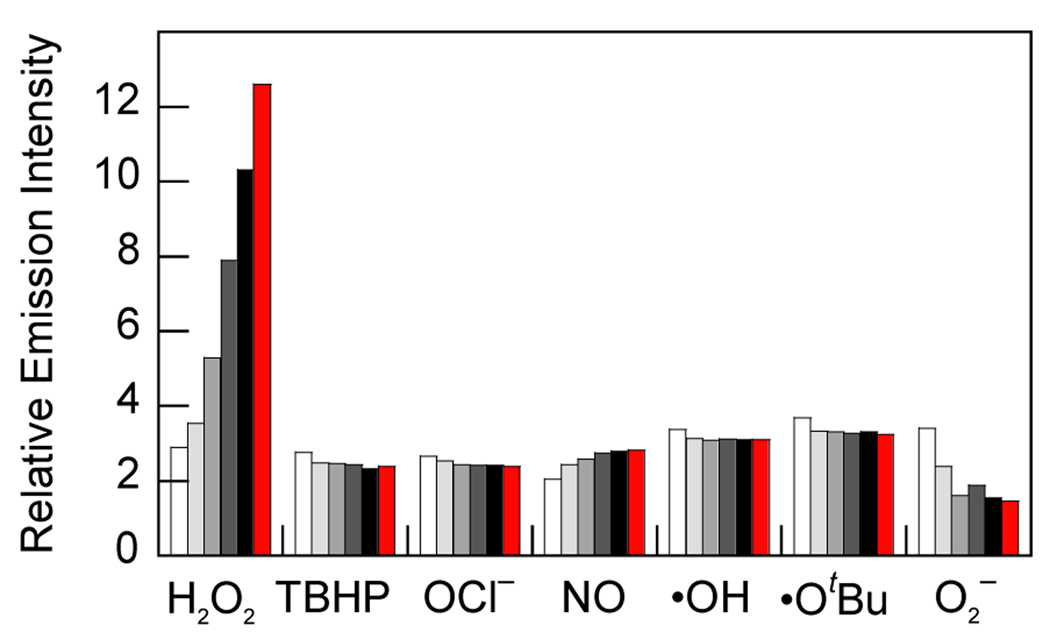
MitoPY1 features two major visible region absorptions (λabs = 489 nm, ε = 14,300 M−1cm−1; 510 nm, ε = 14,200 M−1cm−1) and a weak emission (λem = 540 nm, Φ = 0.019, Figure S1) in 20 mM HEPES, pH 7. Reaction of MitoPY1 with H2O2 triggers a fluorescence increase by its conversion to MitoPY1ox, which possesses one major absorption band at 510 nm (ε = 22,300 M−1cm−1) and enhanced emission (λem = 528 nm, Φ =0.405). Kinetics measurements of the H2O2-mediated boronate deprotection were performed under pseudo-first-order conditions (5 µM dye, 10 mM H2O2), giving an observed rate constant of k = 2.0(1) × 10−3 s−1. Figure 1 shows the relative turn-on fluorescence responses of MitoPY1 to a panel of biologically relevant ROS. Owing to its chemospecific boronate switch,17,18 the probe is selective for H2O2 over ROS like superoxide, nitric oxide, and hydroxyl radical.
Figure 1.
Fluorescence responses of 5 µM MitoPY1 to various reactive oxygen species (ROS). Bars represent relative responses at 0, 5, 15, 30, 45, and 60 min after addition of each ROS. Data shown are for 10 mM O2−, 200 µM NO, and 100 µM for all other ROS. Data were acquired at 25 °C in 20 mM HEPES, pH 7, with excitation λ = 503 nm and emission collected between 510 and 750 nm.
MitoPY1 was then tested for its ability to both target the mitochondria and respond to H2O2 in living biological systems. Cervical cancer HeLa cells loaded with 5 µM MitoPY1 for 1 h at 37 °C show faint but measurable levels of fluorescence in discrete subcellular locations as determined by confocal microscopy (Figure 2a). Co-staining experiments with 50 nM MitoTracker Deep Red, a commercially-available mitochondrial indicator (Figures 2b, 2c), or 500 nM LysoTracker Red, a lysosomal indicator (Figures S4–S7), establish that the observed fluorescence from MitoPY1 is localized to the mitochondria of these live cells. Addition of 100 µM H2O2 to HeLa cells loaded with MitoPY1 display a marked localized increase in fluorescence compared to control cells (Figure 2d–2f). Again, co-staining with MitoTracker confirms that the dye is retained in the mitochondria and detects localized rises in H2O2 concentrations. Brightfield measurements and nuclear staining with Hoechst 33342 indicate that the cells are viable throughout the imaging experiments (Figures 2b, 2e, 2g). In addition, control experiments using a probe lacking the phosphonium targeting moiety (ContPY1, Figure S9–S12) or the oxidized probe (MitoPY1ox, Figure S13–S18) confirm that only MitoPY1 targets the mitochondria, and complementary flow cytometry experiments (Figure S8) provide supporting data over a larger population of cells. Finally, analogous experiments in Cos-7, HEK293, and CHO.K1 cell lines give similar results and expand the scope of the probe (Figure S5–S7). Taken together, these data establish that MitoPY1 is targeted to cellular mitochondria, where it can respond to localized changes in H2O2 levels in living samples.
Figure 2.
Confocal fluorescence images of live HeLa cells with increases in mitochondrial H2O2 levels visualized using MitoPY1. Images displayed represent emission intensities collected in optical windows between 527–601 nm upon excitation at 510 nm for MitoPY1. HeLa cells incubated with 5 µM MitoPY1 for 60 min at 37 °C and imaged with MitoPY1 (a), MitoTracker Red and Hoechst (overlay, b), and MitoPY1 with MitoTracker Red (overlay, c). HeLa cells incubated with 5 µM MitoPY1 for 60 min at 37 °C with 100 µM H2O2 added for the final 40 min and imaged with MitoPY1 (d), MitoTracker Red and Hoechst (overlay, e), MitoPY1 and MitoTracker Red (overlay, f), and brightfield (g) with 20 µm scale bar. HeLa cells incubated with 5 µM MitoPY1 for 60 min at 37 °C and imaged with MitoPY1 (h), MitoTracker Red and Hoechst (overlay, i), and MitoPY1 with MitoTracker Red (overlay, j). HeLa cells incubated for 24 h with 1 mM paraquat, then washed and incubated with 5 µM MitoPY1 for 60 min at 37 °C and imaged with MitoPY1 (k), MitoTracker Red and Hoechst (overlay, l), MitoPY1 and MitoTracker Red (overlay, m), and brightfield (n) with 20 µm scale bar.
Finally, we sought to utilize MitoPY1 to visualize endogenous production of H2O2 in the mitochondria of living cells. To this end, we treated HeLa cells with paraquat, a small-molecule inducer of oxidative stress that produces Parkinson’s-like phenotypes.19 The images in Figures 2h–2n show clear increases in mitochondrial-localized H2O2 levels detected with MitoPY1 within cells that had been exposed to 1 mM paraquat compared to control cells (IC50 of paraquat in HeLa cells is 1.02 mM).20 These data indicate that MitoPY1 is sensitive enough to detect local mitochondrial H2O2 elevations associated with oxidative stress in this Parkinson’s model.
To close, we have presented the synthesis, properties, and biological applications of MitoPY1, a new targeted fluorescent probe that can selectively detect H2O2 in the mitochondria of living cells. Our data show that MitoPY1 is capable of imaging changes in the levels of H2O2 within the mitochondria of a variety of mammalian cell lines, as well as H2O2 elevations caused by an oxidative stress model of Parkinson’s disease. In addition to applying MitoPY1 and related chemical tools for studies of mitochondrial redox biology, we anticipate that this modular probe scaffold should prove useful for creating new multifunctional probes for targeting, activation, and detection in living systems and are actively pursuing these possibilities.
Supplementary Material
Acknowledgment
We thank the Beckman, Packard, and Sloan Foundations, and the NIH (GM 79465) for providing funding for this work. B.C.D. thanks the NIH Chemical Biology Graduate Program (T32 GM066698) for support. We thank Holly Aaron (UCB Molecular Imaging Center) and Ann Fischer (UCB Tissue Culture Facility) for expert technical assistance.
Footnotes
Supporting Information Available: Synthetic and experimental details (PDF). This material is available free of charge via the Internet at http://pubs.acs.org
References
- 1.Rhee SG. Science. 2006;312:1882–1883. doi: 10.1126/science.1130481. [DOI] [PubMed] [Google Scholar]
- 2.Stone JR, Yang S. Antioxid. Redox Signal. 2006;8:243–270. doi: 10.1089/ars.2006.8.243. [DOI] [PubMed] [Google Scholar]
- 3.Veal EA, Day AM, Morgan BA. Molecular Cell. 2007;26:1–14. doi: 10.1016/j.molcel.2007.03.016. [DOI] [PubMed] [Google Scholar]
- 4.D'Autréaux B, Toledano MB. Nat. Rev. Mol. Cell Biol. 2007;8:813–824. doi: 10.1038/nrm2256. [DOI] [PubMed] [Google Scholar]
- 5.Giorgio M, Trinei M, Migliaccio E, Pelicci PG. Nat. Rev. Mol. Cell Biol. 2007;8:722–728. doi: 10.1038/nrm2240. [DOI] [PubMed] [Google Scholar]
- 6.Poole LB, Nelson KJ. Curr. Opin. Chem. Biol. 2008;12:18–24. doi: 10.1016/j.cbpa.2008.01.021. [DOI] [PMC free article] [PubMed] [Google Scholar]
- 7.Finkel T, Serrano M, Blasco MA. Nature. 2007;448:767–774. doi: 10.1038/nature05985. [DOI] [PubMed] [Google Scholar]
- 8.Barnham KJ, Masters CL, Bush AI. Nat. Rev. Drug Discovery. 2004;3:205–214. doi: 10.1038/nrd1330. [DOI] [PubMed] [Google Scholar]
- 9.Lin MT, Beal MF. Nature. 2006;443:787–795. doi: 10.1038/nature05292. [DOI] [PubMed] [Google Scholar]
- 10.Schriner SE, Jinford NJ, Martin GM, Treuting P, Ogburn CE, Emond M, Coskun PE, Ladiges W, Wolf N, Van Remmen H, Wallace DC, Rabinovitch PS. Science. 2005;308:1909–1911. doi: 10.1126/science.1106653. [DOI] [PubMed] [Google Scholar]
- 11.Belousov VV, Fradkov AF, Lukyanov KA, Staroverov DB, Shakhbazov KS, Terskikh AV, Lukyanov S. Nat. Methods. 2006;3:281–286. doi: 10.1038/nmeth866. [DOI] [PubMed] [Google Scholar]
- 12.Hanson GT, Aggeler R, Oglesbee D, Cannon M, Capaldi RA, Tsien RY, Remington S. J. Biol. Chem. 2004;279:13044–13053. doi: 10.1074/jbc.M312846200. [DOI] [PubMed] [Google Scholar]
- 13.Koide Y, Urano Y, Kenmoku S, Kojima H, Nagano T. J. Am. Chem. Soc. 2007;129:10324–10325. doi: 10.1021/ja073220m. [DOI] [PubMed] [Google Scholar]
- 14.Robinson KM, Janes MS, Pehar M, Monette JS, Ross MF, Hagen TM, Murphy MP, Beckman JS. Proc. Nat. Acad. Sci. 2006;103:15038–15043. doi: 10.1073/pnas.0601945103. [DOI] [PMC free article] [PubMed] [Google Scholar]
- 15.Murphy MP, Smith RA. Annu. Rev. Pharmacol. Toxicol. 2007;47:629–656. doi: 10.1146/annurev.pharmtox.47.120505.105110. [DOI] [PubMed] [Google Scholar]
- 16.Hardy M, Chalier F, Ouari O, Finet J, Rockenbauer A, Kalyanaraman B, Tordo P. Chem. Commun. 2007:1083–1085. doi: 10.1039/b616076j. [DOI] [PubMed] [Google Scholar]
- 17.Chang MCY, Pralle A, Isacoff EY, Chang CJ. J. Am. Chem. Soc. 2004;126:15392–15393. doi: 10.1021/ja0441716. [DOI] [PMC free article] [PubMed] [Google Scholar]
- 18.Miller EW, Tulyathan O, Isacoff EY, Chang CJ. Nat. Chem. Biol. 2007;3:263–267. doi: 10.1038/nchembio871. [DOI] [PubMed] [Google Scholar]
- 19.McCormack AL, Thiruchelvam M, Manning-Bog AB, Thiffault C, Langtson JW, Cory-Clechta DA, Di Monte DA. Neurobiol. Dis. 2002;10:119–127. doi: 10.1006/nbdi.2002.0507. [DOI] [PubMed] [Google Scholar]
- 20.Park SY, Choi J. Environ. Int. 2007;33:817–822. doi: 10.1016/j.envint.2007.03.014. [DOI] [PubMed] [Google Scholar]
Associated Data
This section collects any data citations, data availability statements, or supplementary materials included in this article.


