

Abstract
Histone modifications are highly linked to DNA methylation and together they exert epigenetic control over many activities in the cell including gene transcription. Using a streamlined mass spectrometric approach to determine changes in modification states in the first 50 residues of histone H3, we found a decrease in the global methylation states of H3.1 at Lys 9, Lys 14 and Lys 27 after inhibition of DNA methyltransferases by 5-aza-2′-deoxycytidine. Collisional ion dissociation methods proved adequate to determine site-specific H3 PTMs because ample backbone bonds are cleaved between each modification site and PTMs were stable to MS/MS using threshold fragmentation in a linear ion trap (LTQ). Our assay allows for a quick profiling and site-specific interrogation of modification states on the first 50 residues of H3 and is directly applicable to H3.1, H3.2 or H3.3 using most OrbiTrap, FT ICR, or TOF mass spectrometers.
Keywords: Mass spectrometry, histone H3, FTMS, DNA methyltransferases
Introduction
Histones are important nuclear proteins which form a structural unit known as the nucleosome to facilitate genome packaging[1]. The function of histone proteins is highly regulated by covalent modifications such as methylation, acetylation and phosphorylation mostly present on their N-terminal tails[2]. Different PTM states may effect chromatin remodeling processes and the accessibility of transcription factors to DNA[2; 3], consequently influencing gene transcription, cell development and even establishment of cancer[4]. Combinations of PTMs present on a given locus encode specific information which triggers binding of protein complexes with various recognition domains for different histone “codes” (i.e., distinct PTM combinations). H3 is the most highly modified histone and in mammals it is expressed as three main variants (H3.1, H3.2 and H3.3). Some of the best studied residues and modifications involved in cancer, cell development and cell cycle include Lys 4[5], Lys 9[6] and Lys 27 which have been shown to be highly methylated[7]. In addition to methylation, multiple sites of acetylation and phsophorylation have also been reported on the histone H3 tail[8; 9; 10]. Further, expression of H3 variants is also important in different cellular activities[11; 12]. Di- and tri-methylation on Lys 9 have been shown to be PTM states that are recognized by the protein HP1 which is highly important in establishing and maintaining heterochromatin[13; 14; 15; 16]. Additionally, Lys 9 and Lys 27 methylation states have been linked to recruitment of enzymes responsible for DNA methylation[17].
Mass spectrometry (MS) using either “bottom up” or “top down” techniques have proven very useful for characterization of histone PTMs[18]. MS methods which use excessive digestions can lose information on combinations of PTMs which can be very important for protein function. Top down MS allows detection of histone codes and changes in bulk histone profiles, in addition to definitive identification of specific histone variants and their modifications that might not have been appreciated by older MS methods or Western blotting. The net effect of all these strategies is to provide site-specific information for PTMs and a “bird's eye” profile of histone forms that arise from multiple modifications. In a second step, gas phase fragmentation provides site-specific localization and quantitation of percent occupancy for specific modifications[19].
In our hands, the “top down” philosophy uses Fourier-Transform MS with collisional- or electron-based ion fragmentation approaches to interrogate all core histones at the intact protein level. Individual forms of full length H3 (15 kDa) are rather difficult to interrogate by top down MS/MS, whereas this is far easier on the N-terminal 50 residues liberated by treatment with endoproteinase Glu-C [20]. We have applied this “middle down” approach followed by MS/MS fragmentation to histone H3.1 from cells treated with DNA methylating inhibitor 5-aza-dC, one of the most traditionally used inhibitors of DNA methyl transferases (DNMTs).
DNA methylation is a well studied mechanism by which cells are able to control gene activity (usually suppressing it), and the enzymes responsible for this function belong to the DNMT family[21; 22]. These enzymes catalyze methylation of cytosine at position 5 with S-adenosyl-methionine acting as the donor and they belong to four different classes: DNMT1, DNMT3a, DNMT3b, DNMT3L. DNMT3a and DNMT3b are known as de novo methyltransferases[23] which function during embryogenesis, while DNMT1 functions to maintain methylation states during replication[17]. DNMT1 methylates hemi-methylated sites in the context of double stranded DNA[24].
5-aza-dC, a well established inhibitor gets metabolically incorporated into DNA causing DNMT enzymes to covalently bind once they encounter the substituent of regular cytosine. Once this occurs the amount of DNMT available gets reduced dramatically resulting in inhibition of DNA methylation. 5-aza-dC has been shown to have a preference towards forming DNMT3-DNA adducts leading to apoptosis[25]. Studying the reciprocity between DNA methylation and histone methylation states is of high importance in epigentics and is explored further here with a protocol tailored for the H3 tail using methodology for high-resolution tandem mass spectrometry.
Materials and Methods
Histone H3 Extraction and Separation
HeLa S3 cells (purchased from ATCC) were maintained at a density of 2–4 × 10⁵ cells/mL in spinner flasks in Joklik's modified MEM supplemented with 5-10% newborn calf serum. Cells were collected by centrifugation, washed twice in cold tris-buffered saline (PBS) and then lysed in nucleus isolation buffer (15 mM Tris-HCl pH 7.5, 60 mM KCl, 15 mM NaCl, 5 mM MgCl2, 1 mM CaCl2, 250 mM sucrose, 1 mM dithiothreitol, 5 nM microcystin-LR, 500 μM 4-(2-aminoethyl)benzenesulphonyl fluoride, 10 mM sodium butyrate), supplemented with 0.3% NP-40 followed by low-speed centrifugation to purify nuclei. Histones were extracted by incubating isolated nuclei with 0.4 N H2SO4 on ice for 1 h with intermittent mixing. Acid insoluble material was removed by centrifugation, trichloroacetic acid was added to the supernatant (20% w/v final) and the precipitated core histones were recovered by centrifugation after several hours of incubation on ice. The pellet was washed with acetone + 0.1% HCl, followed by two washes with 100% acetone, dried, and resuspended in water. H3 was then separated from other proteins by reverse phase HPLC (RPLC) on a Phenomenex C18 column (4.6 × 250 mm). Approximately 200 μg of crude acid-extracted protein was separated using a multi-step gradient from 100% A (5% acetonitrile, 0.1% TFA) to 100% B (90% acetonitrile, 0.094% TFA) at a constant flow rate of 0.8 mL/min. Protein elution was monitored at 214 nm, and H3.1 (approximately 50 μg) eluted as a single peak. HeLa cells ∼ 2×10⁵ cells/mL were treated with 1 μM 5-aza-2′-deoxycytidine (Calbiochem) for three and five days after which the cells were harvested and H3.1 was purified as described above.
H3 Glu-C digestion and HPLC separation
H3.1 was resuspended in 100 μL of 25 mM NH4HCO3 pH 4.0 and Glu-C (Roche) was added at a final ratio of 10:1 (protein to enzyme). The reaction was allowed to proceed for ∼ 4 h at room temperature and the mixture was loaded into a 4.6 mm × 250 mm C18 HPLC column. H3.1 peptides were separated on a 0-56 % buffer B (90 % acetonitrile with 0.2 % TFA) gradient over 56 min. while monitoring the absorbance at 214 nm. The 1-50 piece of H3 was collected and evaporated to dryness.
Mass spectrometry and western blots
H3.1 MS data were collected on a 12 Tesla LTQ FT Ultra instrument. The 1-50 amino acid peptide was resuspended in 30 μL of ESI solution and 10 μL was loaded to a Triversa nanospray robot (Advion BioSciences, Ithaca, NY). After broadband analysis each peak of interest was subjected to a tight window isolation of 2 m/z followed by MS/MS fragmentation by either Electron Capture Dissociation (ECD) or Collision Induced Dissociation (CID). All data validation was done using ProSight PC 2.0 software (Thermo Fisher Scientific, San Jose, CA) in single protein mode. Relative ratios determined from this experiment should be treated as semi- quantitative (so ∼5-20% errors in abundance ratios are possible)[19]. For western blot analysis, HeLa cells were harvested and subjected to acid extraction as previously described. Antibodies used against full length H3: rabbit polyclonal anti (di-me) H3 Lys 9 and rabbit polyclonal anti acetyl Lys 9 were purchased from Upstate Cell Signaling Solutions.
Results
Histone H3 is expressed as three different variants in HeLa cells (H3.1, H3.2 and H3.3)[11], however the amino acid differences are significant enough so each one of the forms separates as an individual peak in the HPLC chromatogram. H3.1 and H3.2 are highly similar to each other and histone H3.1was the only variant individually purified, Glu-C digested and analyzed for changes after inhibition of DNA methylation. Individual forms of intact H3.1 are difficult to analyze by top down mass spectrometry due to the large amount of PTMs present (up to 18 methyl equivalents)[20]. The Δm difference between a trimethylation and acetylation group is only 36 mDa, complicating their differentiation for ions above 10 kDa and low S/N. To avoid this complexity we digested the sample by using the protease Glu-C, which generates an N-terminal piece of H3.1 including the first fifty amino acids[20]. The digestion facilitates quick analysis (vide infra) and maintains the PTM information present in many key residues including Lys 4, Lys 9, Lys 27 and Lys 36. The 1-50 digested peptide was further separated on the HPLC from the rest of the Glu-C generated peptide mixture.
The 1-50 peptide was introduced into the mass spectrometer and a broadband view of all the forms present was obtained (Figure 1A and B). Individual H3.1 forms were selected in the next step and subjected to MS/MS analysis by either CID or ECD (Figure 1C). The intact profile of the 1-50 peptide from the asynchronous/untreated HeLa cells indicates the protein is heavily modified with up to eleven methyl equivalents (i.e., increments of 14 Da). In addition, the N-terminal 1-50 piece of H3 isolated from untreated cells was also found to be acetylated. Phosphorylation or N-terminal acetylation were not observed on the 1-50 H3.1 peptide. As shown in Figure 2A the most abundant forms expressed in untreated cells have 5 to 8 methyl equivalents in addition to the forms that have dimethyl in addition to mono or diacetyl groups.
Figure 1.

General work flow for H3.1 analysis. A) Broadband of H3.1 1-50 peptide after it is separated and purified by HPLC from Glu-C digestion. B) Enhanced broadband spectrum of H3.1 1-50 peptide on a 12T LTQ-FT Ultra. C) MS/MS spectra using CID or ECD of individually isolated H3.1 forms.
Figure 2.

Changes on H3.1 upon treatment with 1 μM 5-aza-dC. A) Broadband spectrum of (1-50) peptide of histone H3.1 from untreated HeLa cells. B) Broadband spectrum of H3.1 (1-50) after a 3 day treatment with 1 μM 5-aza-dC and C) Broadband spectrum of H3.1 (1-50) after a 5 day treatment with inhibitor 5-aza-dC (1 μM).
HeLa cells were then treated with the inhibitor 5-aza-dC for either three or five days. To avoid toxicity and apoptosis the concentration of the drug was kept at low levels (1 μM). H3.1 profiles from 5-aza-dC treatments indicate the protein has the same modification types as H3.1 from asynchronous cells, however the abundance of the modified forms changes substantially (Figure 2 A-C) upon treatment with the inhibitor. H3.1 from a three or five day treatment with 5-aza-dC shows a decrease in the amount of higher methylated/acetylated forms (6 to 12 methyl equivalents).The H3.1 MS profile of the treated cells shows a big shift towards the less methylated/acetylated forms of the protein, specifically the 5 methyl/acetyl, 4 methyl/acetyl and 3 methyl/acetyl forms. At the “profiling” level, we can conclude that inhibition of DNA methylation causes an increase in the relative abundance of H3.1 forms that are less methylated compared to asynchronous H3.1. Also, a comparison of the treatments for three or five days with the DNA methylating inhibitor 5-aza-dC indicates no significant changes between the two different time points.
Comparing profiles is helpful in indicating drastic changes in modification patterns, however the knowledge of site specific modification changes can only be obtained after MS/MS fragmentation. ECD or CID of all the forms present from either an asynchronous or treated sample reports on global changes including specific sites of modifications. Although all the forms of H3.1 1-50 are included during this type of “multiplexed” fragmentation (easy to implement), we are able to assess global PTM occupancies at specific sites for the differently treated samples semi-quantitatively. A comparison of ECD of all the forms present for untreated and treated samples indicates ratio changes for pairs of specific fragment ions. Histone H3.1 is a protein rich in lysine and arginine residues which are potential sites for methylation and acetylation. To get the precise localization of a modification it is necessary to use a fragmentation method that cleaves backbone bonds between each site of interest. Some of the MS/MS fragmentation methods involve ion activation via collisions into a neutral gas, while some others use electrons. The electron-based methods have the advantage of cleaving proteins and larger peptides at many more backbone positions than conventional MS/MS, allowing for better localization of modifications to specific sites. Both ECD and Electron Transfer Dissociation (ETD) retain any PTM that is stable during the original ionization process[26], while CID has been shown to be more harsh especially towards phosphorylation and glycosylation. Our data indicate that fragmentation efficiency for H3.1 was comparable for both methods ECD and CID. In addition, site specific information for PTM localization could be obtained by using either type of fragmentation. MS/MS fragmentation by ECD or CID was obtained for all the H3.1 forms together and as shown in Figure 3 A-C, a comparable number of fragment ions was generated, and each one of them informs on sites of modifications. The efficiency of MS/MS fragmentation by ECD or CID (same number of scans were collected) was not affected by the charge state that was selected (Supplementary Figure 1).
Figure 3.
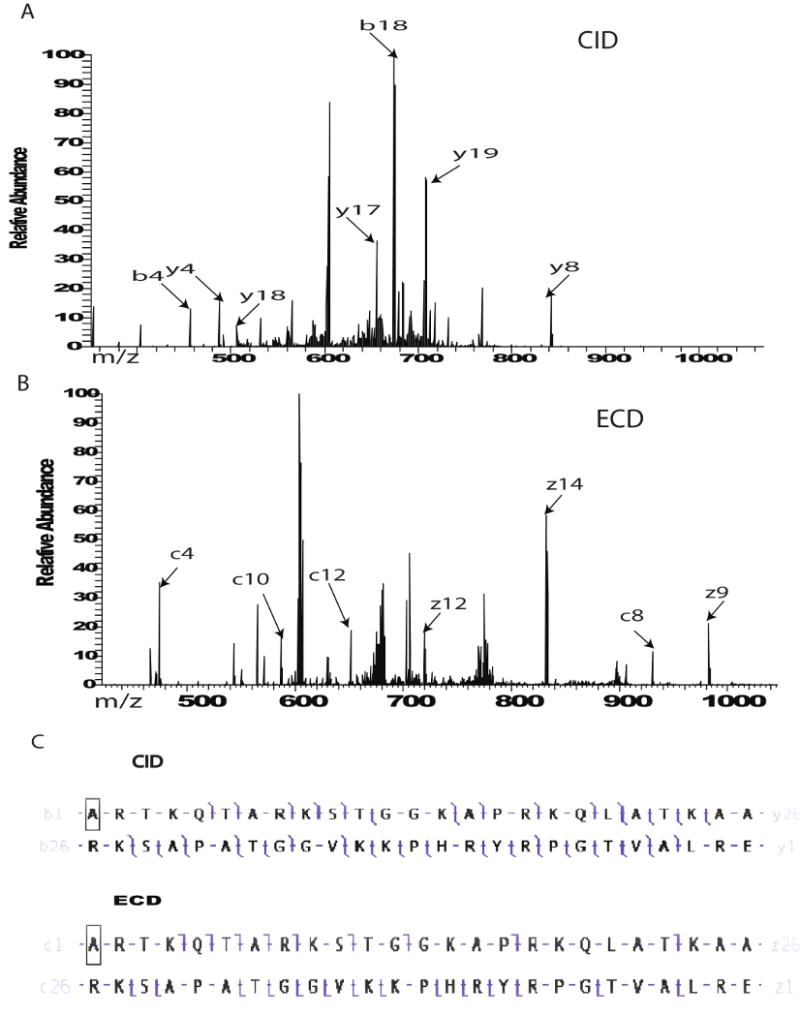
MS/MS fragmentation of all the forms present for H3.1 from untreated cells. A) ECD of all the forms of H3.1 after enhancement of the +7 charge state. B) CID of all the forms present in untreated H3.1 after enhancement of the +7 charge state. C) Comparison of fragmentation maps for ECD and CID of H3.1.
Acetylation and methylation were the two main modifications found in H3.1. It has been suggested that inhibition of DNA methylation results in increased acetylation levels on histones. As indicated in Figure 4A, H3.1 from untreated HeLa has both methylated and trimethylated Lys 9 as indicated by fragment ion c22 after fragmentation with ECD. Also, the presence of c22 + 28 Da fragment ion indicates dimethylation on Lys 9. The fragment ion c22 + 42 Da is a mixture of trimethylated and acetylated Lys 9 as indicated by the mixture of the isotopic distributions. The amount of dimethylation (c22 + 28 Da) decreases slightly after treatment with 5-aza-dC for three and five days while the amount of trimethylation (c22 + 42 Da) decreases more dramatically (Figure 4 B and C). Fragment ion c22 + 42 Da from the three and five day treatments is mainly acetylated Lys 9. This finding is in agreement with previous reports that histone acetylation increases after inhibition of DNA methylation.
Figure 4.

MS/MS (ECD) fragmentation of H3.1 (1-50). A) MS/MS from untreated H3.1 showing reporting fragment ions c10, c22 dimethyl and c22 trimethyl (acetyl). B) MS/MS of the same form of H3.1 from a three day treatment with 5-aza-dC showing reporting ions c10 and c22. C) MS/MS from a five day treatment with inhibitor 5-aza-dC.
Discussion
DNA methylation is an important event in the cell and it is controlled at many levels. Our MS analysis indicates that methylation of histone H3.1 is significantly reduced after inhibition of DNA methylation. Western blots against dimethylated or acetylated Lys 9 (Figure 5 A and B) confirm our finding that inhibition of DNA methylation leads to an increase in the relative acetylation levels. Dimethylation and trimethylation of Lys 9 on histone H3 is highly important for recruitment of HP1 and establishment of heterochromatin. In response to treatment for five days the amount of dimethylation seems to increase to similar levels as H3 from asynchronous cells. Lys 9 acetylation on the other hand seems to be more abundant in untreated HeLa, however the intensity of the modification decreases after a three day treatment with inhibitor and increases again after a five day treatment to approximately similar levels as asynchronous H3.1.
Figure 5.
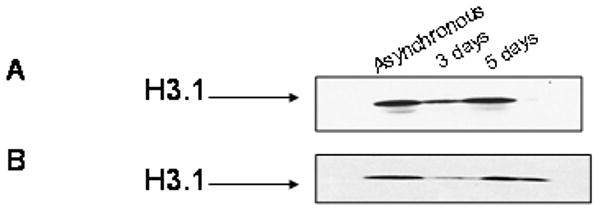
Western blot of H3.1 Lys 9 di-methylation vs acetylation. A) Western blot of acid extracted histones for acetylated Lys 9 H3.1 from asynchronous and 3 or 5 day 5-aza-dC treated HeLa cells B) Western blot of acid extracted histones for (di-me) Lys 9 H3.1 from untreated and 3 or 5 day 5-aza-dC treated HeLa cells.
5-aza-dC is a widely used inhibitor of DNA methylation and it has been previously reported that it can induce hyperacetylation of histones. Our data shows that inhibition of DNA methylation does indeed cause an increase in acetylation but at the same time it can lead to a decrease in methylation levels of histone H3. We have established a quick method using mass spectrometry to look at perturbations that inhibition of DNA methylation may cause on histone H3. Our approach allows a characterization of global methylation and acetylation patterns of important H3 sites and readily reports on key sites of interest such as Lys 4, Lys 9 and Lys 27 which are involved in epigenetics and cell development. Different histone H3 variants and PTMs have been shown to be involved in different cellular mechanisms. Our MS-based method for H3 analysis gives a precise characterization of this protein and is easily extensible to biological samples treated under different conditions. Analysis of histones by mass spectrometry, especially histone H3 can be quite challenging, due to the fact that H3 is very rich in lysine residues and it can be heavily methylated and acetylated. PTM site specific localization information can be lost if the sample is exstensively digested, so we believe that a more accurate view of the combinations of the modifications present can be achieved by our method as compared to previously published work[18; 27; 28]. Unlike western blots using antibodies and other mass spectrometry based methods, our technique provides a comprehensive analysis of histone H3 1-50 aa resulting from the global characterization of all the forms and PTMs present at a given time. Quantitative application of mass spectrometry can be achieved for histones with relative standard deviations in the <5% range, however, we forward our approach here as semi-quantitative. This “profiling mode” requires less number of replicates and can pick up large changes in relative abundance of different histone H3 forms that are >10-15%[19]. Another advantage of our method includes the relative ease of acquiring multiplexed MS/MS which is directly implemented using other MS instruments which can obtain isotopic resolution on fragment ions up to 5 kDa, such as Orbitraps and TOFs.
Supplementary Material
MS/MS fragmentation map for A) CID of all H3.1 forms for the +6 charge state and B) ECD of all H3.1 forms for the +6 charge state.
Acknowledgments
The laboratory of NLK was supported by the Packard Foundation, the Sloan Foundation, and the National Institutes of Health (GM 067193-07).
Footnotes
Publisher's Disclaimer: This is a PDF file of an unedited manuscript that has been accepted for publication. As a service to our customers we are providing this early version of the manuscript. The manuscript will undergo copyediting, typesetting, and review of the resulting proof before it is published in its final citable form. Please note that during the production process errors may be discovered which could affect the content, and all legal disclaimers that apply to the journal pertain.
References
- 1.Campbell NA, Reece JB. Biology, Benjamin Cummings. San Fransisco, CA: 2002. [Google Scholar]
- 2.Jenuwein T, Allis CD. Translating the histone code. Science. 2001;293:1074–1080. doi: 10.1126/science.1063127. [DOI] [PubMed] [Google Scholar]
- 3.Strahl BD, Allis CD. The language of covalent histone modifications. Nature. 2000;403:41–5. doi: 10.1038/47412. [DOI] [PubMed] [Google Scholar]
- 4.Cheung P, Allis CD, Sassone-Corsi P. Signaling to chromatin through histone modifications. Cell. 2000;103:263–71. doi: 10.1016/s0092-8674(00)00118-5. [DOI] [PubMed] [Google Scholar]
- 5.Strahl BD, Ohba R, Cook RG, Allis CD. Methylation of histone H3 at lysine 4 is highly conserved and correlates with transcriptionally active nuclei in Tetrahymena. Proc Natl Acad Sci U S A. 1999;96:14967–72. doi: 10.1073/pnas.96.26.14967. [DOI] [PMC free article] [PubMed] [Google Scholar]
- 6.Heard E, Rougeulle C, Arnaud D, Avner P, Allis CD, Spector DL. Methylation of histone H3 at Lys-9 is an early mark on the X chromosome during X inactivation. Cell. 2001;107:727–38. doi: 10.1016/s0092-8674(01)00598-0. [DOI] [PubMed] [Google Scholar]
- 7.Wysocka J, Swigut T, Milne TA, Dou Y, Zhang X, Burlingame AL, Roeder RG, Brivanlou AH, Allis CD. WDR5 associates with histone H3 methylated at K4 and is essential for H3 K4 methylation and vertebrate development. Cell. 2005;121:859–72. doi: 10.1016/j.cell.2005.03.036. [DOI] [PubMed] [Google Scholar]
- 8.Hendzel MJ, Wei Y, Mancini MA, Van Hooser A, Ranalli T, Brinkley BR, Bazett-Jones DP, Allis CD. Mitosis-specific phosphorylation of histone H3 initiates primarily within pericentromeric heterochromatin during G2 and spreads in an ordered fashion coincident with mitotic chromosome condensation. Chromosoma. 1997;106:348–60. doi: 10.1007/s004120050256. [DOI] [PubMed] [Google Scholar]
- 9.Van Hooser A, Goodrich DW, Allis CD, Brinkley BR, Mancini MA. Histone H3 phosphorylation is required for the initiation, but not maintenance, of mammalian chromosome condensation. J Cell Sci. 1998;111(Pt 23):3497–506. doi: 10.1242/jcs.111.23.3497. [DOI] [PubMed] [Google Scholar]
- 10.Salvador LM, Park Y, Cottom J, Maizels ET, Jones JC, Schillace RV, Carr DW, Cheung P, Allis CD, Jameson JL, Hunzicker-Dunn M. Follicle-stimulating hormone stimulates protein kinase A-mediated histone H3 phosphorylation and acetylation leading to select gene activation in ovarian granulosa cells. J Biol Chem. 2001;276:40146–55. doi: 10.1074/jbc.M106710200. [DOI] [PubMed] [Google Scholar]
- 11.Hake SB, Allis CD. Histone H3 variants and their potential role in indexing mammalian genomes: the “H3 barcode hypothesis”. Proc Natl Acad Sci U S A. 2006;103:6428–35. doi: 10.1073/pnas.0600803103. [DOI] [PMC free article] [PubMed] [Google Scholar]
- 12.Zeitlin SG, Barber CM, Allis CD, Sullivan KF. Differential regulation of CENP-A and histone H3 phosphorylation in G2/M. J Cell Sci. 2001;114:653–61. doi: 10.1242/jcs.114.4.653. [DOI] [PubMed] [Google Scholar]
- 13.Dillon N. Heterochromatin structure and function. Biol Cell. 2004;96:631–7. doi: 10.1016/j.biolcel.2004.06.003. [DOI] [PubMed] [Google Scholar]
- 14.Grewal SI, Jia S. Heterochromatin revisited. Nat Rev Genet. 2007;8:35–46. doi: 10.1038/nrg2008. [DOI] [PubMed] [Google Scholar]
- 15.Noma K, Allis CD, Grewal SI. Transitions in distinct histone H3 methylation patterns at the heterochromatin domain boundaries. Science. 2001;293:1150–5. doi: 10.1126/science.1064150. [DOI] [PubMed] [Google Scholar]
- 16.Nakayama J, Rice JC, Strahl BD, Allis CD, Grewal SI. Role of histone H3 lysine 9 methylation in epigenetic control of heterochromatin assembly. Science. 2001;292:110–3. doi: 10.1126/science.1060118. [DOI] [PubMed] [Google Scholar]
- 17.Turek-Plewa J, Jagodzinski PP. The role of mammalian DNA methyltransferases in the regulation of gene expression. Cell Mol Biol Lett. 2005;10:631–47. [PubMed] [Google Scholar]
- 18.Taverna SD, Ueberheide BM, Liu Y, Tackett AJ, Diaz RL, Shabanowitz J, Chait BT, Hunt DF, Allis CD. Long-distance combinatorial linkage between methylation and acetylation on histone H3 N termini. Proc Natl Acad Sci U S A. 2007;104:2086–2091. doi: 10.1073/pnas.0610993104. [DOI] [PMC free article] [PubMed] [Google Scholar]
- 19.Pesavento JJ, Mizzen CA, Kelleher NL. Quantitative analysis of modified proteins and their positional isomers by tandem mass spectrometry: Human histone H4. Anal Chem. 2006;78:4271–4280. doi: 10.1021/ac0600050. [DOI] [PubMed] [Google Scholar]
- 20.Garcia BA, Pesavento JJ, Mizzen CA, Kelleher NL. Pervasive combinatorial modification of histone H3 in human cells. Nat Methods. 2007;4:487–9. doi: 10.1038/nmeth1052. [DOI] [PubMed] [Google Scholar]
- 21.Lyko F, Ramsahoye BH, Kashevsky H, Tudor M, Mastrangelo MA, Orr-Weaver TL, Jaenisch R. Mammalian (cytosine-5) methyltransferases cause genomic DNA methylation and lethality in Drosophila. Nat Genet. 1999;23:363–6. doi: 10.1038/15551. [DOI] [PubMed] [Google Scholar]
- 22.Klose RJ, Bird AP. Genomic DNA methylation: the mark and its mediators. Trends Biochem Sci. 2006;31:89–97. doi: 10.1016/j.tibs.2005.12.008. [DOI] [PubMed] [Google Scholar]
- 23.Lopatina N, Haskell JF, Andrews LG, Poole JC, Saldanha S, Tollefsbol T. Differential maintenance and de novo methylating activity by three DNA methyltransferases in aging and immortalized fibroblasts. J Cell Biochem. 2002;84:324–34. doi: 10.1002/jcb.10015. [DOI] [PubMed] [Google Scholar]
- 24.Robert MF, Morin S, Beaulieu N, Gauthier F, Chute IC, Barsalou A, MacLeod AR. DNMT1 is required to maintain CpG methylation and aberrant gene silencing in human cancer cells. Nat Genet. 2003;33:61–5. doi: 10.1038/ng1068. [DOI] [PubMed] [Google Scholar]
- 25.Oka M, Meacham AM, Hamazaki T, Rodic N, Chang LJ, Terada N. De novo DNA methyltransferases Dnmt3a and Dnmt3b primarily mediate the cytotoxic effect of 5-aza-2′-deoxycytidine. Oncogene. 2005;24:3091–9. doi: 10.1038/sj.onc.1208540. [DOI] [PubMed] [Google Scholar]
- 26.Siuti N, Kelleher NL. Decoding protein modifications using top-down mass spectrometry. Nat Methods. 2007;4:817–21. doi: 10.1038/nmeth1097. [DOI] [PMC free article] [PubMed] [Google Scholar]
- 27.Garcia BA, Barber CM, Hake SB, Ptak C, Turner FB, Busby SA, Shabanowitz J, Moran RG, Allis CD, Hunt DF. Modifications of human histone H3 variants during mitosis. Biochemistry. 2005;44:13202–13. doi: 10.1021/bi050906n. [DOI] [PubMed] [Google Scholar]
- 28.Thomas CE, Kelleher NL, Mizzen CA. Mass spectrometric characterization of human histone H3: a bird's eye view. J Proteome Res. 2006;5:240–7. doi: 10.1021/pr050266a. [DOI] [PubMed] [Google Scholar]
Associated Data
This section collects any data citations, data availability statements, or supplementary materials included in this article.
Supplementary Materials
MS/MS fragmentation map for A) CID of all H3.1 forms for the +6 charge state and B) ECD of all H3.1 forms for the +6 charge state.