Abstract
This work describes improved workup and instrumental conditions to enable robust, sensitive glycosaminoglycan disaccharide analysis from complex biological samples. In the process of applying capillary electrophoresis with laser-induced fluorescence to glycosaminoglycan (GAG) disaccharide analysis in biological samples, we have made improvements to existing methods. These include (1) optimization of reductive amination conditions, (2) improvement in sensitivity through the use of a cellulose cleanup procedure for the derivatization and, (3) optimization of separation conditions for robustness and reproducibility. The improved method enables analysis of disaccharide quantities as low as 1 pmol prior to derivatization. Biological GAG samples were exhaustively digested using lyase enzymes, the disaccharide products and standards were derivatized with the fluorophore 2-aminoacridone and subjected to reversed polarity CE-LIF detection. These conditions resolved all known chondroitin sulfate disaccharides or eleven of twelve standard heparin/HS disaccharides, using 50 mM phosphate buffer, pH 3.5, and reversed polarity at 30 kV with 0.3 psi pressure. Relative standard deviation in migration times of CS ranged from 0.1% to 2.0% over 60 days, and the relative standard deviations of peak areas were less than 3.2%, suggesting that the method is reproducible and precise. The CS disaccharide compositions are similar to those obtained by our group using tandem mass spectrometry. The reversed polarity CE-LIF disaccharide analysis protocol yields baseline resolution and quantification of heparin/HS and CS/DS disaccharides from both standard preparations and biologically relevant proteoglycan samples. The improved CE-LIF method enables disaccharide quantification of biologically relevant proteoglycans from small samples of intact tissue.
Keywords: capillary electrophoresis, glycosaminoglycan, proteoglycan, connective tissue
1. Introduction
Sulfated glycosaminoglycans (GAGs), including heparin, heparan sulfate (HS), chondroitin sulfate (CS) and dermatan sulfate (DS), are structurally diverse linear polysaccharides that display a variety of important biological roles. Heparin and HS have been implicated in cell-signaling processes, cell adhesion, and regulation of enzymatic catalysis [1]. Heparin is widely used as an anticoagulant drug [2, 3], and it has been shown to regulate cellular process by binding to, and acting as, a co-receptor for various growth factors [4–6]. HS is located primarily at cell-surface membranes and in the extracellular matrix (ECM) in virtually all animal tissues, and is involved in cell-cell interaction [6–11]. CS/DS is also commonly found in the ECM [12, 13] where it plays structural roles and may mediate cell-cell interaction and communication [14–19].
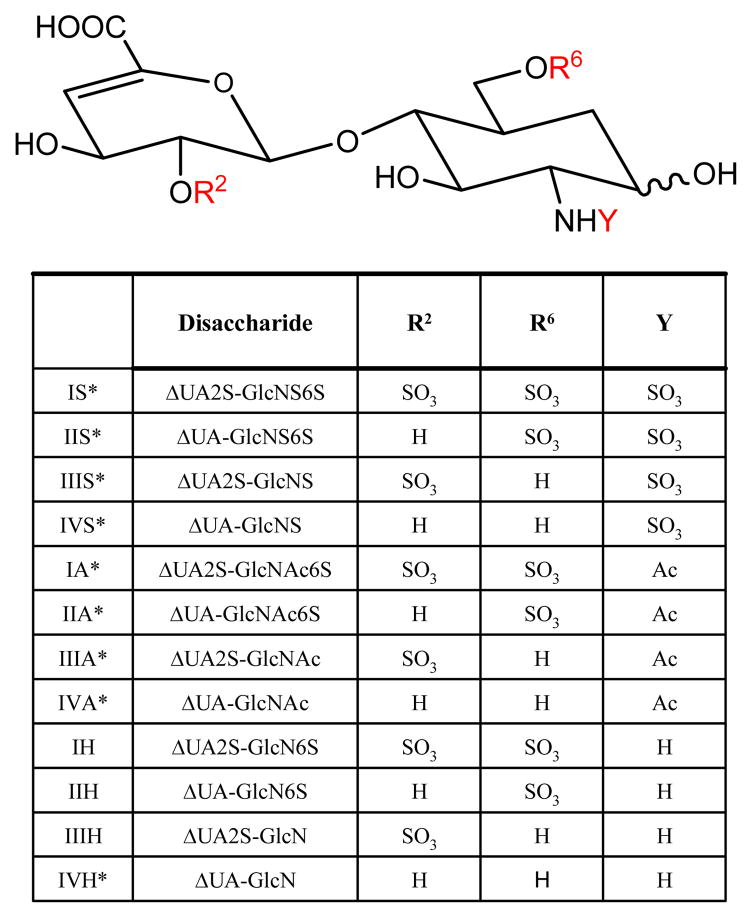
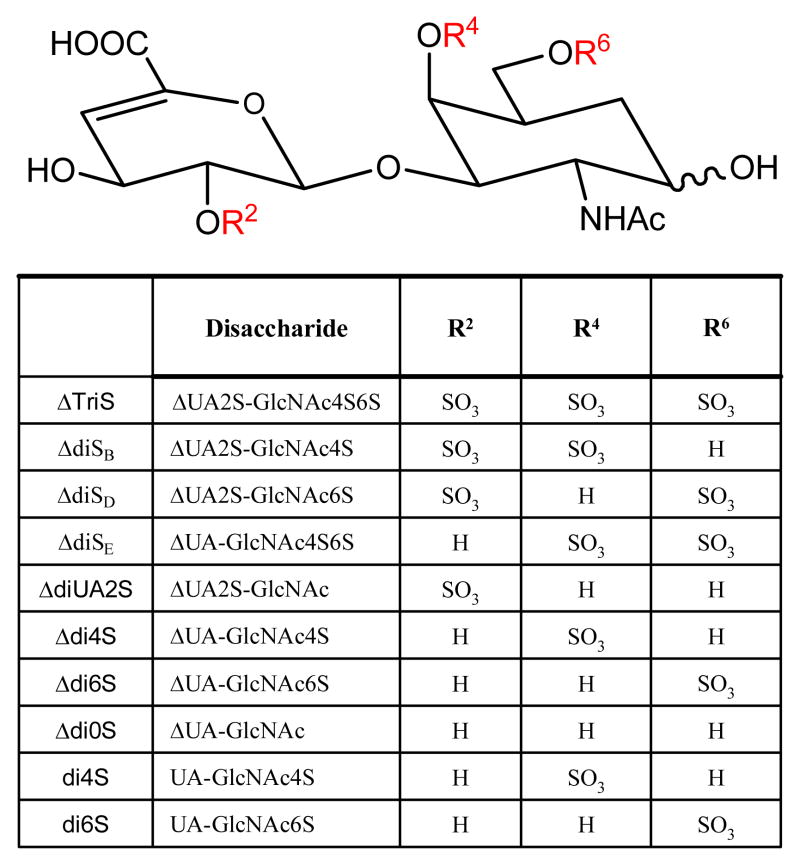
Heparin, HS, and CS/DS are composed of repeating disaccharide units that consist of a hexosamine and a uronic acid. For heparin/HS the uronic acid may be either glucuronic acid (GlcA) or iduronic acid (IdoA), the hexosamine may be either N-acetylated (GlcNAc), N-sulfated (GlcNS), or unsubstituted (GlcNH), and the disaccharide units may be sulfated at any available hydroxyl group. Twenty-three different heparin/HS disaccharide units have been detected in biological samples [20]. Heparin/HS chains may be depolymerized using polysaccharide lyases, by which the GlcA and IdoA residues are converted to 4,5-unsaturated (Δ-unsaturated) HexA, therefore the number of commercially available disaccharides is lowered to twelve, shown in Figure 1. Disaccharide units containing 3-O-sulfated GlcN residues resist lyase cleavage [21], and this leads to the existence of nine biologically relevant heparin/HS disaccharides (I-IVA, I-IVS and IVH) [21, 22]. The remaining three commercially available disaccharides (I-IIIH) have been isolated from chemically modified heparin [21]. The I-IVA and I-IVS sets are the most abundant Δ-disaccharides, and their quantification is an essential first step for GAG and proteoglycan analysis. CS/DS is made up of alternating uronic acid and N-acetylgalactosamine (GalNAc) residues and can be sulfated at either the 4- and/or 6-position of the GalNAc, and/or the 2-position of the uronic acid. Eight CS Δ-disaccharides and two saturated CS disaccharides, shown in Figure 2, are commercially available.
Figure 1.
The structures of twelve commercially available structural variants of heparin/HS disaccharides. The general structure is shown accompanied by a table describing the composition differences among disaccharides, where R2, R6 and Y are substituents that vary among the different disaccharides. Biologically relevant heparin/HS disaccharides are indicated by a (*).
Figure 2.
The structures of ten different CS/DS disaccharides that exist in nature. CS/DS is made up of alternating uronic acid and N-acetylgalactosamine residues and can be sulfated at the 4- or 6-position of GalNAc and/or the 2-position of uronic acid. The general structure is shown accompanied by a table describing the composition differences among disaccharides, where R2, R4 and R6 are substituents that vary among the different disaccharides.
The various structural characteristics of GAGs, including sulfation position and domain organization, are responsible for their myriad interactions with protein partners in normal development and pathological situations [23, 24]. Therefore, disaccharide compositional analysis is a necessary first step towards developing GAG structure-function relationships. Disaccharide analysis of GAGs has been studied using reversed phase ion pairing (RP-IP) and anion exchange HPLC [25, 26], RP-IP HPLC and strong anion exchange (SAX) HPLC with post-column fluorometric detection with 2-cyanoacetamide [27, 28], fluorophore-assisted carbohydrate electrophoresis (FACE) [29, 30], poly (methyl methacrylate) chips using poly(vinyl alcohol) [31, 32], DNA sequencer-assisted GAG disaccharide separation [33], and electrospray ionization mass spectrometry [34, 35]. RP-IP HPLC methods require 2 nmol of pure, standard disaccharide starting material for detection [26]; while electrospray mass spectrometry [34] and FACE [29] methods both require 100 pmol GAG disaccharide starting material. Reductive amination is limited by the quantity of starting disaccharide which may be recovered from the derivatization reaction. Post-column derivatization with cyanoacetamide is extremely sensitive but entails a complex setup for post-column reaction, cooling, and detection.
Capillary electrophoresis (CE) has several advantages over other analytical methods for GAG disaccharide analysis, including high resolving power, high separation efficiency, automated and reproducible analysis, flexibility in separation order depending on the polarity, short analysis time, and low consumption of both sample and buffers [36, 37]. Biological samples are often present in quantities containing only a few micrograms of GAG; therefore, a robust tool such as CE, which can detect picomole (pmol) amounts of sample has potential for widespread use for GAG analysis. In practice, problems with sample workup and reproducibility have limited use of CE for GAG disaccharide analysis [37–40].
Oligosaccharides and disaccharides derived from polysaccharide lyase digestion of GAGs are amenable to CE separations due to their acidic, negatively charged nature. CE enables the resolution of disaccharide structural isomers, differing in sulfation position. This process can be operated in the forward polarity mode with UV detection [41, 42], forward polarity mode with online MS detection [43], reversed polarity with UV detection [44, 45], or reversed polarity with LIF detection [46, 47]. In the forward polarity mode, GAG samples are separated using uncoated fused silica capillaries and a basic buffer system, causing the inner surface of the capillary to be negatively charged. The basic buffer system then carries analytes toward the cathode by virtue of the electroosmotic flow (EOF). The least acidic GAG samples migrate fastest using this mode of CE. In reversed polarity mode, the electroosmotic flow is minimized using an acidic buffer system (pH =3.50), causing only analytes such as GAGs, that retain a negative charge to migrate toward the detector. GAG disaccharides migrate past the detector in order of decreasing acidity, generally reflected by the number of sulfate groups.
Sulfated GAG disaccharides produced by exhaustive lyase digestion can be detected by CE using the unique absorbance at 232 nm created by the Δ-unsaturated bond in the non-reducing hexuronic acid residue [45]. This chromophore has an extinction coefficient of approximately 6000 M−1 cm−1 [48]. However, the addition of a fluorophore via reductive amination greatly increases the sensitivity and reduces the detection limits for CE of GAGs. A number of labeling reagents have been employed for use with CE, including 8-amino-naphthalene-1,3,6-trisulfonic acid (ANTS) [49], 1-phenyl-3-methyl-5-pyrazolone (PMP) [50], 2-aminobenzamide (2-AB) [51], 2-aminopyridine (2-AP) [52], 8-aminopyrene-1,3,6-trisulfonic acid (APTS) [53], and 2-aminoacridone (AMAC) [54]. Depending on the chemical properties of the derivative, it can be detected by using UV, fluorescence, and/or laser-induced fluorescence (LIF). Carbohydrates derivatized with APTS (λex = 455 nm, λem = 512 nm [53]) and AMAC (λex = 425, λem = 530 [55]) have fluorescence properties compatible with standard argon ion laser LIF systems.
State of the art CE-LIF methods have been developed for the structural analysis of GAGs using the AMAC fluorophore [46, 47]. Using reversed polarity, Militsopoulou et al. were able to resolve HS disaccharide standards in a single run at pH 3.5 with sensitivities ten times greater than those previously achieved with UV detection [47]. CS/DS disaccharide standards labelled with AMAC were previously resolved by Lamari et al. using CE-LIF with a 15 mM orthophosphate buffer, pH 3.0. The sensitivity obtained by CE-LIF was shown to be 10 times higher than those obtained by UV detection [46]. Application to GAG disaccharide analysis from complex biological samples has not been demonstrated.
CE has the potential benefit for robust application to GAG disaccharide analysis, but has not been widely used in the field. In practice, problems with recovery of disaccharides after the derivatization reaction have limited its application. Existing methods analyze AMAC-derivatized GAG disaccharides without workup. Presented here is a workup procedure that eliminates noise background and improves the limit of quantification of biological samples 100-fold. Optimized derivatization and separation conditions are presented that enable robust and reproducible disaccharide analysis of heparin/HS and CS/DS GAGs from proteoglycan and tissue samples. The disaccharide analysis method presented herein is shown to be robust, reproducible, and to perform well in the analysis of complex proteoglycan and intact tissue samples.
2. Materials and Methods
Materials
CS disaccharide standards: ΔTriS (ΔHexA2Sβ1-3GalNAc4S6S), ΔdiSd (ΔHexA2Sβ1-3GalNAc6S), ΔdiSb (ΔHexA2Sβ1-3GalNAc4S), ΔdiSe (ΔHexAβ1-3GalNAc4S6S), ΔdiUA2S (ΔHexA2Sβ1-3GalNAc), Δdi4S (ΔHexAβ1-3GalNAc4S), Δdi6S (ΔHexAβ1-3GalNAc6S), di4s (HexAβ1-3GalNAc4S), di6S (HexAβ1-3GalNAc6S) and Δdi0S (HexAβ1-3GalNAc), were purchased from V-Labs, Inc. (Covington, LA). Heparin/HS disaccharide standards: IS (ΔHexA2Sβ1-4GlcNS6S), IIS (ΔHexAβ1-4GlcNS6S), IIIS (ΔHexA2Sβ1-4GlcNS), IVS (ΔHexAβ1-4GlcNS), IA (ΔHexA2Sβ1-4GlcNAc6S), IIIA (ΔHexA2Sβ1-4GlcNAc), IVA (ΔHexAβ1-4GlcNAc), IH (ΔHexA2Sβ1-4GlcN6S), IIH (ΔHexAβ1-4GlcN6S), IIIH (ΔHexA2Sβ1-4GlcN), and IVH (ΔHexAβ1-4GlcN), were purchased from Sigma Aldrich Chemicals Co. (St. Louis, Mo). HS disaccharide IIA (ΔHexAβ1-4GlcNAc6S) was purchased from V-Labs (Covington, LA). CS type A (4GlcAβ1-3GalNAc4Sβ1-), CSB (4IdoAα1-3GalNac4Sβ1-), CSC (4GlcAβ1-3GalNAc6Sβ1-), and chondroitinase ABC, B and AC1 were obtained from Seikagaku America/Associates of Cape Cod (Falmouth, MA). Heparin Lyases I, II, III were obtained from IBEX technologies, Inc. (Montreal, Quebec). AMAC was purchased from Fluka Chemika (Buchs, Switzerland), bovine kidney heparan sulfate, sodium cyanoborohydride and sodium borohydride were from Aldrich Chemicals Co. (St. Louis, MO), cellulose, amino, cyano and silica packing material Micro Spin Columns were purchased from Harvard Apparatus (Holliston, MA). Diol spin columns were purchased from Alltech Associates, Inc. (Deerfield, IL). DS-18 and DS-36 samples were generous gifts of A. Malmström (Lund University, Lund, Sweden). Crude bovine cartilage extract was from Aldrich Chemicals Co. (St. Louis, MO).
Extraction of chondroitin sulfate/dermatan sulfate from cartilage tissue
Bovine cartilage was removed from shoulder joints of young calves under aseptic conditions [56] by Dr. Karen Yates at Brigham and Woman’s Hospital Harvard Medical School. Human cartilage was obtained under an Institutional Review Board-approved protocol for discarded tissue (total knee arthroscopy for osteoarthritis). Sulfated GAGs were extracted from cartilage tissue samples as described previously [15]. Briefly, GAGs were released from the core protein in papain-digested cartilage tissue samples with a 1.0 M NaBH4, 0.05 M NaOH solution at 45 °C for 16 h. Hydrophobic biomolecules were removed from released cartilage samples via Pepclean C18 spin columns. The sample was dissolved in 50-μL of water and precipitated in 9 volumes of chilled ethanol. Cationic biomolecules were removed from the GAG pellet via strong anion exchange ultra micro spin columns. Cationic biomolecules were washed off with three 100-μL volumes of 50 mM sodium phosphate pH 3.5. The GAG mixture was then eluted with two 100-μL volumes of 1M NaCl, dried in vacuo and precipitated in 9 volumes of chilled ethanol.
Polysaccharide lyase depolymerization of chondroitin sulfate
CS/DS samples (1 μg) were mixed with water (86.5 μL), Tris-HCl buffer (5 μL, 1M, pH 7.4), ammonium acetate (0.5 μL, 1M) and three chondroitin lyase enzymes: chondroitinase ABC (3 μL, 4 mU/μL), chondroitinase AC1 (3 μL, 2 mU/μL), and chondroitinase B (2 μL, 0.5 mU/μL) digested for two hours at 37 °C, and boiled for one minute. This resulted in complete digestion of the CS samples due to the excess of enzyme used and the extended duration of digestion. Disaccharide products were then derivatized with AMAC for CE-LIF analysis, (see below).
Polysaccharide lyase depolymerization of heparin/heparin sulfate (HS)
Bovine kidney heparan sulfate (1 μg) was mixed with 100 μL of 100 mM NaCl, 20 mM tris, 1 mM calcium acetate and lyases I (1.2 mU), II (1.2 mU), and III (1.2 mU), incubated at 37 °C overnight, and lyophilized to dryness. This resulted in complete digestion of the HS samples due to the excess of enzyme used and the extended duration of digestion. Disaccharide products were then derivatized with AMAC for CE-LIF analysis, (see below).
Optimized Derivatization of Disaccharides with 2-Aminoacridone
The AMAC procedure described by Militsopoulou [47] was optimized to increase derivatization yield. Briefly, 1 mg AMAC was dissolved in 99 μL MeOH and 1 μL NH4OH and dried in 12.5 μL aliquots (0.125 mg AMAC/aliquot). MeOH (10 μL) was added to dried AMAC aliquots. Disaccharides were dissolved in water (10 μL) to which was added AMAC solution (10 μL). The solution was incubated at 45°C for 10 min., and dried. A 5 μL quantity of AcOH: DMSO (3:17) was added, followed by the addition of 5 μL of 1 M NaBH3CN in water. The mixture was vortexed for 3 minutes and incubated at 45 °C for 4 h, after which 10 μL of DMSO were added. A detailed protocol is given in the supporting information.. Excess reagent was removed using cellulose spin columns, (see below).
Derivatization Sample Clean-Up
Excess reductive amination reagents were removed using cellulose micro-spin columns. The cellulose column was first hydrated with five 200-μL volumes of water, rinsed with five 200-μL volumes of 30% acetic acid solution, and then with three 200-μL volumes of acetonitrile. The AMAC derivatized reaction mixture was applied to the column allowing 10 min for it to adsorb to the cellulose. Excess reagents were washed off with three 200-μL volumes of acetonitrile followed by two 200-μL volumes of 96% acetonitrile. The derivatized glycan was then eluted with two 100-μL volumes of water and dried. Diol, amino, cyano and silica micro-spin columns were subjected to the same protocol as that of cellulose. A detailed protocol is given in the supporting information.
Capillary Electrophoresis with Laser-Induced Fluorescence Detection
AMAC derivatized CS/DS or HS disaccharides were analyzed using a Beckman Coulter (Fullerton, CA) P/ACE MDQ capillary electrophoresis instrument. The following program was used to wash uncoated fused silica capillary tubing (50 μm ID, 360 μm OD, 60 cm total length) between electrophoretic runs: 20 psi with 0.1 M HCl (3 min), 0.1M NaOH (7 min), and HPLC grade water (4 min). These steps were necessary to achieve reproducible results. Separations were performed using 50mM NaH2PO4 buffer, pH 3.5, at 30 kV, using reversed polarity and detected using the AMAC fluorophore. Resolution of the GAG disaccharide isomers and good reproducibility were obtained when fresh anode and cathode buffer solutions (1 mL) were used for each run. A tri-sulfated heparin disaccharide (ΔHSIS) was used as the internal standard for each CS/DS run as it has a unique migration time compared to the CS/DS disaccharides, and GlcNAc-6S was used as the HS internal standard. A detailed list of CE-LIF reagents and conditions is given in the supporting information.
3. Results
Optimization of AMAC derivatization
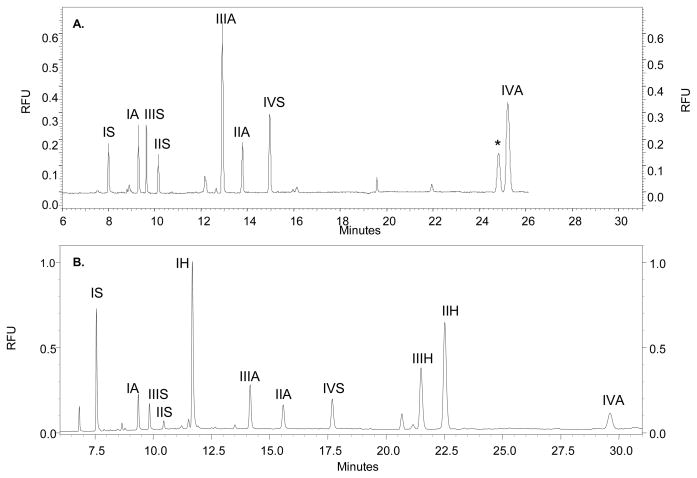
AMAC is a neutral fluorescent molecule [54] that has been used to analyze CS/DS and heparin/HS disaccharides by CE [46, 47, 57]. The original AMAC derivatization protocol, adapted from Militsopoulou et al. [47], reductively aminates all 10 CS/DS disaccharides, and 8 of the 12 heparin/HS disaccharides. HS disaccharides I-IVS and I-IVA (Figure 1) contain GlcNAc and GlcNS, respectively, and are derivatized using the original protocol. However, HS disaccharides I-IVH have an unsubstituted GlcN amine group, and recovery of derivatized disaccharides is poor. In an attempt to improve detection of I-IVH, reaction conditions were investigated to allow for formation of the imine between AMAC and the disaccharide prior to reduction. The solvent in which the AMAC reagent and the disaccharide were dissolved was changed to MeOH, and GAG disaccharides were brought up in water. The AMAC reagent was added to the GAG disaccharide and incubated to allow the formation of the imine. The sample was then lyophilized, brought up in AcOH:DMSO (3:17), and the reducing agent added. The electropherogram of 12 heparin/HS disaccharides subjected to the original AMAC derivatization is shown in Figure 3a. Disaccharides I-IVA and I-IVS are detected, and disaccharides I-IVH are absent. Following derivatization using the optimized AMAC method, 11 of the 12 heparin/HS disaccharides are present, shown in Figure 3b. The IVH disaccharide is still absent, possibly due to the fact that it is a zwitterion and the amine may be protonated, causing its failure to migrate through the charged capillary. The reaction conditions used in the optimized derivatization protocol yield a more efficient and complete labeling procedure for GAG disaccharides; therefore, all GAG disaccharides analyzed herein were derivatized using the optimized AMAC protocol.
Figure 3.
A. CE-LIF electropherogram in reverse polarity mode of a mixture of 12 heparin/HS disaccharides (300 pmol each) subjected to the original AMAC derivatization protocol. Disaccharide peaks are labeled using the nomenclature from Figure 1. 8 of the 12 heparin/HS disaccharides are detected. The (*) represents a background noise peak. B. CE-LIF electropherogram in reverse polarity mode of a mixture of 12 heparin/HS disaccharides (300 pmol each) subjected to the optimized AMAC derivatization protocol. Disaccharide peaks are labeled using the nomenclature from Figure 1. 11 of the 12 heparin/HS disaccharides are detected.
Optimization of sample clean-up procedure
GAG disaccharides are reductively aminated in the presence of excess AMAC labeling reagent to ensure complete derivatization. Following reductive amination, carbohydrate purification steps are necessary to remove the excess AMAC reagent prior to CE-LIF analysis to increase both the sensitivity of detection and the signal-to-noise ratio. Purification of reductively aminated glycan samples has previously been achieved through gravity filtration using GlycoClean S Cartridges [58] and paper chromatography performed with Whatman 3MM paper [59]. Neither technique sufficed to recover disaccharides below 100 pmol prior to derivatization. Micro centrifuge cartridges may be packed with various resins that are potentially useful for glycan cleanup, and allow preparation times of less than one hour for multiple samples. Use of such cartridges provides rapid removal of excess reductive amination reagents based on hydrophilic interactions. Triplicate CE-LIF data were acquired on reductive amination reactions of Δdi4S at the 1, 10, 100, and 1000 pmol scales with and without cellulose cleanup. Following purification with cellulose micro-spin columns, the signal-to-noise ratio increased by a factor of 2.1 ± 0.3 for 100 pmol concentrations to a factor of 3.8 ± 0.5 for 1 pmol concentrations, with the average increase in signal to noise ratio for cleaned samples equaling 3.1.
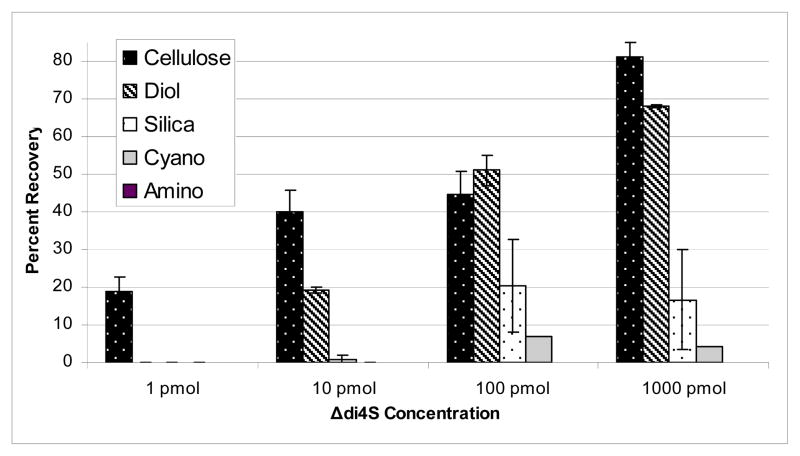
Five HILIC resins were tested for their recovery rate of GAG disaccharides including cellulose, diol, amino, silica and cyano. Triplicate samples of 1 pmol, 10 pmol, 100 pmol, and 1000 pmol concentrations of CS disaccharide standard Δdi4S (ΔHexAβ1-3GalNAc4S) were subjected to the optimized AMAC derivatization. Following derivatization, each Δdi4S-AMAC sample was cleaned by the different micro-spin column materials under identical conditions. Each column was hydrated with water, activated with acetic acid solution and equilibrated with acetonitrile. The Δdi4S-AMAC (1, 10, 100, 1000 pmol) reductive amination reactions were loaded onto the column in high organic solvent (acetonitrile), and excess AMAC was removed by washing with acetonitrile, followed by elution of the Δdi4S-AMAC with water. To quantitate the percent recovery of Δdi4S-AMAC from each micro-spin column, known quantities of Δdi4S-AMAC (1, 10, 100, 1000 pmol) were subjected to reversed polarity CE-LIF analysis. Cartridge cleaned (1, 10, 100, and 1000 pmol) Δdi4S-AMAC samples were then subjected to reversed polarity CE-LIF analysis, and the percent recovery of Δdi4S-AMAC calculated by dividing the peak area by that of the quantified Δdi4S-AMAC standards and multiplying by 100. Triplicate analysis of 1, 10, 100 and 1000 pmol Δdi4S-AMAC showed that the cellulose micro-spin column allowed recovery of the smallest quantity of Δdi4S, as shown in Figure 4. Cellulose micro-spin columns enabled recovery of Δdi4S from a reductive amination reaction of 1 pmol. All other micro-spin column materials failed to recover Δdi4S-AMAC from a 1 pmol reaction. Cellulose, diol and silica columns were able to recover 10 pmol of material, with cellulose recovering the greatest percentage, 40.1%. A 100 and 1000 pmol level cellulose, diol, silica and cyano were able to recover various ranges of Δdi4S-AMAC, while amino columns did not yield any recovery of disaccharides. In almost all cases, cellulose recovered the highest percentage of disaccharide; and as the concentration of disaccharide increased, the percentage of recovery increased from 19.0% for 1 pmol to 81.2% for 1000 pmol. Despite recovery of only 19% for 1 pmol, the signal-to-noise ratio increased by approximately a factor of 4 because the cellulose cleanup procedure removed all background contaminants. All reductive amination samples herein were thus cleaned via cellulose micro-spin columns.
Figure 4.
Bar graph representation of the percent recovery of Δdi4S-AMAC after clean-up with micro-spin cellulose, diol, silica, cyano and amino columns. The percent recovery was calculated by dividing the percentage of the clean sample by that of the non-clean sample and multiplying by 100. The highest recovery rate was found when using cellulose micro-spin columns.
Separation methods for standard CS/DS disaccharides
A robust and reproducible separation method that is capable of resolving all 10 CS/DS disaccharides is crucial for disaccharide analysis of unknown biological samples. Several different parameters must be taken into account when creating a robust method including, polarity, capillary inner diameter, buffer pH, voltage, time, and pressure. Reversed polarity is used in this study because highly sulfated molecules such as GAGs will migrate based on their tri-, di-, or mono-sulfated or acetylated groups. A 50 mM sodium phosphate buffer, pH 3.5, was chosen for this work, as it has previously been suggested for AMAC derivatized GAG disaccharides [47]. At this pH, the silanol residues on the capillary wall are protonated, minimizing the electroosmotic flow, allowing the GAG disaccharides to migrate through the column based on charge density.
Inner diameter and voltage can play crucial roles in the lifetime of a CE capillary. Both 50-micron and 75-micron inner diameter capillaries will adequately separate CS/DS disaccharides; however a 75-micron capillary was found to have shortened lifetime due to higher current, temperature and reduced wall thickness. A 50-micron capillary used at 30 kV minimizes current, therefore increasing the lifetime of the column, and reducing corrosion of the instrument electrodes.
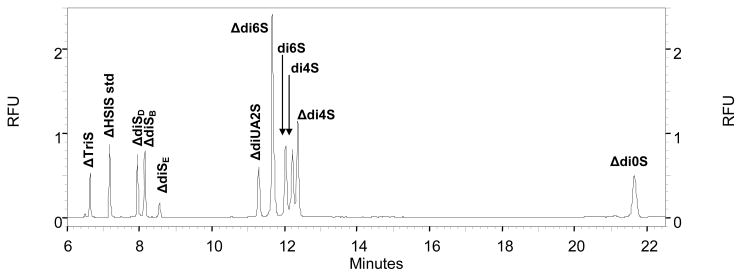
A 50-micron capillary column, run in reversed polarity mode using 50 mM sodium phosphate, pH 3.5 at a voltage of 30 kV, will separate nine of the 10 CS/DS disaccharides. The least acidic disaccharide, Δdi0S, migrates slowly relative to the sulfated disaccharides. In order to reduce analysis time, a pressure step was added to push Δdi0S through the capillary past the detector. The nine sulfated CS/DS disaccharides eluted within the first 14 minutes at 30 kV, after which a 0.3 psi pressure step was added to the method. A mixture of all ten CS/DS disaccharides labeled with AMAC and cleaned via cellulose micro-spin columns was created, spiked with ΔHSIS internal standard, and subjected to reverse polarity CE-LIF, with the addition of pressure. This method resulted in the resolution of ten CS disaccharide peaks, shown in Figure 5. Disaccharides with the greatest number of sulfate groups migrate fastest. The Δ-TriS (ΔHexA2Sβ1-3GalNAc4S6S) is a triply sulfated disaccharide that elutes first amongst CS/DS disaccharides at 7 min. The ΔdiSd (ΔHexA2Sβ1-3GalNAc4S), ΔdiSe (ΔHexAβ1-3GalNAc4S6S) and ΔdiSb (ΔHexA2Sβ1-3GalNAc6S) have two sulfates each and elute next between 8 and 9 min. The ΔdiUA2S (ΔHexA2Sβ1-3GalNAc), Δdi4S (ΔHexAβ1-3GalNAc4S), Δdi6S (ΔHexAβ1-3GalNAc6S), di4S (HexAβ1-3GalNAc4S) and di6S (HexAβ1-3GalNAc6S) have one sulfate each and elute between 11 and 13 min. The Δdi0S (ΔHexAβ1-3GalNAc) lacks any sulfate group and therefore elutes last amongst the CS/DS disaccharides at 22 min. Migration times were assigned using purified disaccharide standards.
Figure 5.
Reverse polarity CE-LIF electropherogram of a mixture of ten AMAC labeled CS/DS disaccharides and one internal standard (ΔHSIS). Eleven peaks are present and represent the separation and detection of all 10 CS/DS species and the internal standard. All disaccharides are labeled on their individual peaks using the nomenclature from Figure 2.
Reproducibility of the method
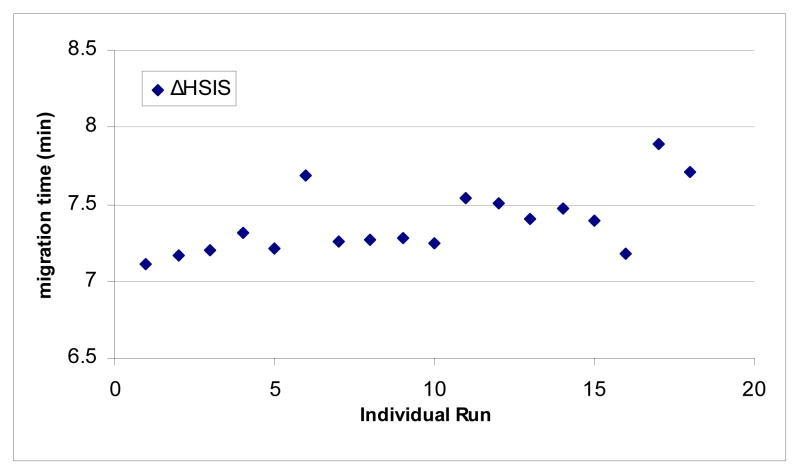
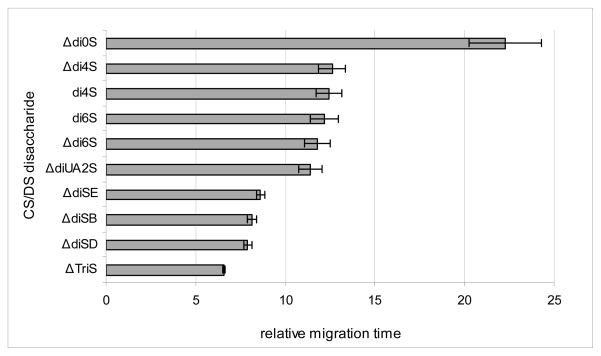
Eighteen repeated injections over 60 days of the ΔHSIS triply sulfated internal standard gave migration times with a 0.2% standard deviation, with times ranging between 7.108 min and 7.888 min (Figure 6). The minimal change in migration time demonstrates that this method has excellent reproducibility. For mixture variability purposes, the ten CS/DS disaccharides were mixed together with the ΔHSIS internal standard and run in triplicate. The relative migration times, shown in Figure 7, have standard deviations ranging between 0.1% and 2.0%. The CS/DS disaccharide mixtures were tested for stability by derivatizing and storing at −20°C for 12 months. CE-LIF analysis of these samples over the 12 month period showed that no change in composition of the mixture was observed, and the relative standard deviations of the peak areas were found to be less than 3.2%.
Figure 6.
Scatter plot representation of the reproducibility in the CE-LIF migration time of the ΔHSIS internal standard over an extended duration of time. Migration times ranged from 7.108 minutes to 7.888 minutes.
Figure 7.
Bar graph representation of the CE-LIF relative migration times of the average of eighteen repeated injections of the ten CS/DS disaccharide standards (300 pmol) over 60 days. All migration times were normalized to the migration time of the ΔHSIS internal standard spiked into every CE-LIF run. All relative migration times had standard deviations of less than 2.0 percent.
Limits of detection for biologically relevant proteoglycan samples
The applicability and the limits of detection of the CE-LIF method to the analysis of biological samples was examined following the in-depth analysis of CS/DS disaccharide standards. CS standards and biological samples (1 μg) were digested with chondroitinases ABC, AC1 and B in a combination that ensures exhaustive depolymerization of the oligosaccharide chains to disaccharides. Standard CSA, CSB, and CSC were then diluted with DMSO and subjected to CE-LIF in reversed polarity mode in quantities ranging from 0.01 μg to 0.5 μg. CSA disaccharide peaks Δdi4S and Δdi6S were detected with sufficient signal for quantification at a total disaccharide concentration as low as 0.01 μg. Quantities lower than 0.01 μg resulted in loss of detection of the Δdi6S component within the sample. Quantification of five different quantities of exhaustively digested CSA resulted in disaccharide compositions within 1.9% of one another, with an average composition of 94.89% ± 0.7 Δdi4S and 5.11% ± 0.6 Δdi6S. A complete list of results is detailed in Table I.
Table I.
CE-LIF limits of detection for CS/DS disaccharide standards and biological CS/DS tissue samples. DS represents bovine skin dermatan sulfate, JB represents juvenile bovine.
| Quantity of GAG (μg) | ΔHexAGalNAc4S | ΔHexAGalNAc6S | ΔHexAGalNAc | ΔHexA2SGalNAc4S | |
|---|---|---|---|---|---|
| Chondroitin Sulfate A | 0.01 | 95.10 ± 0.6 | 4.9 ± 0.5 | 0 ± 0.0 | 0 ± 0.0 |
| 0.05 | 93.88 ± 0.8 | 6.12 ± 0.8 | 0 ± 0.0 | 0 ± 0.0 | |
| 0.1 | 95.75 ± 0.9 | 4.28 ± 0.9 | 0 ± 0.0 | 0 ± 0.0 | |
| 0.5 | 95.00 ± 0.2 | 4.99 ± 0.2 | 0 ± 0.0 | 0 ± 0.0 | |
| Bovine Cartilage Extract | 0.01 | 31.50 ± 0.9 | 68.5 ± 1.0 | 0 ± 0.0 | 0 ± 0.0 |
| 0.05 | 29.00 ± 1.8 | 71.00 ± 1.9 | 0 ± 0.0 | 0 ± 0.0 | |
| 0.1 | 30.73 ± 2.2 | 69.27 ± 2.2 | 0 ± 0.0 | 0 ± 0.0 | |
| 0.5 | 31.85 ± 0.7 | 68.15 ± 0.7 | 0 ± 0.0 | 0 ± 0.0 | |
| DS – 18 | 0.5 | 95.16 ± 3.3 | 3.56 ± 3.0 | 0 ± 0.0 | 1.28 ± 0.44 |
| DS – 36 | 0.5 | 91.76 ± 0.3 | 1.51 ± 0.4 | 0 ± 0.0 | 6.73 ± 0.1 |
| JB Cartilage | 0.5 | 57.5 ± 2.0 | 39.1 ± 2.4 | 3.4 ± 0.8 | 0 ± 0.0 |
The results showing that the lyase digestions of DS preparations are predominately composed of Δdi4S are consistent with those obtained by our group using tandem mass spectrometry [15, 60, 61]. This in contrast to results obtained by Karamanos et al using amine hydrophilic interaction chromatography with detection at 232 nm in which disulfated Δ-disaccharides compose approximately 25% of the digest composition [62]. Similar results were obtained by the same group using capillary electrophoresis of underivatized Δ-disaccharides [44]. It is likely that the CE-LIF and tandem MS methods used by our group and the chromatographic and CE-UV methods used by Karamanos et al accurately determine disaccharide compositions existing in solution; differences are likely to result from a combination of the GAG preparations and the enzymatic digestion conditions used. In the present work, we have used a combination of chondroitinases ABC, ACI and B to digest GAG samples. Karamanos et al used chondroitinases ABC and B for DS samples [62].
Application of analysis to biological samples
Various other biological samples were tested for the CE-LIF detections limits including crude cartilage extract [61], intact juvenile bovine cartilage [15], and bovine skin dermatan sulfate, DS-18 and DS-36, which were purified from skin, and the associated numeral refers to the percent ethanol at which the chains precipitated [61, 63–65]. All samples were processed using an optimized streamlined GAG extraction procedure [15]. Crude cartilage extract (0.01 μg GAG concentration) was detected with a signal-to-noise ratio great enough to afford quantification, demonstrating the reproducibility of CE-LIF analysis for the detection of as low as 0.01 μg of digested and derivatized biological sample. Samples from biological sources including bovine skin dermatan sulfate, and intact juvenile bovine cartilage, which require prior purification steps, were found to have CE-LIF detection limits of 0.5 μg GAG in the starting extract [15], shown in Table I.
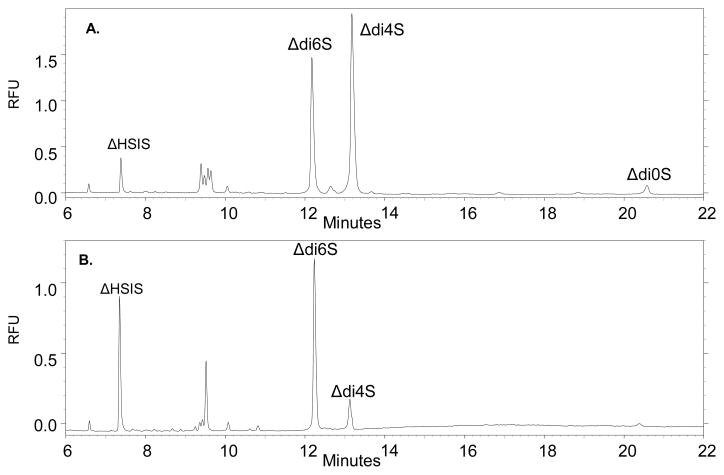
Disaccharide analysis of intact juvenile bovine and adult human cartilage samples (0.5 μg starting material) was achieved by exhaustive depolymerization of the whole polymer chain using combined chondroitinase ABC, chondroitinase AC1 and chondroitinase B digestion, followed by fluorescent derivatization using AMAC and CE-LIF analysis of the disaccharide compositions. Representative electropherograms for juvenile bovine cartilage explant 1 (JB-A1) and adult human donor A explant 1 (H-A1) are shown in Figure 8a and b, respectively. Migration times of Δ-disaccharides generated from cartilage extracted CS GAGs were verified against those of AMAC-derivatized commercially purified-disaccharide standards. An AMAC-derivatized tri-sulfated disaccharide derived from heparin (ΔHSIS), was used as the internal standard, as it has a unique migration time compared to the CS disaccharide. The Δ-disaccharide compositions were calculated using the CE fluorescence peak areas, normalized to the area of the internal standard. JB-A1 is shown to contain 57.5% ± 2.0 ΔHexAβ3GalNAc4S (Δdi4S), 39.1% ± 2.4 ΔHexAβ3GalNAc6S (Δdi6S) and 3.4% ± 0.8 ΔHexAβ3GalNAc (Δdi0S), while H-A1 contains 14.9% ± 0.8 Δdi4S and 85.1% ± 0.8 Δdi6S.
Figure 8.
A. CE-LIF electropherogram of juvenile bovine cartilage donor A explant 1 (0.5 μg) reductively aminated with AMAC. B. CE-LIF electropherogram of adult human cartilage donor A explant 1 (0.5 μg) reductively aminated with AMAC. ΔHSIS represents the internal standard spiked into each sample for quantification purposes. Δdi4S represents the percentage of ΔHexAGalNAc4S, Δdi6S represents the percentage of ΔHexAGalNAc6S, and Δdi0S represents the percentage of ΔHexAGalNAc. Small peaks present at approximately 9.5 minutes are minor contaminants present in all samples, including negative controls.
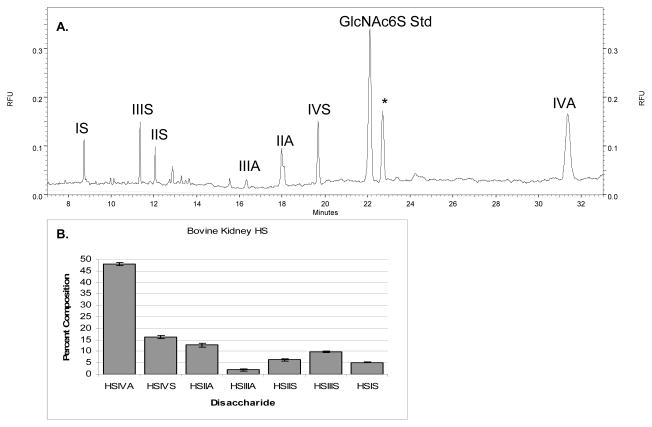
In addition to biologically relevant CS samples, a bovine kidney heparan sulfate sample was investigated. HS (1 μg starting material) was exhaustively digested, AMAC labeled, and cellulose cleaned. The HS disaccharide sample (0.05 μg) was analyzed by CE-LIF using the reverse polarity separation method detailed herein. CE-LIF analysis, shown by the representative electropherogram in Figure 9a, resulted in identification of seven biologically relevant disaccharides, IVA, IVS, IIIA, IIA, IIS, IIIS, and IS, the percentages of which are shown in Figure 9b. The existence of only seven HS disaccharides in bovine kidney HS is consistent with previous literature reports [66].
Figure 9.
A. CE-LIF electropherogram in reverse polarity mode of bovine kidney HS (0.05 μg) subjected to exhaustive depolymerization, optimized AMAC derivatization and cellulose cleanup. Disaccharide peaks are labeled using the nomenclature from Figure 6.1. Seven heparin/HS disaccharides are detected. The (*) represents an unidentified peak deriving from the bovine HS sample. B. Bar graph representation of the CE-LIF disaccharide analysis of bovine kidney HS. Seven HS disaccharide compositions are identified, including HS IVA, IVS, IIA, IIIA, IIS, IIIS, and IS, and the resulting percentage of each disaccharide is calculated.
4. Discussion
This contribution describes optimization of CE-LIF for analysis of GAG Δ-disaccharides from complex biological samples. GAG disaccharides were successfully labeled, cleaned, recovered and analyzed by CE-LIF at starting concentrations as low as 1 pmol. Biologically relevant GAG-derived disaccharides were successfully analyzed at concentrations as low as 0.01 μg, therefore showing that the workup and CE-LIF methods are applicable to concentrations present in mammalian tissue. Intact tissue samples are often only available in quantities containing 5 to 10 μg GAG. In addition, they often require purification steps prior to analysis. The optimized derivatization and cleanup procedures in tandem with CE-LIF is sensitive enough to enable triplicate disaccharide analysis while consuming only five to ten percent of the tissue sample. This is advantageous in that CE-LIF provides absolute quantification of the GAG disaccharides and their compositions.
Cleanup of the AMAC derivatization improves sensitivity several fold. Excess label, if not removed, decreases the signal to noise ratio. The crucial factor when working with biological samples at low concentrations is sample recovery. Several micro-spin column materials were tested for sample recovery including: cellulose, diol, silica, cyano and amino. Diol and cellulose materials produced the highest rate of recovery. The hydroxyl groups in both materials will create hydrogen bonding networks that are most likely to bind with hydrophilic GAG disaccharides. Cellulose, however, is the only material capable of recovering 1 pmol of CS disaccharide with a high enough recovery percentage to be detected by CE-LIF.
The CE-LIF protocol described herein is a fast and reproducible method for the disaccharide analysis of CS/DS and heparin/HS GAG samples. The method is applicable to both pure standards and disaccharides derived from polysaccharide lyase depolymerization of biological extracts.
Acknowledgments
Funding resources from NIH grants P41 RR10888, and R01 HL74197 are gratefully acknowledged.
Abbreviations
- AMAC
2-aminoacridone
- CS
chondroitin sulfate
- CE-LIF
capillary electrophoresis laser-induced fluorescence
- DS
dermatan sulfate
- ECM
extracellular matrix
- GAG
glycosaminoglycan
- HILIC
hydrophilic interaction chromatography
- HS
heparan sulfate
- LC-MS/MS
liquid chromatography-tandem mass spectrometry
- OA
osteoarthritis
- PG
proteoglycan
- RP-IP
reversed phase ion pairing
- SAX
strong anion exchange
- Δ-unsaturation
delta-unsaturation
Appendix Glycosaminoglycan disaccharide analysis protocol
A. 2-aminoacridone (AMAC) derivatization procedure1
Reagents
AMAC: dissolve AMAC in methanol, 0.1% NH4OH, and aliquot 5×10⁻⁷ mol per tube in Eppendorf plastic tubes, then dry, and store at −20 °C in the dark.
Acetic acid (AcOH)
Dimethylsulfoxide (DMSO)
Sodium cyanoborohydride, 1M in water, freshly made
AMAC reaction
Mix 1 mg AMAC, 99 μL MeOH, 1 μL NH4OH
Aliquot mixture into 8 Eppendorf tubes (0.125 mg AMAC tube, 12.5 μL)
Lyophilize tubes, store at −20° C for later use, or use immediately
To the dried AMAC aliquots add 10 μL 100% MeOH
To the dried glycan sample add 10 μL H20
Add the AMAC aliquot to the glycan sample and heat at 45°C for 10 minutes
Lyophilize the glycan sample
Add 5 μL 3:17 AcOH:DMSO and 5 μL of 1M NaBH3CN (freshly made in water)2
Vortex
Spin the liquid to the bottom of the tube
Incubate at 45°C for 4 hr in the dark
Dilute with 10 μL DMSO for clean up purposes
B. Microspin Cellulose Cleanup Procedure3
*Note: Use Harvard Apparatus Cellulose Microspin or Ultra-Microspin columns
Reagents
Water
30% acetic acid (3:7 AcOH:H20)
Acetonitrile
96% Acetonitrile
Cellulose Microspin Column, Harvard Apparatus (Part # 74-4801)
Procedure
Use brief (30 sec) spins at 3000 rpm on a tabletop microcentrifuge.
Hydrate the spin column with 200 μL water for 10 min. (spin partially through and let the water absorb on the column)
Wash with 3 × 200 μL water –(to waste)
Wash with 4 × 200 μL 30% acetic acid –(to waste)
Wash with 4 × 200 μL acetonitrile –(to waste)
Apply GAG sample (immediately after applying ACN). Spin sample through column at slower rpm (~2000 rpm).
Collect GAG sample from bottom of Eppendorf tube and re-pipet GAG sample onto column, spin sample through column at slower rpm (~2000 rpm).
Collect GAG sample from bottom of Eppendorf tube and re-pipet onto the column, leaving it for 10 min to fully absorb to the column.
Wash with 3 × 200 μL acetonitrile4 (to waste)
Wash with 2 × 200 μL 96% acetonitrile (to waste)
Elute with 2 × 100 μL water. Collect the eluant in a smaller eppendorf tube (0.5 mL) placed inside the larger Eppendorf tube (1.5mL).
Dry down sample using a centrifugal evaporator.
C. Reversed Polarity Capillary Electrophoresis – Laser Induce Fluorescence reagents
*Disaccharides should first be reductively aminated using AMAC
Reagents
Conditioning/Regenerating/LIF Performance/Forward Polarity Buffers
0.1 N NaOH
1 N HCl
HPLC grade H20
100 % MeOH
Reverse Polarity Solutions
0.1 N NaOH (regenerator solution)
1 N HCl
HPLC grade H20
50 mM Na2HPO4, pH 3.5 (make a large batch, aliquot 1 mL into individual Eppendorf tubess, freeze at −20°C until used)
Note that a fresh aliquot of both inlet and outlet buffer is required for each individual reverse polarity run).
CE conditions are described in the methods section of the associated publication.
Footnotes
Militsopoulou, M., Lamari, F. N., Hjerpe, A., and Karamanos, N. K. Determination of twelve heparin- and heparan sulfate-derived disaccharides as 2-aminoacridone derivatives by capillary zone electrophoresis using ultraviolet and laser-induced fluorescence detection (2002) Electrophoresis 23, 1104–9.
Destroy the left over NaBH3CN by adding acetic acid
It is possible to run reversed polarity CE directly without workup. In our experience, however, it is necessary to derivatize a minimum of 100 pmol of glycan to detect by CE without the workup. Removing the excess AMAC reagent allows derivatization of 1 pmol glycan and subsequent CE LIF detection.
Most of the yellow color should wash through. Some color will remain on the top part of the cellulose packing.
References
- 1.Militsopoulou M, Lecomte C, Bayle C, Couderc F, Karamanos NK. Biomed Chromatogr. 2003;17:39–41. doi: 10.1002/bmc.207. [DOI] [PubMed] [Google Scholar]
- 2.Linhardt RJ. Chemistry & Industry. 1991;2:45–50. [Google Scholar]
- 3.Linhardt RJ, Gunay NS. Semin Thromb Hemost. 1999;25(Suppl 3):5–16. [PubMed] [Google Scholar]
- 4.Linhardt RJ, Turnbull JE, Wang HM, Loganathan D, Gallagher JT. Biochemistry. 1990;29:2611–2617. doi: 10.1021/bi00462a026. [DOI] [PubMed] [Google Scholar]
- 5.Selva EM, Perrimon N. Adv Cancer Res. 2001;83:67–80. doi: 10.1016/s0065-230x(01)83003-7. [DOI] [PubMed] [Google Scholar]
- 6.Perrimon N, Bernfield M. Nature. 2000;404:725–728. doi: 10.1038/35008000. [DOI] [PubMed] [Google Scholar]
- 7.Rosenberg RD, Shworak NW, Liu J, Schwartz JJ, Zhang L. J Clin Invest. 1997;99:2062–2070. doi: 10.1172/JCI119377. [DOI] [PMC free article] [PubMed] [Google Scholar]
- 8.David G, Bernfield M. Matrix Biol. 1998;17:461–463. doi: 10.1016/s0945-053x(98)90092-0. [DOI] [PubMed] [Google Scholar]
- 9.Kraemer PM. Biochemistry. 1971;10:1445–1451. doi: 10.1021/bi00784a027. [DOI] [PubMed] [Google Scholar]
- 10.Kraemer PM. Biochemistry. 1971;10:1437–1445. doi: 10.1021/bi00784a026. [DOI] [PubMed] [Google Scholar]
- 11.Lindahl U, Kusche-Gullberg M, Kjellen L. J Biol Chem. 1998;273:24979–24982. doi: 10.1074/jbc.273.39.24979. [DOI] [PubMed] [Google Scholar]
- 12.Bernfield M, Gotte M, Park PW, Reizes O, et al. Annu Rev Biochem. 1999;68:729–777. doi: 10.1146/annurev.biochem.68.1.729. [DOI] [PubMed] [Google Scholar]
- 13.Iozzo RV. Annu Rev Biochem. 1998;67:609–652. doi: 10.1146/annurev.biochem.67.1.609. [DOI] [PubMed] [Google Scholar]
- 14.Hardingham TE, Fosang AJ. Faseb J. 1992;6:861–870. [PubMed] [Google Scholar]
- 15.Hitchcock AM, Yates KE, Shortkroff S, Costello CE, Zaia J. Glycobiology. 2006;17:25–35. doi: 10.1093/glycob/cwl046. [DOI] [PMC free article] [PubMed] [Google Scholar]
- 16.Kawashima H, Hirose M, Hirose J, Nagakubo D, et al. J Biol Chem. 2000;275:35448–35456. doi: 10.1074/jbc.M003387200. [DOI] [PubMed] [Google Scholar]
- 17.Lander AD. Matrix Biol. 1998;17:465–472. doi: 10.1016/s0945-053x(98)90093-2. [DOI] [PubMed] [Google Scholar]
- 18.Trowbridge JM, Rudisill JA, Ron D, Gallo RL. J Biol Chem. 2002;277:42815–42820. doi: 10.1074/jbc.M204959200. [DOI] [PubMed] [Google Scholar]
- 19.Varki A, Cummings R, Esko J, Freeze H, et al. Essentials of Glycobiology. Cold Spring Harbor Laboratory Press; Cold Spring Harbor, NY: 1999. [PubMed] [Google Scholar]
- 20.Esko JD, Selleck SB. Annu Rev Biochem. 2002;71:435–471. doi: 10.1146/annurev.biochem.71.110601.135458. [DOI] [PubMed] [Google Scholar]
- 21.Yamada S, Sugahara K. Trends in Glycoscience and Glycotechnology. 1998;10:95–123. [Google Scholar]
- 22.van den Born J, Gunnarsson K, Bakker MA, Kjellen L, et al. J Biol Chem. 1995;270:31303–31309. doi: 10.1074/jbc.270.52.31303. [DOI] [PubMed] [Google Scholar]
- 23.Netelenbos T, Drager AM, van het Hof B, Kessler FL, et al. Exp Hematol. 2001;29:884–893. doi: 10.1016/s0301-472x(01)00653-1. [DOI] [PubMed] [Google Scholar]
- 24.Theocharis AD, Tsolakis I, Tsegenidis T, Karamanos NK. Atherosclerosis. 1999;145:359–368. doi: 10.1016/s0021-9150(99)00117-3. [DOI] [PubMed] [Google Scholar]
- 25.Imanari T, Toida T, Koshiishi I, Toyoda H. J Chromatogr A. 1996;720:275–293. doi: 10.1016/0021-9673(95)00338-x. [DOI] [PubMed] [Google Scholar]
- 26.Karamanos NK, Vanky P, Tzanakakis GN, Tsegenidis T, Hjerpe A. J Chromatogr A. 1997;765:169–179. doi: 10.1016/s0021-9673(96)00930-2. [DOI] [PubMed] [Google Scholar]
- 27.Toyoda H, Yamamoto H, Ogino N, Toida T, Imanari T. Journal of Chromatography A. 1999;830:197–201. [Google Scholar]
- 28.Volpi N, Maccari F. Clin Chim Acta. 2005;356:125–133. doi: 10.1016/j.cccn.2005.01.016. [DOI] [PubMed] [Google Scholar]
- 29.Calabro A, Benavides M, Tammi M, Hascall VC, Midura RJ. Glycobiology. 2000;10:273–281. doi: 10.1093/glycob/10.3.273. [DOI] [PubMed] [Google Scholar]
- 30.Calabro A, Hascall VC, Midura RJ. Glycobiology. 2000;10:283–293. doi: 10.1093/glycob/10.3.283. [DOI] [PubMed] [Google Scholar]
- 31.Zhang Y, Ping G, Kaji N, Tokeshi M, Baba Y. Electrophoresis. 2007;28:3308–3314. doi: 10.1002/elps.200700088. [DOI] [PubMed] [Google Scholar]
- 32.Zhang Y, Ping G, Zhu B, Kaji N, et al. Electrophoresis. 2007;28:414–421. doi: 10.1002/elps.200600339. [DOI] [PubMed] [Google Scholar]
- 33.Vogel K, Kuhn J, Kleesiek K, Gotting C. Electrophoresis. 2006;27:1363–1367. doi: 10.1002/elps.200500578. [DOI] [PubMed] [Google Scholar]
- 34.Desaire H, Leary J. J Am Soc Mass Spectrom. 2000;11:916–920. doi: 10.1016/S1044-0305(00)00168-9. [DOI] [PubMed] [Google Scholar]
- 35.Behr JR, Matsumoto Y, White FM, Sasisekharan R. Rapid Commun Mass Spectrom. 2005;19:2553–2562. doi: 10.1002/rcm.2079. [DOI] [PubMed] [Google Scholar]
- 36.Novotny MV, Sudor J. Electrophoresis. 1993;14:373–389. doi: 10.1002/elps.1150140163. [DOI] [PubMed] [Google Scholar]
- 37.Linhardt RJ, Pervin A. J Chromatogr A. 1996;720:323–335. doi: 10.1016/0021-9673(95)00265-0. [DOI] [PubMed] [Google Scholar]
- 38.Zamfir A, Peter-Katalinic J. Electrophoresis. 2004;25:1949–1963. doi: 10.1002/elps.200405825. [DOI] [PubMed] [Google Scholar]
- 39.al-Hakim A, Linhardt RJ. Anal Biochem. 1991;195:68–73. doi: 10.1016/0003-2697(91)90296-6. [DOI] [PubMed] [Google Scholar]
- 40.Mao WJ, Thanawiroon C, Linhardt RJ. Biomed Chromatogr. 2002;16:77–94. doi: 10.1002/bmc.153. [DOI] [PubMed] [Google Scholar]
- 41.Ampofo SA, Wang HM, Linhardt RJ. Anal Biochem. 1991;199:249–255. doi: 10.1016/0003-2697(91)90098-e. [DOI] [PubMed] [Google Scholar]
- 42.Carney SL, Osborne DJ. Anal Biochem. 1991;195:132–140. doi: 10.1016/0003-2697(91)90308-g. [DOI] [PubMed] [Google Scholar]
- 43.Zamfir A, Seidler DG, Schonherr E, Kresse H, Peter-Katalinic J. Electrophoresis. 2004;25:2010–2016. doi: 10.1002/elps.200405925. [DOI] [PubMed] [Google Scholar]
- 44.Karamanos NK, Axelsson S, Vanky P, Tzanakakis GN, Hjerpe A. J Chromatogr A. 1995;696:295–305. doi: 10.1016/0021-9673(94)01294-o. [DOI] [PubMed] [Google Scholar]
- 45.Pervin A, al-Hakim A, Linhardt RJ. Anal Biochem. 1994;221:182–188. doi: 10.1006/abio.1994.1395. [DOI] [PubMed] [Google Scholar]
- 46.Lamari F, Theocharis A, Hjerpe A, Karamanos NK. J Chromatogr B Biomed Sci Appl. 1999;730:129–133. doi: 10.1016/s0378-4347(99)00184-x. [DOI] [PubMed] [Google Scholar]
- 47.Militsopoulou M, Lamari FN, Hjerpe A, Karamanos NK. Electrophoresis. 2002;23:1104–1109. doi: 10.1002/1522-2683(200204)23:7/8<1104::AID-ELPS1104>3.0.CO;2-1. [DOI] [PubMed] [Google Scholar]
- 48.Kariya Y, Yoshida K, Morikawa K, Tawada A, et al. Comp Biochem Physiol [B] 1992;103:473–479. doi: 10.1016/0305-0491(92)90323-j. [DOI] [PubMed] [Google Scholar]
- 49.Stefansson M, Novotny M. Anal Chem. 1994;66:3466–3471. doi: 10.1021/ac00092a026. [DOI] [PubMed] [Google Scholar]
- 50.Honda S, Ueno T, Kakehi K. J Chromatogr. 1992;608:289–295. doi: 10.1016/0021-9673(92)87135-u. [DOI] [PubMed] [Google Scholar]
- 51.Kinoshita A, Sugahara K. Anal Biochem. 1999;269:367–378. doi: 10.1006/abio.1999.4027. [DOI] [PubMed] [Google Scholar]
- 52.Gabius HJ, Kohnke-Godt B, Leichsenring M, Bardosi A. J Histochem Cytochem. 1991;39:1249–1256. doi: 10.1177/39.9.1918943. [DOI] [PubMed] [Google Scholar]
- 53.Evangelista RA, Liu MS, Chen FTA. Anal Chem. 1995;67:2239–2245. [Google Scholar]
- 54.Jackson P. Anal Biochem. 1991;196:238–244. doi: 10.1016/0003-2697(91)90460-b. [DOI] [PubMed] [Google Scholar]
- 55.Hill EK, de Mello AJ, Birrell H, Charlwood J, Camilleri P. Journal of the Chemical Society-Perkin Transactions. 1998;2:2337–2341. [Google Scholar]
- 56.Yates KE, Allemann F, Glowacki J. Cell Tissue Bank. 2005;6:45–54. doi: 10.1007/s10561-005-5810-0. [DOI] [PMC free article] [PubMed] [Google Scholar]
- 57.Kitagawa H, Kinoshita A, Sugahara K. Anal Biochem. 1995;232:114–121. doi: 10.1006/abio.1995.9952. [DOI] [PubMed] [Google Scholar]
- 58.Hardy MR. Techniques in Glycobiology. Dekker, Inc; New York: 1997. [Google Scholar]
- 59.Harvey DJ. J Am Soc Mass Spectrom. 2000;11:900–915. doi: 10.1016/S1044-0305(00)00156-2. [DOI] [PubMed] [Google Scholar]
- 60.Miller MJC, Costello CE, Malmström A, Zaia J. Glycobiology. 2006;16:502–513. doi: 10.1093/glycob/cwj093. [DOI] [PMC free article] [PubMed] [Google Scholar]
- 61.Hitchcock AM, Costello CE, Zaia J. Biochemistry. 2006;45:2350–2361. doi: 10.1021/bi052100t. [DOI] [PMC free article] [PubMed] [Google Scholar]
- 62.Karamanos NK, Syrokou A, Vanky P, Nurminen M, Hjerpe A. Anal Biochem. 1994;221:189–199. doi: 10.1006/abio.1994.1396. [DOI] [PubMed] [Google Scholar]
- 63.Davidson E, Hoffman P, Linker A, Meyer K. Biochim Biophys Acta. 1956;21:506–518. doi: 10.1016/0006-3002(56)90188-3. [DOI] [PubMed] [Google Scholar]
- 64.Fransson LA, Roden L. J Biol Chem. 1967;242:4161–4169. [PubMed] [Google Scholar]
- 65.Fransson LA, Roden L. J Biol Chem. 1967;242:4170–4175. [PubMed] [Google Scholar]
- 66.Maccarana M, Sakura Y, Tawada A, Yoshida K, Lindahl U. J Biol Chem. 1996;271:17804–17810. doi: 10.1074/jbc.271.30.17804. [DOI] [PubMed] [Google Scholar]


