

Abstract
Parasol ganglion cells of the magnocellular (MC) pathway form the physiological substrate of a luminance channel underlying photometric tasks, but they also respond weakly to red-green chromatic modulation. This may take the form of a first-harmonic (1F) response to chromatic modulation at low temporal frequencies, and/or a second-harmonic (2F) response that is more marked at higher frequencies. It is shown here that both these responses originate from a receptive field component that is intermediate in size between center and surround, i.e., a discrete, chromatic receptive field is superimposed upon an achromatic center-surround structure. Its size is similar to the receptive field (center plus surround) of midget, parvocellular cells from the same retinal eccentricity. A 2F MC cell chromatic response component is shown to be present under cone silent substitution conditions, when only the middle- (M) or long-wavelength (L) cone is modulated. This and other features suggest it is a rectified response to a chromatic signal rather than a consequence of non-linear summation of M- and L-cone signals. A scheme is presented which could give rise to such responses. It is suggested that this chromatic input to MC cells can enhance motion signals to red-green borders close to equiluminance.
Keywords: color vision, ganglion cells, magnocellular/parvocellular, receptive fields, spatial vision
Introduction
There is strong evidence that the magnocellular (MC) pathway provides the physiological substrate of a psychophysical luminance channel responsible for performance on photometric tasks (Kaiser, Lee, Martin, & Valberg, 1990; Lee, Martin, & Valberg, 1988). However, MC cells may also give a response to red-green chromatic modulation. This was first described for chromatic edges and consists of an excitatory response to equiluminant borders, independent of the direction of chromatic contrast (Kaiser et al., 1990; Schiller & Colby, 1983). It is also present with sinusoidal chromatic modulation. To a grating or a uniform field sinusoidally modulated along the equiluminant red-green axis, MC cells give a frequency-doubled (2F) response (Lee, Martin, & Valberg, 1989b). As temporal frequency (or edge speed) increases, the sizes of the luminance response and the 2F response to chromatic modulation increase in parallel until ∼20 Hz, above which the 2F chromatic response falls off (Lee, Pokorny, Smith, Martin, & Valberg, 1990). An account of the 2F response based on temporal factors alone (for example, receptive field components with different latencies) thus cannot hold. The size of the 2F chromatic response is directly related to the difference signal between the long- (L) and middle-wavelength (M) sensitive cones (|M – L|), and thus the response is absent to stimuli lying along a tritanopic confusion line.
MC cells also display a 1st harmonic (1F) |M – L| response at low temporal frequencies. This was first noted by Wiesel and Hubel (1966), who reported that a proportion of MC cells were inhibited if their receptive fields were ‘flooded with red light’. It was later found necessary to postulate a first-harmonic |M – L| response to account for MC cells responses as the relative phase of red (638 nm) and green (554 nm) lights was varied (Smith, Lee, Pokorny, Martin, & Valberg, 1992). A luminance mechanism would be expected to give a minimum response when the 638 and 554 nm equiluminant lights are modulated out-of-phase with each other at ±180° (|M – L| modulation), but the phase of minimum response is shifted to the ‘red-leads-green’ quadrant. This shift could only be modeled by assuming an additional 1F, |M – L| cone opponent input to MC cells. We will refer to this result as the phase shift effect.
The |M – L| response of the MC cells may contribute to psychophysical performance. The phase shift effect in MC cells directly parallels psychophysical results (Smith, 1991). ‘Luminance intrusion’ to the detection of |M – L| modulation at 10–15 Hz (Swanson, Ueno, Smith, & Pokorny, 1987) may be due to the 2F response. The 2F |M – L| response of MC ganglion cells probably also contributes to the ‘unsigned’ |M – L| motion signal found psychophysically (Dobkins & Albright, 1993) and in MT cells (Dobkins & Albright, 1994). Masking and motion aftereffect experiments have supported the conclusion that a luminance mechanism contributes to chromatic motion perception (Cavanagh & Favreau, 1985; Cropper & Wuerger, 2005; Derrington & Badcock, 1985; Mullen & Baker, 1985; Mullen, Yoshizawa, & Baker, 2003; Yoshizawa, Mullen, & Baker, 2003). Also, the amplitude of MC cells responses to the equiluminant border closely matches residual border distinctness of equiluminant borders in psychophysics (Kaiser et al., 1990; Valberg, Lee, Kaiser, & Kremers, 1992).
We first proposed that this non-linear 2F response was a straightforward non-linearity of M- and L-cone summation (Lee et al., 1989b). The way this might occur is shown in Figure 1A. We consider stimuli derived from red and green light sources. At the top are sketched stimulus waveforms for luminance modulation, red-green chromatic modulation and one of the silent-substitution conditions (Estévez & Spekreijse, 1982), in this case when only the M cone is modulated. The second row shows hypothetical modulation of cone signals, assuming a saturating non-linearity; such waveforms have been recorded in primate horizontal cells (Smith, Pokorny, Lee, & Dacey, 2001). The summed signals of M and L cones show a 2F response to chromatic modulation but the response to the luminance and silent substitution conditions are dominated by the fundamental. It will be shown that substantial higher harmonic distortions are present in MC cell responses to silent-substitution modulation. This requires development of a more complex model, as sketched in Figure 1B. We propose that MC cells possess an achromatic receptive field, but also receive a chromatic input derived from a rectified M, L opponent signals. We suggest this chromatic 2F response of MC cells is a specific feature designed to enhance motion signals in the MC pathway at or near equiluminance. The second model is elaborated in more detail in a later section. The extensive literature describing effects on luminance motion mechanisms by moving chromatic targets thus finds a physiological substrate.
Figure 1.

(A) A simple model by which a 2F chromatic response might be generated. Cone signals generated by the red and green stimulus waveforms in the top row show saturation. We assume these hypothetical signals, shown in the second row, are prior to the bipolar cells, so the cone response is hyperpolarizing. This model predicts a 2F chromatic response, but no major 2F distortions for silent substitution conditions. (B) Since such distortions were present, a more complex model was required to account for the data. The model is schematically indicated here and discussed in more detail in the Results section.
In this paper, we first describe the spatial characteristics of the 2F response, and show it derives from a limited field larger than the achromatic receptive field center but smaller than the achromatic surround. This provides additional evidence that the 2F response derives from a separate mechanism. We then provide evidence that it is a rectified |M – L| signal. Finally, we attempt to provide a simple scheme that partially accounts for its properties.
Methods
All procedures were approved by the State University of New York, State College of Optometry Institutional Animal Care and Use Committee and conformed to the ARVO Statement for the Use of Animals in Ophthalmic and Vision Research. Intra-ocular recordings were made from the eyes of five adult macaque monkeys (M. fascicularis) using procedures previously described (Lee, Martin, & Valberg, 1989a). Animals were initially sedated with an intramuscular injection of ketamine (10 mg/kg). Anesthesia was continued with 10 mg/kg thiopental and further maintained with isoflurane (0.2%–2%) in a 70%:30% nitrous oxide-oxygen mixture. Electroencephalogram (EEG), electrocardiogram (ECG), heart rate, temperature, and exhaled CO2 level were monitored continuously to ensure adequate depth of anesthesia. Muscle relaxation was maintained by a constant infusion of gallamine triethiodide (5 mg/kg per hour, intravenously) with accompanying dextrose Ringer's solution (6 ml/kg/h). Body temperature was kept close to 37.5°C by an electric heating pad. End-tidal CO2 was brought close to 4% by adjusting the rate of respiration.
Neuronal activity was recorded directly from retinal ganglion cells by a tungsten-in-glass electrode inserted through a cannula entering the eye behind the limbus. Optimal tip exposure was 4–5 μm for MC cells and 2–3 μm for PC cells, with resistances of 20–60 MΩ. The details of the preparation can be found elsewhere (Crook, Lange-Malecki, Lee, & Valberg, 1988). We recorded responses of cells between 4° and 12° eccentricity (PC cells mean 6.7°, MC cells mean 8.4°). Cell identification was achieved through standard tests (Lee, Martin, & Valberg, 1989c), which included achromatic contrast sensitivity and responses to lights of different chromaticity. Additional tests, e.g., measuring responses to heterochromatically modulated lights (Smith et al., 1992) were employed in cases when identification was difficult. PC cells can generally be identified by their tonic responses and spectral opponency, and MC cells by their phasic responses and lack of spectral opponency. For each cell, the locus of the receptive field center was determined and the stimulus was centered on this point. Times of spike occurrence were recorded to an accuracy of 0.1 ms, and averaged histograms of spike trains were simultaneously accumulated with 64 bins per cycle of modulation.
A gas-permeable rigid contact lens with internal radius matched to the corneal curvature was used to focus the eye on a tangent screen at a distance of 226 cm. The positions of the fovea and optic disk were marked on the screen with the aid of a rear-projecting fundus camera.
Visual stimuli
The temporal/chromatic properties of MC cells receptive field were measured using stimuli generated on a three-channel Maxwellian view system, which was controlled by a Macintosh Quadra 950 computer, as described elsewhere (Lee et al., 1990). Briefly, light from three light-emitting diodes (LEDs) (dominant wavelengths of 638, 554 and 470 nm) were collimated and combined to give a uniform field, and various field stops were used to give fields of different diameters (0.5, 1, 2, 4.7 deg) or equivalent annuli. The LEDs were driven by pulse-train frequency modulation to achieve a highly linear relationship between driving voltage and LED intensity. They could be modulated at temporal frequencies between 0.61 and 78 Hz, as described in Lee et al. (1990). Most measurements were made using only the 638 and 554 nm LEDs at a time-averaged retinal illuminance close to 2000 Td. The LEDs could be driven in phase (luminance modulation), out of phase (chromatic modulation), or at intermediate phases for the phase protocol.
Apart from the data in Figure 4, the spatial/chromatic properties of MC cells receptive fields were measured using chromatic patterns generated by a VSG3 system (Cambridge Research Systems, Kent, UK). Stimuli consisted of gratings, or uniform spots or annuli. Gratings subtended a 4 deg by 4 deg field. The diameter of the spots and the inner diameter of the annuli were varied from 4 to 384 arc min. The outer diameter of all annuli was set at 10 deg (600 arc min). The surround was set at the same mean luminance and chromaticity as the stimuli.
Figure 4.

Area summation of PC cells with chromatic spots (5 Hz, red-green modulation ∼27% RMS contrast for L and M cones). (A) Response amplitude (1F response) rises to a plateau. Center and surround responses reinforce one another, so the plateau diameter reflects total receptive field size, center plus surround. Data were fitted with a single cumulative Gaussian, since separate center and surround contributions were seldom apparent. (B) Gaussian radii of PC cells' receptive fields (center plus surround) and MC cells' chromatic fields (replotted with regression line from Figure 3) overlap.
For the moving edge stimuli data in Figure 4, data were obtained using an optical projection system described in Kaiser et al. (1990). Briefly, interference filters and halogen sources were used to provide beams of given dominant wavelengths. Light from the different optical paths were combined using a surface-silvered mirror edge, which was then focused on a back projection screen to be viewed by the animal. Movement of the edge was provided by a mirror mounted on a galvanometer.
Spectra of the LEDs (the Maxwellian view system) and of the three phosphors of the CRT monitor were measured with a spectrophotometer (Pro-703/PC, Photo Research, Palo Alto, CA). The LEDs were set to equiluminance by placing the front lens of the spectrophotometer in the plane of the pupil and adjusting their luminances. These values were checked by heterochromatic flicker photometry on an author whose luminosity function matched that of the Judd observer or with reference to an author who is a deuteranope (BBL). Illuminance of the LEDs was calibrated using a photometer (Spectraspot, Photo Research, Palo Alto, CA) using the method described by Westheimer (1966). For the CRT monitor, luminance and Gamma correction for each of the three guns was performed using a Cambridge OptiCal Photometer (Cambridge Research Systems, Kent, UK).
Individual cone excitations for each LED were calculated using the Smith-Pokorny fundamentals (Smith & Pokorny, 1975), and different combinations of the LEDs were calculated to provide modulation in different directions in an L, M cone plane. Responses to modulation along 16 different directions in the L, M cone plane were measured, the amplitude of the modulation being such that the vector length of the modulation was constant (30% RMS cone contrast of the L- and M-cones). Six different temporal frequencies for each modulation direction were usually tested.
For spatial/chromatic measurements involving chromatic stimuli presented on the CRT monitor, several ratios of R/G modulation were tested around the nominal R/G equiluminant ratio calculated based on the 10° Vλ luminosity function. There was some inter-cell variability in the R/G ratio that gave the minimal 1F |M – L| response amplitude, presumably due to inter-cell variability in cone weighting. The data set with the minimum 1F |M – L| response was chosen for further analysis of the 2F |M – L| response. The chromatic contrast for the nominal R/G equiluminant ratio was ∼27% RMS cone contrast for the L- and M-cones.
For all stimulus conditions, peri-stimulus time histograms were constructed from at least 6 seconds of presentation for each stimulus. Response amplitudes and phases were derived from Fourier analysis of the response histograms.
Results
We first describe spatial characteristics of the chromatic response of MC cells; in the later sections we show that it is likely to arise from a chromatic mechanism. We then attempt to describe how this chromatic response might be generated.
Spatial extent of chromatic response: Spots and annuli
In earlier work we noted that, for MC ganglion cells, the 2F chromatic response and the phase shift effect both became less prominent if spot stimuli were restricted to the receptive field center, and we suggested that these effects derive from the receptive field surround. We therefore tried to isolate the chromatic response with annular stimuli, so as to better assess their properties. The results were unexpected.
Figure 2 shows responses of an on-center MC cell as a function of the relative phase between the 638–554 nm LED modulation (the phase shift protocol) and for chromatic modulation (right panels) for 4-deg and 1-deg diameter spots (A,B) and a matching annulus (C; 4-deg outer diameter, 1-deg inner diameter). With the phase shift protocol, 1F response amplitude varies as a function of relative red-green diode phase. With the 4-deg spot, response amplitude goes through a minimum not to chromatic modulation (±180 deg) but at ∼135 deg. The solid line shows the fit of a rectified cosine function, which was used to estimate the relative phase of minimum response. With the 1-deg spot, the phase shift is less than with the 4-deg spot. However, with the annulus stimulus (which gave a good 1st harmonic response), the phase shift is almost absent, which is inconsistent with the idea that the underlying mechanism responsible for the phase-shift effect is coextensive with the surround. Note that the response phase to the annulus has been shifted by about half-a-cycle compared to the response to a small spot (arrowed for the 0 deg, the luminance modulation condition), which is consistent with a surround response. The same cell's responses to equiluminant 638/554 nm modulation are also shown in Figure 2. A similar pattern of results was found with the 2F chromatic response. There is a strong 2F chromatic response with the large spot, a smaller one with the smaller spot, but there is no 2F chromatic response with the annulus, just a small residual 1F response. Similar results were found with 6 other cells. These data thus suggest that the surround region that generates the 2F chromatic responses and the phase shift is restricted in size, and smaller than a separate achromatic surround mechanism.
Figure 2.
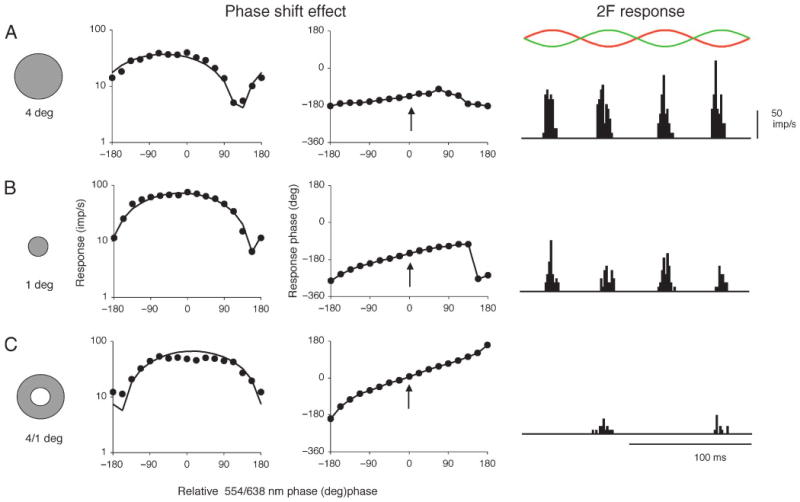
Responses of a parafoveal MC cell to phase paradigm and to chromatic, |M – L| modulation. For phase paradigm (phase shift effect), 638 and 554 nm light sources were modulated at different relative phases. Response amplitude (1st harmonic) and phase are shown (1.22 Hz, 50% LED modulation, mean of 8 cycles). The response minimum is shifted away from ±180°. The solid lines show a fit of a rectified cosine function. The shift is marked with a 4° field (A) but less with a 1° field (B). However, a surround annulus (C) (note 180° phase shift in achromatic response, which is arrowed, for surround condition) fails to evoke a shift. With 638–554 nm chromatic modulation (2F response; 10 Hz, 64 cycles averaged for histograms) there is a response at twice the stimulus frequency (waveforms sketched above). This is strong with a 4° field (A) but less with a 1° field (B), and absent with an annulus. These data are consistent with a chromatic input of intermediate size between achromatic center and surround.
To estimate the spatial extent of this mechanism more precisely, we concentrated on the 2F chromatic |M – L| response, since making the phase shift measurements was time consuming. We measured the 1F luminance, |L + M| response and 2F chromatic, |M – L| responses as a function of the diameter of a spot stimulus and of the inner diameter of an annulus stimulus. Representative data from an on-center MC cell are shown in Figure 3. Figure 3A shows the 1F response amplitude to a 5 Hz 30% luminance modulation (black circles) and a 2F |M – L| response amplitude (red circles) to a 5 Hz |M – L| equiluminant modulation (chromatic modulation ∼27% RMS contrast for the M and L cones) as a function of spot diameter. The luminance response rises to a maximum as the spot fills the center and then decreases as it encroaches upon the surround. The solid line represents the fit of a model described below. For the 2F chromatic response, four different R/G ratios around nominal equiluminance were tested, and the 2F |M – L| responses for the R/G ratio yielding the minimum 1F |M – L| response are shown here (although other ratios yielded similar data). The 2F chromatic response rises to a plateau. Our earlier result is confirmed by these data; with large spots (the right-hand end of the curves) the 1F luminance response is of similar amplitude to the 2F chromatic response, but with small spots the 1F luminance response is ∼0.5 log units larger than the 2F chromatic response (rising limbs of the curves). Figure 3B shows 1F luminance and 2F chromatic responses to annuli of increasing internal diameter. The 1F luminance response shows a complex shape. At small diameters the annulus encroaches on the center, which dominates the response; the surround dominates at larger diameters, which was indicated by a substantial phase shift (not shown). The 2F chromatic response simply decreases as inner diameter increases, falling off at a smaller inner diameter than the luminance response, which would indicate the chromatic input has a smaller spatial extent than that of an achromatic surround.
Figure 3.
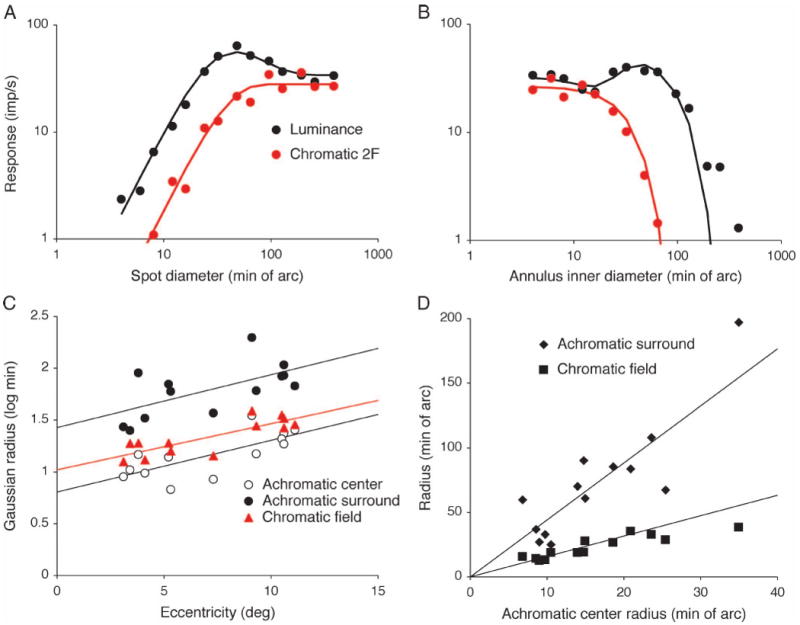
Area summation curves for the different response components. Response amplitude for modulated spots (A) or annuli (B) for a representative MC cell. Luminance (30% contrast) or |M – L| chromatic modulation responses (30% RMS cone contrast, R/G ratio adjusted to each cell's 1st harmonic null) are shown. 5 Hz modulation, 32 cycles. Amplitude and phase (not shown) were fitted as described in the text (solid lines). Free parameters of interest are achromatic center and surround sizes (σc, σs) and size of the chromatic field (σchr) generating the 2F response. (C, D) These parameters (σc, σs, σchr) are plotted against eccentricity in C for an MC cell sample and fitted with the linear relations shown. The 2F chromatic response field (σchr) is of intermediate size to achromatic center (σc) and surround (σs). (D) Size of achromatic surround (σs) and chromatic 2F field (σchr) plotted against achromatic center radius (σs), with linear regression lines. Data are again consistent with a mechanism larger than the achromatic center (σc) but smaller than the achromatic surround (σs).
The results in Figure 3 are consistent with a classical achromatic center-surround receptive field with a mechanism of intermediate diameter responsible for the chromatic response. To estimate spatial parameters of the achromatic receptive field, cell response R(rlum) to luminance spots of radius rlum were fitted with a center-surround model by
| (1) |
and response R(rlumann) to luminance annuli of internal radius rlumann by
| (2) |
where C represents temporal modulation contrast, Ac and As are scalars for center and surround strengths, σc and σs are center and surround Gaussian radii, φc is center response phase and φdelay is a center-surround phase delay. Data were fitted in the complex plane using a least-squares criterion and can be seen to provide an adequate description of the data. Mean fit parameters (n = 13) are given in Table 1. Center phase was similar to a previous report (Smith et al., 1992) and center-surround phase delay was greater than a half cycle by an amount equivalent to a center-surround delay of 14.2 msec. Such a value is similar to center-surround delays in, for example, cat X cells (Frishman, Freeman, Troy, Schweitzer-Tong, & Enroth-Cugell, 1987).
Table 1.
Fit parameters for data shown in Figures 3 and 4 from Equations 1–4.
| MC cells (n = 13) | PC cells (n = 20) | |
|---|---|---|
| Center radius (min) | 12.4 ± 5.1 | |
| Surround radius (min) | 56.8 ± 29.2 | |
| Chromatic radius (min) | 19.3 ± 6.9 | 14.7 ± 7.2 |
| Surround/center weight | 16% ± 6% | |
| On center phase (rad) | −0.18 ± 0.09 | |
| Off center phase (rad) | −3.49 ± 0.21 | |
| Surround lag (rad) | 0.16 ± 0.06 | |
| Eccentricity (deg) | 7.18 ± −3.1 | 52 ± 2.6 |
The 2F chromatic response was fitted with a single Gaussian profile using similar equations with equivalent parameters.
| (3) |
| (4) |
Again, the data were fitted in the complex plane and the equation provides an adequate description of the data.
The parameters of major interest are the spatial extents of achromatic center, surround and 2F chromatic mechanism. There was no obvious difference between on- and off-center cells. All three parameters (achromatic center radius σc, achromatic surround radius σs, chromatic field radius σchr) increased in a parallel manner with eccentricity, as seen in Figure 3C. Regression lines for the three radii are of similar slope. Figure 3D shows the radii of the achromatic surround and 2F chromatic |M – L| mechanisms as a function of achromatic center radius. The ratio of achromatic surround to center radius was 4.41:1 (SD 1.31; n = 13) while the ratio of the radius of the chromatic field to that of the center was significantly smaller at 1.58:1 (SD 0.38; p < 0.001, paired t test).
The results in Figures 2 and 3 suggest a chromatic mechanism with an extent somewhat larger than the center but smaller than a separate, achromatic surround. We suggest that the mechanism is of similar radius for both the 2F chromatic |M – L| response and the 1F chromatic |M – L| response responsible for the phase shift effect, and that these mechanisms may be linked.
We tested if this mechanism was of similar extent to PC cell receptive fields (center plus surround), as might be the case if it received an |M – L| opponent input (see later section). Area-summation curves were performed on PC cells 1F responses to |M – L| chromatic modulation, and typical results are shown for a +L − M cell in Figure 4A. It should be stressed that this area-summation curve reflects the summed response of both center and surround. The data have been fitted with Equation 3 to obtain an estimate of the spatial extent of the receptive field, which just contains one spatial parameter. This neglects the center-surround structure of the PC-cell field. Since |M – L| modulation will activate center and surround in synergy, no response peak (as in Figure 3A for MC cells and achromatic modulation) is expected. Rather, an inflection on the rising limb of the area summation curve might be anticipated. However, such inflections were not obvious. To try to obtain a better measure of center-surround structure, we also measured responses to luminance-modulated spots, but response amplitudes were weak due to the low achromatic contrast sensitivity of this cell type and the data were noisy. We thus retained the fit to the chromatic spots using a single Gaussian. This provided a direct comparison with the MC-cell chromatic mechanism diameter, but it should be stressed that this single spatial parameter includes both center and surround.
The single-parameter fits nevertheless provided a satisfactory description of the data, as seen from the fitted curve in Figure 4A. Figure 4B shows the data and regression line for radii of MC-cell chromatic fields replotted from Figure 3 together with radii of all PC cells tested (+L − M, +M − L on- and off-center cells combined). The two sets of radii can be seen to overlap and did not differ significantly (t test, P > 0.5). This result is consistent with the suggestion that the chromatic response of MC cells arises from a chromatic mechanism about the same size as local PC cells receptive fields. It is also of note that the total extent of the PC cell receptive field (center plus surround) is much smaller than the achromatic surround of the MC cell, which is contrary to the suggestion that the surrounds of both these cell types have a common origin in the outer retinal horizontal cell network (McMahon, Packer, & Dacey, 2004). The fit parameters for the different cells and conditions are summarized in Table 1.
Spatial extent of chromatic response: Edges and gratings
MC cells give an excitatory response to equiluminant edges irrespective of the direction of chromatic contrast (Kaiser et al., 1990; Schiller & Colby, 1983). In both studies, informal inspection of the published histograms indicated that the widths of response peaks were similar for equiluminant responses compared to luminance edges, and Kaiser et al. noted that this was consistent with mechanisms of comparable diameters, provided that edge movement is slow. The width of the discharge region to a luminance edge approximates center size (Derrington & Lennie, 1982) so the width of the response at equiluminance may provide an estimate of the size of the chromatic response field compared to the receptive field center. Figure 5 shows MC-cell responses to |M – L| equiluminant edges (626/508 nm) and luminance edges of different contrasts moved across the receptive field at 4 deg/sec. For the on-center cell shown in the histograms, the left and right members of the top row (A) shows responses to an 626/508 nm edge with two contrast polarities, while the center histogram shows a condition close to equiluminance. The lower row (B) shows the same cell's responses when the wavelengths are reversed. Response magnitude is dependent on the direction of luminance contrast, but at equiluminance a response to both directions of chromatic contrast is present. The width of this response peak is ∼100 msec, long compared to impulse response peaks of MC cells at the luminance level used (Lee, Pokorny, Smith, & Kremers, 1994). Response histograms were fitted with a Gaussian profile with 3 free parameters; the Gaussian radius, an amplitude scalar and a DC offset term to account for maintained activity. A comparison of the Gaussian radii for an achromatic luminance edge condition (not shown in histograms) and for the equiluminance red-green edge condition are shown in Figure 5C. The width of the response peak to the chromatic borders was similar but on average slightly larger (1.16, p < 0.01, n = 27, paired t test) than the width of the luminance response peak; most points can be seen to fall above the unity ratio line. This is consistent with a chromatic mechanism with a receptive field slightly larger than the achromatic receptive field center.
Figure 5.

Response histograms of MC on-center cell to 626/508 nm borders with differing luminance contrasts (average of 20 sweeps). In upper row and lower rows (A, B) the direction of chromatic contrast is reversed. The on-center cell shows an excitatory response to a luminance increment edge. To the equiluminant edge there is a response to both directions of chromatic contrast. Solid lines show fits of a Gaussian function. (C) Plot of chromatic vs. achromatic radius fit values. Most points can be seen to lie above the unity ratio line. Data are consistent with a chromatic response from a mechanism somewhat larger than the achromatic field center.
Another way of determining the spatial extent of receptive fields is by means of spatial frequency tuning curves. We measured tuning curves to luminance and chromatic gratings for a small sample of MC cells and fitted them with both a difference-of-Gaussians model (for luminance) and a single Gaussian (for chromatic data). For the chromatic condition, curves were measured at several R/G ratios, and again the data set measured with the R/G ratio that gave the minimal 1st harmonic |L − M| response was chosen for further analysis. Figure 6 shows examples of tuning curves from two cells. The data were acquired at constant contrast (as indicated in figure caption). Low-frequency surround attenuation was variable for the luminance condition, and minimal in the examples shown. 2F chromatic responses to equiluminant red-green modulation fall off at lower spatial frequencies than for luminance modulation. The fit curves provide a reasonable description of the data. The parameters of interest are achromatic center radius (rc) and the radius of the chromatic mechanism (rchrom). The mean ratio (rchrom/rc) was 2.20 (SD = 0.55, n = 5). In this small sample of cells, measures of surround size were not sufficient to provide a reliable estimate; but others (Croner & Kaplan, 1995) have estimated through tuning measurements that the surround of MC cells is 3–4 times the size of the center.
Figure 6.
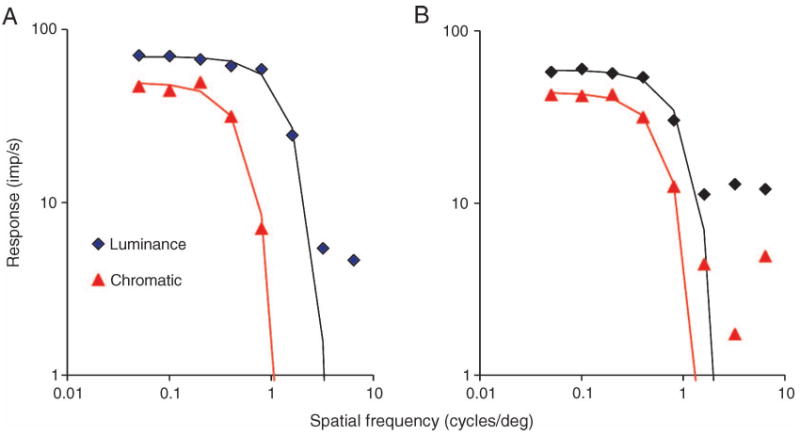
Spatial frequency tuning curves for two MC cells for the 2F chromatic response and the achromatic response. Both were acquired at constant modulation contrast (achromatic 30%, chromatic ∼27% RMS contrast for the M and L cones; temporal frequency 5 Hz, averaged over 32 sweeps). In the examples shown, the achromatic tuning curves show little low spatial frequency attenuation. The high spatial frequency cut-off is lower for chromatic modulation.
These results confirm the suggestion that the mechanism providing a chromatic response in MC cells is larger than the center, but smaller than the surround, i.e., a spatially separate mechanism.
Spatial summation of the MC-cell chromatic response
The 2F chromatic response of MC cells could arise from a nonlinear combination of chromatic elements in which spatial summation has already taken place, or from some form of subunit structure consisting of an array of nonlinear elements. Such a structure is present in cat Y cells, in which achromatic subunits result in nonlinear spatial summation (Enroth-Cugell & Robson, 1966). This may be manifest in two ways. Firstly, counterphase modulation of a sinusoidal grating yields a frequency-doubled response irrespective of spatial grating phase for Y cells; for cat X cells, which display linear spatial summation, there is a grating position where there is a complete response null. Secondly, as the spatial frequency of a drifting grating is increased, the modulated response may die away, but an increase in maintained activity persists up to higher spatial frequencies. This is found in cat Y cells but is not present in cat X cells (Enroth-Cugell & Robson, 1966).
It is generally accepted that MC and PC cells of the macaque display predominantly linear spatial summation with counter-phase modulated luminance gratings (Blakemore & Vital-Durand, 1986; Derrington & Lennie, 1984; White, Sun, Swanson, & Lee, 2002), and show no elevation of maintained activity to high spatial frequency drifting gratings (Crook et al., 1988). However, if the 2F chromatic response of MC cells were due to a subunit structure, then the two features described above should be present.
We tested if it was possible to null out the 2F chromatic response. We presented counterphase modulated luminance (4.88 Hz, 30% contrast) and red-green, |M – L| gratings (4.88 Hz, ∼27% RMS contrast for the M and L cones) at different spatial phases relative to a cell's receptive field. Spatial frequency was chosen so as to be low enough to evoke a 2F response, and the R/G ratio was chosen so as to yield a minimum 1F response. Figure 7 shows representative data from two MC cells. The top panels show response amplitudes and phase to counter-phase modulated luminance grating, and the bottom panels show responses and phase to counter-phase modulated chromatic gratings. The 1F |M + L| response was inverted in sign in the plots corresponding to the phase reversal of the response. As reported by others, the 2F |M + L| response is small compared to the 1F response (mean nonlinearity index = 0.25, SD = 0.06, n = 9), which indicates linear spatial summation. In the lower panels, the 1F and 2F responses have been plotted for counter-phase modulation of chromatic gratings. The 1F residual response is small, and its phase (not plotted) was variable. The 2F chromatic response goes through minima close to the 1F luminance response minima. The 2F chromatic response was not always completely abolished, probably due to a slightly off-center alignment of the reversing grating relative to the receptive field. However, these residual responses were comparable for both luminance and chromatic gratings, as discussed below.
Figure 7.

Spatial summation of 1F achromatic and 2F chromatic components. Spatial nonlinearities in cat Y cells result in a 2F response to counterphase modulation of gratings symmetrically positioned about the receptive field center, which has been attributed to a subunit structure. With counterphase modulation of chromatic gratings, a null could be found which indicates that the non-linear response is not due to a subunit structure. (A, B) Amplitude and phase of responses of two MC cells to counterphase modulation (0.2 cpd, 4.88 Hz) of achromatic (30% contrast) and red-green chromatic gratings (27% RMS contrast for M and L cones). For the achromatic gratings, there is a 1st harmonic response minimum and phase reversal at 2 phase loci, with little 2nd harmonic response. This is consistent with linear spatial summation. For the 2F chromatic response, there are minima close to the minima for achromatic modulation. 2F phase is not affected. These data are consistent with linear spatial summation within chromatic mechanisms prior to nonlinear summation.
Other cells (n = 8) behaved in the same manner. For quantitative analysis of spatial nonlinearity, a nonlinearity index (mean 2F/peak 1F response) is often used (Hochstein & Shapley, 1976), but since there is only a 2F response to chromatic modulation this index is inappropriate. We thus used the ratio of the minimum to maximum 2F responses from such data as in Figure 7. These values were 0.196 (SD = 0.11, n = 10) and 0.179 (SD = 0.12, n = 10) for achromatic and chromatic responses respectively. These values do not differ significantly (p = 0.76, paired t test). The low ratios indicate a strong modulation of both 1F achromatic and 2F chromatic responses as a function of spatial phase. We conclude that the 2F chromatic response has a spatial null.
For the sample of MC cells for which spatial frequency tuning curves were measured, as described in the previous section, we found the first grating frequency that failed to deliver a modulated response (<10 imp/sec), and compared mean activity to stimulation at this spatial frequency with maintained activity to a uniform field. Mean ratio of the two was 0.96 (SD = 0.13, n = 5) for luminance gratings and was 1.09 (SD = 0.24, n = 5) for chromatic gratings. There is thus no elevation of maintained activity with high spatial frequency chromatic gratings, which again argues against a subunit structure.
We interpret this result as indicating that the 2F chromatic response arises from a nonlinear interaction of chromatic mechanisms in which spatial summation has already taken place.
Response to different directions of modulation in an L/M cone space
We originally suggested (Lee et al., 1989b) that the 2F response of MC cells might be due to non-linearities in the signals from M and L cones prior to opponent summation, as was illustrated in Figure 1. However, if this were the case there should be no 2F response under the silent substitution conditions. Figure 8 illustrates this is not the case. Figure 8A shows cone modulations. If the two cones modulate in phase (the luminance condition), summation will result in a similar waveform, with primarily a fundamental response, but if they modulate in counter-phase (when the waveforms subtract), a response at twice the stimulus frequency would be anticipated. The other conditions shown are when only one cone is modulated, as in silent substitution (Estévez & Spekreuse, 1974).
Figure 8.

1F and 2F responses of a MC cells as a function of modulation direction in an M,L color space at different temporal frequencies. (A) Sketch of cone modulation for luminance modulation, chromatic modulation, and the silent substitution conditions. (B) Response of an MC on-center cell to different conditions (9.8 Hz; mean RMS contrast for M, L cones 30%). For the response to luminance modulation the 1st harmonic dominates. For the other conditions, there is a marked 2F component, even for the silent substitution conditions. This indicates that the 2F component is not due to a simple non-linearity of cone summation. (C–E) 1F and 2F response components as a function of modulation direction in L,M cone space at three frequencies as indicated. Mean cone contrast was held constant for each condition. The 1F response is maximum to luminance modulation and minimum to chromatic modulation. At 2.4 and 9.8 Hz, the 2F response is minimum to luminance modulation, marked to the silent substitution conditions and maximum to chromatic modulation.
We modulated the luminance and chromaticity of a 4-deg uniform field along different directions in an L/M cone plane at different temporal frequencies. The mean RMS cone contrast was held constant (30%) for all modulation directions. Figure 8B shows responses to the four conditions for an on-center MC cell with a prominent frequency-doubled response (9.8 Hz, 30% RMS cone contrast, two cycles of modulation). To luminance modulation, there is a single response peak with some distortion in shape, but most of the response energy is in the first harmonic. To chromatic modulation, there is a 2F chromatic response. However, for the M- and L-cone modulation conditions there are also 2F responses. In Figures 8C, 8D, and 8E, we plot the amplitude of the 1F and 2F responses in the L/M cone plane for three stimulation frequencies. At all frequencies, the 1F response is largest to luminance modulation. At 2.4 and 9.8 Hz, the 2F response is minimal to luminance modulation, but as soon as the stimulus vector moves away from the luminance axis (indicated in Figure 8C) the 2F response appears. This result would not be expected from a simple non-linear cone summation model. At 26 Hz, the 2F chromatic response has largely been lost, and the 2F component is mainly on the luminance axis, and reflects response waveform distortions due to the vigorous response at this frequency.
MC cells varied in the amplitude and shape of the higher harmonic distortions in different directions in the L/M space. We cannot rule out that some contribution to the 2F response arises due to non-linearities in cone responses. However, in almost all cells, higher harmonic distortions were evident in the silent substitution conditions. To illustrate this we calculated a distortion factor, h, as used by Lankheet, van Wezel, and van de Grind (1991) to describe distortion of horizontal cell responses in the cat,
| (5) |
where di is the ith harmonic response. We summed up to the 10th harmonic, above which little response was present. Figure 9A shows the averaged distortion (n = 16, on- and off-center MC cells combined) as a function of the vector angle. At 2.4 and 9.8 Hz, there is least distortion to luminance modulation, greater distortion for the silent substitution conditions, and maximum distortion for chromatic modulation. At 26 Hz, the 2F chromatic response was small or absent and the distortion bears no obvious relation to the space.
Figure 9.

(A) Non-linearity index (a measure of response distortion; see text) for a sample of MC cells (n = 16, on- and off-center cells combined) as a function of direction of modulation in an M, L cone space at 3 frequencies. At 2.4 and 9.8 Hz, the index is minimal for luminance modulation but increases as the axis of modulation moves toward the silent substitution directions, and is maximal in the chromatic quadrant. At 26 Hz, most response distortions were associated with response rectification. (B) Response of a PC cell to 2.4 Hz modulation in L, M space. There is a response minimum to luminance modulation and maximum response to chromatic modulation.
The shape of the MC cell 2F response contour in Figures 8C, 8D, and 8E resembles the PC cell 1F response contour in the M, L-cone plane. An example of a +L − M cell is shown in Figure 9B. 1F and 2F responses are plotted in the L, M cone space. There is a minimum response to luminance modulation and a maximum response in the chromatic quadrant. Response amplitude increases rapidly when moving away from the luminance axis, as with the 2F MC cell response. This similarity in shape is consistent with the 2F response being a rectified chromatic signal.
Generation of 2F signal
Before attempting to find a simple scheme that can generate the 2F |M – L| signal, we further specify its characteristics, in particular its phase. Figure 10A shows the modulation of red and green lights, either red alone, green alone, or in equiluminant counterphase; and Figure 10B shows hypothetical responses of an on-center MC cell which receives additive L, M cone inputs. Responses to the red or green modulation alone are out of phase of each other, as shown in the upper and lower panels. Two alternatives for the 2F chromatic response phase are shown in the center panels of Figure 10B. The 2F chromatic response peaks can either line up with peaks when luminance contrast is present (vertical lines have been drawn to illustrate this) or line up in quadrature, at 90° phase shift to the luminance peak. Other phases would be conceivable, if unlikely. Also, it remains to be determined whether on- and off-center cells 2F responses have the same phase.
Figure 10.

Amplitude and phase of 1F and 2F responses of on- and off-center cells (2.5 Hz drifting gratings, 0.2 cpd). (A) Stimulus waveforms for three modulation conditions, modulation of red light alone (R alone), green light alone (G alone) and counterphase condition. (B) Two possible response phases; 2F responses could line up with the peaks of the 1F responses, or be at 90° to this value. (C–D) Responses of on- and off-center MC cells to the three conditions, and to intermediate conditions corresponding to modulation of the L and M cone alone (20 sweeps, 64 bins/sweep). The peaks of the 2F response tend to line up with the peaks of the luminance response. Vertical lines have been drawn in C, D to illustrate this. The on-center cell displays a 2F response to the silent substitution conditions. The 2F response of the off-center cell is of smaller magnitude. E. Amplitude and phase of 1F and 2F components as a function of R/G gun modulation luminance ratio. 2.5 Hz, 20 sweeps. 1F responses go through a minimum close to a ratio of 1, where 2F ratios are maximal. 1F phases go through a reversal close to a ratio of 1. 2F ratios converge to similar values around 1.
Figures 10C and 10D show responses of an on- and an off-center MC cell to drifting red-green gratings at different ratios of the modulation as indicated. A low temporal frequency (2.17 Hz, 50% luminance contrast for red and green light alone, two cycles shown) was chosen so that any latency difference between luminance and 2F response had minimal effect on relative phase. For the red-alone and green-alone conditions the responses are out of phase. At equiluminance (R = G) the 2F response approximately lines up with the peaks of the top and bottom histograms for both cells. These differed substantially in the size of the 2F response, but phase was the same for both. Also shown are the responses to R/G ratios that modulated either the M or L cone alone. There is a marked 2F response for the on-center cell, as in Figure 8. The phase of the 2F response is similar through the set of histograms.
Figure 10E shows amplitudes and phases of 1F and 2F for the two cells. First harmonic amplitude goes through a minimum close to equiluminance, at which point a significant 2F response is present. There is an abrupt 1F phase reversal close to equiluminance, where 2F phase converges toward similar values for the two cells. There was no difference in 2F phase between a sample of on- and off-center cells measured under identical conditions (9 on-, 7 off-center cells, p > 0.1, t test). It is also possible to compare the difference between 1F and 2F phase; this should be zero if the peaks line up. It should be noted that the 2F phase has then to be divided by 2 since the phase of the 1F is non-zero, due to latency and other effects. These phases did not differ significantly (mean = −8.4°, n = 16, SE = 7.2°).
Figure 11 shows a simple scheme that could generate such response patterns. Figure 11A shows a sketch of an achromatic receptive field and Figure 11B shows two chromatic receptive fields of opposite polarity (+L − M and +M − L). The waveforms shown in the upper part of the figure are those expected of modulation of the L cone alone, based on the phosphor spectra and knowledge of the cone fundamentals (Smith & Pokorny, 1975). The achromatic receptive field yields a modulated response, as do both the chromatic receptive fields, which respond in counterphase. If these chromatic responses are subject to a thresholding or accelerating non-linearity, and then summed, a 2F response results. This may then add to the achromatic response to produce a pattern of responses (lower row) that resembles those in Figure 10. There is solely a 2F response at the equiluminant point, and a response with both first and second harmonic components at the silent substitution conditions. We do not consider how this 2F response might be related to the 1F chromatic response (Smith et al., 1992). However, any imbalance between the two chromatic inputs in Figure 11 will yield a 1F as well as a 2F response. Further analysis of the relation between these inputs will be presented elsewhere.
Figure 11.
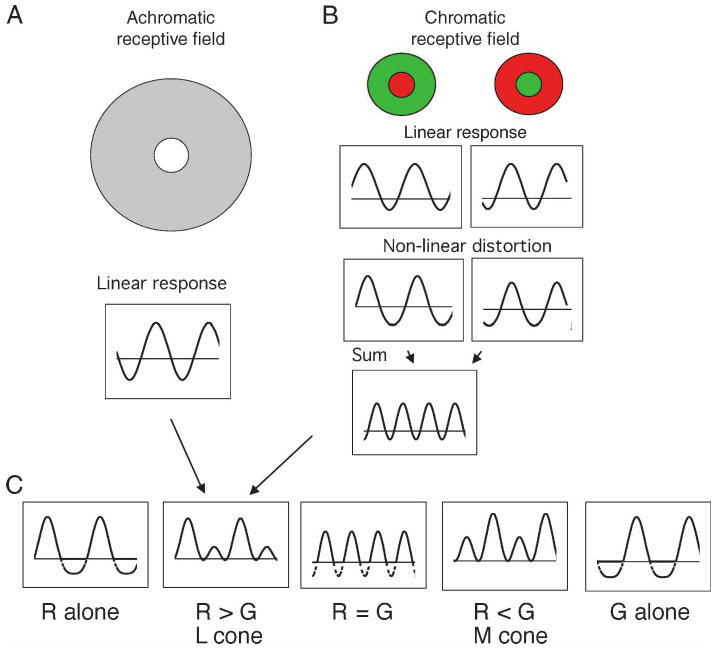
A scheme as to how the 2F response may be generated. An achromatic receptive field yields a 1F response to sinusoidal modulation. (The example shown for the upper panels is that expected for L cone modulation alone.) Two chromatic receptive fields of opposite cone polarities (+L − M and +M − L) yield responses in counterphase. An accelerating (squaring) nonlinearity is applied to these waveforms; the resulting sum shows a 2F response. When added to the achromatic response in different conditions (lower panels), the pattern of responses seen is similar to that observed empirically. Rectification of response histograms has been indicated by dashed lines for negative firing rates.
Discussion
Although cells of MC pathway provide the substrate for photometric tasks such as heterochromatic flicker photometry and the minimally distinct border, they respond to equiluminant red-green temporal alternation or spatial borders. This may take the form of a 1F or 2F chromatic response. The 1F chromatic response was defined using the phase protocol described earlier. Those results could only be explained by assuming a chromatic input (Smith et al., 1992). The phase protocol requires a time consuming set of measurements. The 2F chromatic response is obvious and easily measured with gratings or uniform fields, and is the main focus of this report. We suggest here that the 2F chromatic response also derives from a chromatic source. Both the 1F and 2F chromatic response derive from a receptive field larger than an achromatic center mechanism but smaller than an achromatic surround (Figures 1–5), and we suggest they may share a common substrate.
The scheme proposed in Figure 11 assumes that +L − M and +M − L cone opponent signals are subject to an accelerating or threshold nonlinearity, and then sum to yield a 2F chromatic response, which adds to the signal from an achromatic, +M + L cone receptive field. This would yield a 2F response of the characteristics observed in Figure 10. Similar calculations using a saturating non-linearity (not shown) would yield a 2F response in quadrature phase, which was not observed. The size of the chromatic field generating the 2F response is about the size of a PC cell receptive field at equivalent eccentricity (Figure 4), which would be consistent with a scheme as in Figure 11. It was possible to null out the 2F response with a counterphase modulated chromatic grating (Figure 7), which is consistent with linear summation within the chromatic mechanism generating the 2F response, prior to the non-linearity.
Since there is no M, L cone opponency in horizontal cells of outer retina (Dacey, Lee, Stafford, Pokorny, & Smith, 1996), the locus of the summation of luminance and rectified chromatic signals would probably be in the bipolar cell inputs within the inner plexiform layer, and could be mediated through, for example, a small-field amacrine cell. At retinal illuminance greater than ∼200 td, we have found a 2F responses to be present in almost all MC cells studied, although of variable magnitude, as shown in the examples in Figure 10. The 1F chromatic response was also found in almost all cells investigated. It thus appears to be a reliable feature of the MC pathway. The presence of such 2F chromatic responses in area 17 neurons has received less attention, but in a recent study a 2F chromatic response to red-green chromatic gratings was frequently encountered in simple cells of the awake macaque area 17 driven by the MC pathway (Chen et al., 2007).
Functional considerations
It is possible that the 2F chromatic responses arises as a consequence of random connectivity within the inner plexiform layer, so that there is some crosstalk between pathways responsible for midget and parasol ganglion cell signals. However, specificity of retinal connectivity is a significant feature of primate retina. H1 horizontal cells almost completely avoid input from S cones (Dacey et al., 1996), as do cells of the MC and PC pathways (Sun, Smithson, Zaidi, & Lee, 2006). One of the authors (Lee, 2008) has argued that retinal connectivity strives to be specific enough to meet functional requirements, although this specificity need not be complete. In any event, the 2F chromatic response is likely to enhance in natural scenes responses to red-green borders that are close to equal luminance. The distinctness of equal luminance borders in the MDB task closes matched the residual response in MC cells after both are normalized to achromatic contrast responses (Kaiser et al., 1990; Valberg et al., 1992).
In a more functional context, a non-signed red-green motion signal has been described both psychophysically (Dobkins & Albright, 1993) and in cells of MT (Dobkins & Albright, 1994). ‘Non-signed’ implies a red-green border signal that is not sensitive to the direction of red-green contrast, but only to the presence of such a border. This would be expected from a 2F signal from the MC pathway. The interactions which indicate that chromatic motion can affect luminance motion mechanisms (Cavanagh & Favreau, 1985; Cropper & Wuerger, 2005; Derrington & Badcock, 1985; Mullen & Baker, 1985; Mullen et al., 2003; Yoshizawa et al., 2003) could also arise from this source, but could also be attributed to a residual signal in the MC pathway at equiluminance due to variation in the L, M cone weighting of these cells. Cavanagh and Anstis (1991) tried to investigate the contribution of such MC pathway signals to chromatic motion by attempting to null them with the ‘luminance lure’ technique. If a ‘luminance lure’ cannot null a chromatic motion percept, then they suggested that this is evidence that the chromatic motion signal does not originate in a luminance (MC) pathway. Their arguments for nulling a residual 1F response are valid, but the ‘luminance lure’ trick cannot work with the MC cell 2F response, since a 2F ‘luminance lure’ cannot simultaneously null on- and off-center MC cells. To the extent that one group is nulled, the response of the other will be enhanced.
Another psychophysical manifestation of the 2F response is likely to be the intrusion of a luminance mechanism into detection of red-green chromatic modulation that occurs at frequencies of 12–15 Hz (Swanson et al., 1987). At these frequencies, the color alternation is not apparent and the residual flicker is indistinguishable from luminance flicker. The degree of intrusion with lights of different wavelengths is proportional to the |L − M| difference signal (Lee & Yeh, 1994), as is the MC cell 2F response (Lee et al., 1989b) and residual MDB border distinctness (Kaiser et al., 1990).
A 1F chromatic response is required to account for results with the phase protocol described above. The psychophysical phenomenon was first described by de Lange (1958) and was attributed to a latency difference of the M and L-cones. However, the difference in latency required proved implausible, and the effect was shown to have a physiological basis in cells of the MC pathway (reviewed in Smith, 1991). Similar conclusions were drawn by Stromeyer et al. (2000). It is difficult to assign a functional significance to these effects in the normal environment.
We have not attempted to incorporate a 1F component in the simple analysis of Figure 11. However, any asymmetry in the two chromatic inputs will yield a chromatic signal with both 1F and 2F components. Both the 1F and 2F MC cell responses are dependent on mean chromaticity. The 2F component becomes larger at long wavelengths (J. Pokorny, B.B. Lee, V.C. Smith, unpublished observations), whereas the 1F component is also more marked at long-wavelength chromaticities, and disappears and then reverses as mean chromaticity moves toward short wavelengths (Lee & Sun, 2004). A further analysis linking these phenomena is in progress.
In conclusion we suggest that the 2F chromatic response of MC cells is likely to have functional significance in enhancing movement responses to red-green borders close to equiluminance. The other features of MC cell chromatic responses are probably a consequence of this effect, and of less functional significance.
Acknowledgments
We would like to thank Joel Pokorny, Vivianne Smith, Paul Martin and Arne Valberg, with whom we have discussed these effects over a considerable period. Paul Martin also offered useful comments on the manuscript. This work was partially supported by NEI EY13112 to BBL.
Footnotes
Commercial relationships: none.
Contributor Information
Barry B. Lee, SUNY College of Optometry, New York, USA, & Max-Planck Institute for Biophysical Chemistry, Göttingen, Germany
Hao Sun, Buskerud University College, Kongsberg, Norway.
References
- Blakemore C, Vital-Durand F. Organization and post-natal development of the monkey's lateral geniculate nucleus. The Journal of Physiology. 1986;380:453–491. doi: 10.1113/jphysiol.1986.sp016297. [DOI] [PMC free article] [PubMed] [Google Scholar]
- Cavanagh P, Anstis S. The contribution of color to motion in normal and color-deficient observers. Vision Research. 1991;31:2109–2148. doi: 10.1016/0042-6989(91)90169-6. [DOI] [PubMed] [Google Scholar]
- Cavanagh P, Favreau OE. Color and luminance share a common motion pathway. Vision Research. 1985;25:1595–1601. doi: 10.1016/0042-6989(85)90129-4. [DOI] [PubMed] [Google Scholar]
- Chen Y, Martinez-Condez S, Macknik S, Swadlow H, Alonso JM, Lee B. Input to cells in macaque V1 revealed with a novel grating stimulus [Abstract] Journal of Vision. 2007;7(15):57, 57a. doi: 10.1167/7.15.57.. http://journalofvisionorg/7/15/57/ [DOI]
- Croner LJ, Kaplan E. Receptive fields of P and M ganglion cells across the primate retina. Vision Research. 1995;35:7–24. doi: 10.1016/0042-6989(94)e0066-t. [DOI] [PubMed] [Google Scholar]
- Crook JM, Lange-Malecki B, Lee BB, Valberg A. Visual resolution of macaque retinal ganglion cells. The Journal of Physiology. 1988;396:205–224. doi: 10.1113/jphysiol.1988.sp016959. [DOI] [PMC free article] [PubMed] [Google Scholar]
- Cropper SJ, Wuerger SM. The perception of motion in chromatic stimuli. Behavioral and Cognitive Neuroscience Reviews. 2005;4:192–217. doi: 10.1177/1534582305285120. [DOI] [PubMed] [Google Scholar]
- Dacey DM, Lee BB, Stafford DK, Pokorny J, Smith VC. Horizontal cells of the primate retina: Cone specificity without spectral opponency. Science. 1996;271:656–659. doi: 10.1126/science.271.5249.656. [DOI] [PubMed] [Google Scholar]
- de Lange H. Research into the dynamic nature of the human fovea-cortex systems with intermittent and modulated light. II. Phase shift in brithtness and delay in color perception. Journal of the Optical Society of America. 1958;48:784–789. doi: 10.1364/josa.48.000784. [DOI] [PubMed] [Google Scholar]
- Derrington AM, Badcock DR. The low level motion system has both chromatic and luminance inputs. Vision Research. 1985;25:1879–1884. doi: 10.1016/0042-6989(85)90011-2. [DOI] [PubMed] [Google Scholar]
- Derrington AM, Lennie P. The influence of temporal frequency and adaptation level on receptive field organization of retinal ganglion cells in cat. The Journal of Physiology. 1982;333:343–366. doi: 10.1113/jphysiol.1982.sp014457. [DOI] [PMC free article] [PubMed] [Google Scholar]
- Derrington AM, Lennie P. Spatial and temporal contrast sensitivities of neurones in lateral geniculate nucleus of macaque. The Journal of Physiology. 1984;357:219–240. doi: 10.1113/jphysiol.1984.sp015498. [DOI] [PMC free article] [PubMed] [Google Scholar]
- Dobkins KR, Albright TD. What happens if it changes color when it moves?: Psychophysical experiments on the nature of chromatic input to motion detectors. Vision Research. 1993;33:1019–1036. doi: 10.1016/0042-6989(93)90238-r. [DOI] [PubMed] [Google Scholar]
- Dobkins KR, Albright TD. What happens if it changes color when it moves?: The nature of chromatic input to visual area MT. Journal of Neuroscience. 1994;14:4854–4870. doi: 10.1523/JNEUROSCI.14-08-04854.1994. [DOI] [PMC free article] [PubMed] [Google Scholar]
- Enroth-Cugell C, Robson JG. The contrast sensitivity of retinal ganglion cells of the cat. The Journal of Physiology. 1966;187:517–552. doi: 10.1113/jphysiol.1966.sp008107. [DOI] [PMC free article] [PubMed] [Google Scholar]
- Estévez O, Spekreuse H. A spectral compensation method for determining the flicker characteristics of the human colour mechanisms. Vision Research. 1974;14:823–830. doi: 10.1016/0042-6989(74)90147-3. [DOI] [PubMed] [Google Scholar]
- Estévez O, Spekreijse H. The “silent substitution” method in visual research. Vision Research. 1982;22:681–691. doi: 10.1016/0042-6989(82)90104-3. [DOI] [PubMed] [Google Scholar]
- Frishman LJ, Freeman AW, Troy JB, Schweitzer-Tong DE, Enroth-Cugell C. Spatiotemporal frequency responses of cat retinal ganglion cells. Journal of General Physiology. 1987;89:599–628. doi: 10.1085/jgp.89.4.599. [DOI] [PMC free article] [PubMed] [Google Scholar]
- Hochstein S, Shapley RM. Quantitative analysis of retinal ganglion cell classifications. The Journal of Physiology. 1976;262:237–264. doi: 10.1113/jphysiol.1976.sp011594. [DOI] [PMC free article] [PubMed] [Google Scholar]
- Kaiser PK, Lee BB, Martin PR, Valberg A. The physiological basis of the minimally distinct border demonstrated in the ganglion cells of the macaque retina. The Journal of Physiology. 1990;422:153–183. doi: 10.1113/jphysiol.1990.sp017978. [DOI] [PMC free article] [PubMed] [Google Scholar]
- Lankheet MJ, van Wezel RJ, van de Grind WA. Light adaptation and frequency transfer properties of cat horizontal cells. Vision Research. 1991;31:1129–1142. doi: 10.1016/0042-6989(91)90039-8. [DOI] [PubMed] [Google Scholar]
- Lee BB. Neural models and physiological reality. Visual Neuroscience. 2008;25:231–241. doi: 10.1017/S0952523808080140. [DOI] [PMC free article] [PubMed] [Google Scholar]
- Lee BB, Martin PR, Valberg A. The physiological basis of heterochromatic flicker photometry demonstrated in the ganglion cells of the macaque retina. The Journal of Physiology. 1988;404:323–347. doi: 10.1113/jphysiol.1988.sp017292. [DOI] [PMC free article] [PubMed] [Google Scholar]
- Lee BB, Martin PR, Valberg A. Amplitude and phase of responses of macaque retinal ganglion cells to flickering stimuli. The Journal of Physiology. 1989a;414:245–263. doi: 10.1113/jphysiol.1989.sp017686. [DOI] [PMC free article] [PubMed] [Google Scholar]
- Lee BB, Martin PR, Valberg A. Nonlinear summation of M- and L-cone inputs to phasic retinal ganglion cells of the macaque. Journal of Neuroscience. 1989b;9:1433–1442. doi: 10.1523/JNEUROSCI.09-04-01433.1989. [DOI] [PMC free article] [PubMed] [Google Scholar]
- Lee BB, Martin PR, Valberg A. Sensitivity of macaque retinal ganglion cells to chromatic and luminance flicker. The Journal of Physiology. 1989c;414:223–243. doi: 10.1113/jphysiol.1989.sp017685. [DOI] [PMC free article] [PubMed] [Google Scholar]
- Lee BB, Pokorny J, Smith VC, Kremers J. Responses to pulses and sinusoids in macaque ganglion cells. Vision Research. 1994;34:3081–3096. doi: 10.1016/0042-6989(94)90074-4. [DOI] [PubMed] [Google Scholar]
- Lee BB, Pokorny J, Smith VC, Martin PR, Valberg A. Luminance and chromatic modulation sensitivity of macaque ganglion cells and human observers. Journal of the Optical Society of America A, Optics and Image Science. 1990;7:2223–2236. doi: 10.1364/josaa.7.002223. [DOI] [PubMed] [Google Scholar]
- Lee BB, Sun H. Chromatic input to cells of the magnocellular pathway: Mean chromaticity and the relative phase of modulated lights. Visual Neuroscience. 2004;21:309–314. doi: 10.1017/s0952523804213165. [DOI] [PubMed] [Google Scholar]
- Lee BB, Yeh T. Tritan pairs estimated by modulation photometry of red, green and blue lights. Proceedings of the International Research Group on Color Deficiency. 1994;14:177–184. [Google Scholar]
- McMahon MJ, Packer OS, Dacey DM. The classical receptive field surround of primate parasol ganglion cells is mediated primarily by a non-GABAergic pathway. Journal of Neuroscience. 2004;24:3736–3745. doi: 10.1523/JNEUROSCI.5252-03.2004. [DOI] [PMC free article] [PubMed] [Google Scholar]
- Mullen KT, Baker CL., Jr A motion aftereffect from an isoluminant stimulus. Vision Research. 1985;25:685–688. doi: 10.1016/0042-6989(85)90174-9. [DOI] [PubMed] [Google Scholar]
- Mullen KT, Yoshizawa T, Baker CL., Jr Luminance mechanisms mediate the motion of red-green isoluminant gratings: The role of “temporal chromatic aberration”. Vision Research. 2003;43:1235–1247. doi: 10.1016/s0042-6989(03)00115-9. [DOI] [PubMed] [Google Scholar]
- Schiller PH, Colby CL. The responses of single cells in the lateral geniculate nucleus of the rhesus monkey to color and luminance contrast. Vision Research. 1983;23:1631–1641. doi: 10.1016/0042-6989(83)90177-3. [DOI] [PubMed] [Google Scholar]
- Smith VC. Origin in the visual system of perceptually measured phase shifts. In: Valberg A, Lee BB, editors. From pigments to perception. London: Plenum Press; 1991. pp. 401–412. [Google Scholar]
- Smith VC, Lee BB, Pokorny J, Martin PR, Valberg A. Responses of macaque ganglion cells to the relative phase of heterochromatically modulated lights. The Journal of Physiology. 1992;458:191–221. doi: 10.1113/jphysiol.1992.sp019413. [DOI] [PMC free article] [PubMed] [Google Scholar]
- Smith VC, Pokorny J. Spectral sensitivity of the foveal cone photopigments between 400 and 500 nm. Vision Research. 1975;15:161–171. doi: 10.1016/0042-6989(75)90203-5. [DOI] [PubMed] [Google Scholar]
- Smith VC, Pokorny J, Lee BB, Dacey DM. Primate horizontal cell dynamics: An analysis of sensitivity regulation in the outer retina. Journal of Neurophysiology. 2001;85:545–558. doi: 10.1152/jn.2001.85.2.545. [DOI] [PubMed] [Google Scholar]
- Stromeyer CF, 3rd, Gowdy PD, Chaparro A, Kladakis S, Willen JD, Kronauer RE. Colour adaptation modifies the temporal properties of the long- and middle-wave cone signals in the human luminance mechanism. The Journal of Physiology. 2000;526:177–194. doi: 10.1111/j.1469-7793.2000.t01-1-00177.x. [DOI] [PMC free article] [PubMed] [Google Scholar]
- Sun H, Smithson HE, Zaidi Q, Lee BB. Specificity of cone inputs to macaque retinal ganglion cells. Journal of Neurophysiology. 2006;95:837–849. doi: 10.1152/jn.00714.2005. [DOI] [PMC free article] [PubMed] [Google Scholar]
- Swanson WH, Ueno T, Smith VC, Pokorny J. Temporal modulation sensitivity and pulse-detection thresholds for chromatic and luminance perturbations. Journal of the Optical Society of America A, Optics and Image Science. 1987;4:1992–2005. doi: 10.1364/josaa.4.001992. [DOI] [PubMed] [Google Scholar]
- Valberg A, Lee BB, Kaiser PK, Kremers J. Responses of macaque ganglion cells to movement of chromatic borders. The Journal of Physiology. 1992;458:579–602. doi: 10.1113/jphysiol.1992.sp019435. [DOI] [PMC free article] [PubMed] [Google Scholar]
- Westheimer G. The Maxwellian view. Vision Research. 1966;6:669–682. doi: 10.1016/0042-6989(66)90078-2. [DOI] [PubMed] [Google Scholar]
- White AJ, Sun H, Swanson WH, Lee BB. An examination of physiological mechanisms underlying the frequency-doubling illusion. Investigative Ophthalmology & Visual Science. 2002;43:3590–3599. [PubMed] [Google Scholar]
- Wiesel TN, Hubel DH. Spatial and chromatic interactions in the lateral geniculate body of the rhesus monkey. Journal of Neurophysiology. 1966;29:1115–1156. doi: 10.1152/jn.1966.29.6.1115. [DOI] [PubMed] [Google Scholar]
- Yoshizawa T, Mullen KT, Baker CL., Jr Failure of signed chromatic apparent motion with luminance masking. Vision Research. 2003;43:751–759. doi: 10.1016/s0042-6989(03)00016-6. [DOI] [PubMed] [Google Scholar]