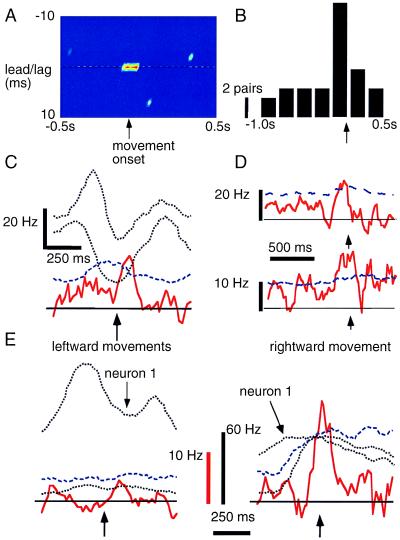
Figure 2.
Temporal modulation in synchrony over a trial. (A) A cross-correlogram between two single units. The x-axis represents time with respect to movement onset; the y-axis is lead/lag time in correlation; and color denotes the correlation strength (red is maximal and dark blue denotes nonsignificant values). Notice the transient increase in correlation around zero time lag (i.e., synchrony) at around movement onset. (B) Peaks in synchrony occur most often around the time of movement onset. This histogram (300 ms bin width) tabulates the times during the trial at which significant peaks in synchrony occurred with respect to movement onset (arrow). Significant peaks were defined as zero time lag correlation values (3 ms bin width) that crossed the upper bound of the 99% confidence limit. (C) Variations in synchrony are distinct from firing rate modulation. Sliding cross-correlation values (red line) at zero-time lag (i.e., synchrony) between two neurons are plotted along with their firing rates (black dotted lines) for movements to the left. The 99% confidence limit (dashed blue line) also is shown. Similar formats are used in D and E. (D) Different patterns of synchrony (red line) between one cell and two other simultaneously recorded neurons. Data from all 8 directions movement directions were pooled to compute cross correlations. (E) Pattern of synchrony across the trial varies with movement direction. Shown are synchrony values and firing rates between a given cell pair for leftward movements (Left side) and rightward movements (Right side). The red scale bar refers to synchrony magnitudes whereas the black bar refers to firing rates of the individual neurons. (C-E) Synchrony values are based on 3 ms bin widths and have been subtracted by the shift predictor. Vertical arrows indicate movement onset.

