Abstract
AIMS
The aim was to determine the pharmacokinetics of voriconazole after a single oral dose in comparison with intravenous (i.v.) administration in healthy individuals stratified according to the cytochrome P450 (CYP) 2C19 genotype. In addition, the possible metabolic pathways and their modulation according to CYP2C19 genotype were investigated after oral and i.v. administration of voriconazole.
METHODS
In a single-centre, open-label, two-period crossover study 20 participants received single doses of 400 mg voriconazole orally and 400 mg voriconazole intravenously in randomized order. Blood and urine samples were collected up to 96 h post dose and the voriconazole and three major metabolites were quantified by high-performance liquid chromatography coupled to mass spectroscopy.
RESULTS
Absolute oral bioavailability of voriconazole was 82.6% (74.1, 91.0). It ranged from 94.4% (78.8, 109.9) in CYP2C19 poor metabolizers to 75.2% (62.9, 87.4) in extensive metabolizers. In contrast to voriconazole and its N-oxide, the plasma concentrations of both hydroxylated metabolites showed a large second peak after 24 h. Independent of the route of administration, voriconazole partial metabolic hydroxylation after i.v. administration was eightfold higher compared with N-oxidation [48.8 ml min−1 (30.5, 67.1) vs. 6.1 ml min−1 (4.1, 8.0)]. The formation of the metabolites was related to CYP2C19 activity.
CONCLUSIONS
Independent of the route of administration, voriconazole exposure was three times higher in CYP2C19 poor metabolizers compared with extensive metabolizers. Voriconazole has a high bioavailability with no large differences between the CYP2C19 genotypes. The hydroxylation pathway of voriconazole elimination exceeded the N-oxidation, both influenced by the CYP2C19 genotype.
Keywords: bioavailability, CYP2C19, metabolism, pharmacokinetics, voriconazole
WHAT IS ALREADY KNOWN ABOUT THIS SUBJECT
Pharmacokinetic variability of voriconazole is largely caused by CYP3A4- and CYP2C19-mediated metabolism.
Oral bioavailability of voriconazole has been claimed to be almost 100%, thus facilitating a change from intravenous to oral application without dose adjustment.
WHAT THIS STUDY ADDS
For the first time voriconazole exposure after intravenous and oral administration in relation to CYP2C19 activity is reported.
In addition, the predominant metabolic pathway is the hydroxylation that seems to be influenced by the CYP2C19 genotype.
Enterohepatic circulation of both hydroxylated metabolites must be anticipated.
Introduction
Voriconazole is a new triazole antifungal agent, with potent activity against a broad spectrum of clinically significant pathogens, including invasive and pulmonary aspergillosis, invasive fluconazole-resistant candidiasis caused by Candida albicans, C. glabrata and C. krusei, and infections caused by emerging pathogens, such as Scedosporium and Fusarium spp. [1, 2].
According to in vitro studies, voriconazole is mainly primarily metabolized by CYP2C19 and CYP3A4 [3], with CYP2C19 contributing largely to the significant pharmacokinetic variability [4]. Because these enzymes are responsible for the main metabolic pathways of many drugs, there is a considerable potential for drug interactions, including both inhibition and induction of voriconazole metabolism by other drugs. Indeed, inhibition of voriconazole metabolism by omeprazole [1, 5] or ritonavir [6] and induction by phenytoin [7] or St John's wort [8] have been reported.
In addition, voriconazole pharmacokinetics are substantially influenced by the underlying CYP2C19 genotype [4, 5, 8, 9], which represents the most important known covariate determining exposure with voriconazole. Individuals may be classified as ‘poor’ (PM) or ‘extensive’ metabolizers (EM) on the basis of their ability to metabolize (S)-mephenytoin because the identity of the (S)-mephenytoin hydroxylase with cytochrome P450 2C19 has been demonstrated [10]. Most interindividual variation in the function of CYP2C19 is explained by the variant CYP2C19*2[11], but worldwide a number of other variants may have to be considered, in particular CYP2C19*3[12, 13]. A co-dominant mode of inheritance has been consistently seen, and thus heterozygous carriers of CYP2C19 have about half of the activity of the homozygous carriers. A promoter variant has been described recently, termed CYP2C19*17, resulting in very rapid metabolism [14]. In the Asian population there is a higher frequency of this trait (12–23%) than in Whites (1–6%) or Black Africans (1–7.5%) [15]. The clinical impact of CYP2C19 depends on whether the drugs are converted to active or inactive metabolites.
A reduction of voriconazole metabolic clearance in PMs of CYP2C19 is expected but has never been assessed. Data published to date indicate approximately threefold higher voriconazole area under the curve (AUC) or peak plasma concentration (Cmax) values in CYP2C19 PMs compared with homozygous EMs [9, 16].
In the overall voriconazole metabolism CYP3A4 plays a rather minor role, because the affinity of voriconazole to CYP3A4 is about 50-fold lower than to CYP2C19 [3].
Several studies have claimed that after oral administration voriconazole is rapidly and almost completely absorbed, thus allowing switching between intravenous (i.v.) and oral formulations without dose modification [17], but most of the study designs disregard the genetic variability of drug-metabolizing enzymes of the involved study population. We therefore investigated the absolute bioavailability of voriconazole after a 400 mg single oral and 400 mg i.v. administration in healthy individuals stratified according to the three predominant CYP2C19 genotypes. In addition, the N-oxidation and hydroxylation pathways of voriconazole metabolism (Figure 1) and their modulation according to genetic polymorphism of CYP2C19 were investigated.
Figure 1.
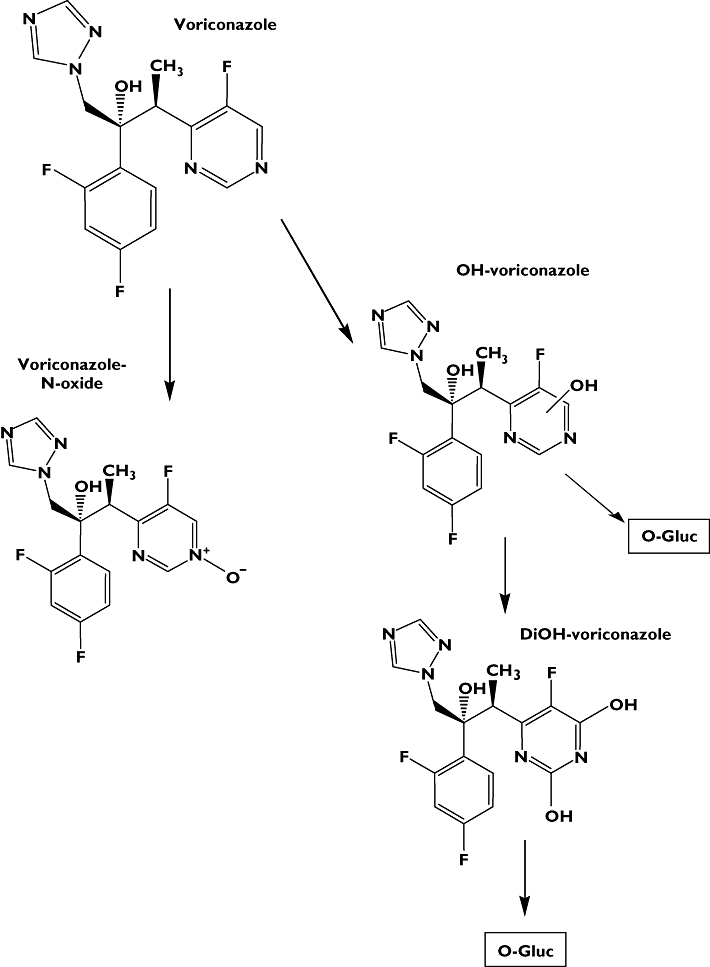
Metabolic pathways of voriconazole investigated in this study
Methods
The study protocol (EudraCT: 2005-001649-41) was approved by the Ethics Committee of the Medical Faculty of the University of Heidelberg (Germany) and was authorized by the competent authority (BfArM, Germany). The study was conducted at the Department of Internal Medicine VI, Clinical Pharmacology and Pharmacoepidemiology in accordance with the Declaration of Helsinki and subsequent amendments. Written informed consent was obtained from each participant before inclusion.
Study population
Twenty healthy participants consisting of 12 male and eight female non-smoking White individuals (age 20–38 years) were enrolled. All participants has been drug free for at least 6 weeks before entry into the study. They were ascertained to be healthy by clinical examination, electrocardiography and routine laboratory tests. Women were required to undergo pregnancy testing and were enrolled only if the result was negative and they were using a barrier contraceptive.
Study design
A single-centre, randomized, open, two-way, crossover study was carried out with single oral and i.v. doses of voriconazole. Polymorphisms of CYP2C19 were determined before study inclusion and finally participants were stratified according to each genetic group for a maximum of eight participants to each group:
group 1:CYP2C19*1/*1 (n= 8; EM)
group 2:CYP2C19*1/*2 or *1/*3[n= 8; heterozygous EM (HEM)]
group 3:CYP2C19*2/*2,*2/*3, or *3/*3 (n= 4; PM).
The presence of the CYP2C19*2 or *3 allele in the genomic DNA derived from leucocytes of the participants was determined by using the hybridization probes format (LightCycler CYP2C19 Mutation Detection Kit with specific primers) on a LightCycler™ (both obtained from Roche Applied Science, Mannheim, Germany). The presence of the wild-type allele CYP2C19*1 was inferred from the absence of the *2 and the *3 allele.
On study day 1 participants of group A received 400 mg voriconazole (two tablets VFEND®) together with 200 ml of water at approximately 08.00 h. Participants of study group B received a single 2 h infusion of 400 mg voriconazole at approximately 08.00 h. After a wash-out period of 14 days, all participants received voriconazole using the other route of administration. All participants had to fast from 12 h before until 4 h after the administration of voriconazole on study days 1 and 15. Alcoholic and caffeinated beverages were not allowed from 24 h before study day 1 until study day 5 and from 24 h before study day 15 until study day 19. During the whole study (days 1–19) beverages containing grapefruit juice were not allowed due to the known enzyme inhibition. The time of voriconazole ingestion or start of the infusion was defined as 0 h and 0 min, with reference to all previous and subsequent study times made relative to this time point. For safety reasons an ECG monitoring was carried out over 4 h after voriconazole administration using a Surveyor II monitoring system (Mortara Instruments, Essen, Germany). After 4 h all participants received a standard fat-free lunch. Participants stayed at the Clinical Research Unit of the Department for 10 h after drug administration. Ambulatory visits were performed on the following 4 days.
Blood samples after oral administration were taken before voriconazole, at 0.083, 0.167, 0.250, 0.333, 0.417, 0.5, 0.583, 0.667, 0.833, 1, 1.167, 1.333, 1.5, 1.667, 1.833, 2, 2.25, 2.5, 3, 4, 6, 8, 10, 24, 25, 33, 48, 72 and 96 h after drug administration. After i.v. administration samples were drawn immediately before start of the infusion, at 0.083, 0.167, 0.25, 0.333, 0.417, 0.5, 0.583, 0.667, 0.833, 1, 1.167, 1.333, 1.5, 1.667, 1.833 and 2 h during the infusion, and at 2.083, 2.167, 2.25, 2.333, 2.5, 3, 4, 6, 8, 10, 24, 25, 33, 48, 72 and 96 h. Blood samples were immediately centrifuged at 4°C and separated plasma was stored at −20°C until analysis. The participants collected their entire urine from 0 to 24 h, from 24 to 48 h, from 48 to 72 h, and from 72 to 96 h after voriconazole administration. A 10 ml aliquot of each was kept frozen at −20°C until analysis.
Quantification of voriconazole and metabolites
Concentrations of voriconazole, voriconazole-N-oxide, hydroxyvoriconazole (OH-voriconazole) and dihydroxyvoriconazole (DiOH-voriconazole) in plasma and urine were determined after solid-phase extraction on the basis of a high-performance liquid chromatography assay [18] and optimized by using mass-spectrometric detection (LC/MS/MS) [8]. The limit of quantification was 0.05 µg ml−1 for voriconazole and its three main metabolites and the calibration ranged from 0.05 to 10.0 µg ml−1 with coefficients of variation always <10%.
Calculations and statistics
Data are presented as mean values and 95% confidence interval. Noncompartmental analysis using WinNonlin 5.2 (Pharsight Corp., Mountain View, CA, USA) was performed to determine the following pharmacokinetic parameters of voriconazole: maximum observed plasma concentration (Cmax), time to reach Cmax (Tmax), area under the plasma concentration–time curve from time zero to the last measurable concentration (AUC), the terminal elimination half-life (t1/2) and total clearance (CLtot) and apparent oral clearance (CLoral). Using the amount of voriconazole and metabolites excreted into the urine (Ae) over 4 days, renal clearance (CLR) was determined as amount excreted in urine (0–96 h) divided by the corresponding AUC values. Partial metabolic clearances were calculated for both the N-oxidation and the hydroxylation pathways (CLmet N-oxide; CLmet OH) after hydroxylation of the urine samples as the amount excreted of metabolite divided by AUC of voriconazole.
To compare the pharmacokinetic parameters between oral and i.v. application, Wilcoxon matched pairs signed rank test (Instat 3.0; GraphPad Software, La Jolla, CA, USA) was used. To test for differences between the three CYP2C19 genotypes Kruskal–Wallis test with Dunn's post hoc test was applied. P-values ≤ 0.05 were regarded as statistically significant.
Results
Clinical safety
Voriconazole was generally well tolerated; all participants completed the study and no serious adverse events were observed. Headache and transient enhanced light perceptions in the first hour after voriconazole application were the most frequently reported adverse events. In our study we could not distinguish between the different genotypes according to the frequency of adverse reactions.
Pharmacokinetics and metabolism
After oral administration of voriconazole, maximum plasma concentrations Cmax of 9.3 ± 3.2 nmol ml−1 were observed after 1.5 h. After parenteral application Cmax was 12.1 ± 2.3 nmol ml−1 at the end of the 2-h infusion period. The plasma concentration–time curves of voriconazole after oral and i.v. dosing are shown in Figure 2. Terminal elimination half-life was not different between p.o. and i.v. application (8.71 h vs. 8.57 h; P > 0.05). The absolute bioavailability of voriconazole was 82.6% (74.1, 91.0). Renal clearance of voriconazole was small, with no differences between the application forms (1.90 ml min−1 after i.v. vs. 1.56 ml min−1 oral dosing). Concentrations of voriconazole-N-oxide after i.v. and oral administration of voriconazole were similar (Figure 3), but lower than voriconazole concentrations itself. The plasma concentrations of both hydroxylated metabolites were much lower than the voriconazole concentrations and showed a large second peak approximately 24 h after voriconazole dosing (Figure 4). Irrespective of the route of administration, voriconazole partial metabolic clearance was about eightfold higher via the hydroxylation pathway compared with N-oxidation [48.8 ml min−1 (30.5, 67.1) vs. 6.1 ml min−1 (4.1–8.0)].
Figure 2.
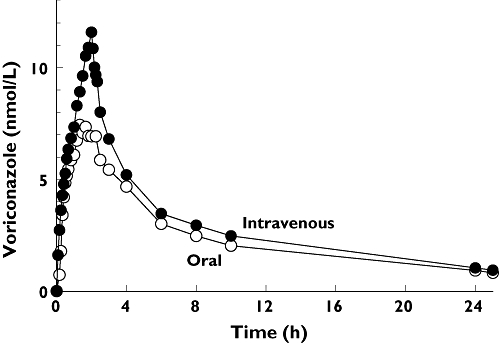
Mean plasma concentration–time profile of voriconazole after oral and intravenous administration of a single 400 mg dose to 20 healthy participants
Figure 3.
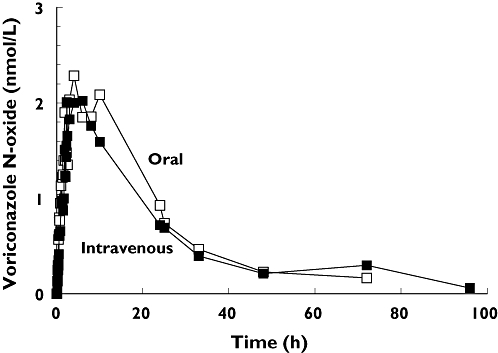
Mean plasma concentration–time profile of the metabolite voriconazole-N-oxide after oral and intravenous administration of a single 400 mg dose of voriconazole to 20 healthy participants
Figure 4.
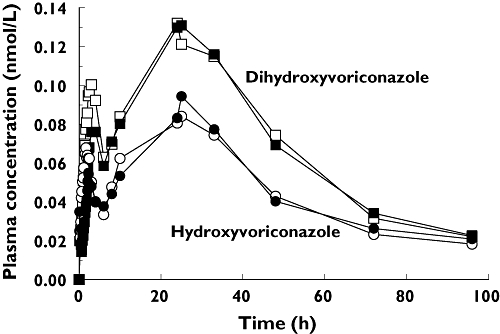
Mean plasma concentration–time profile of the metabolites OH-voriconazole and DiOH-voriconazole after oral (open symbols) and intravenous (closed symbols) administration of a single 400 mg dose of voriconazole to 20 healthy participants
CYP2C19 genotype effects on pharmacokinetics and metabolism
When analysing the pharmacokinetics according to the different CYP2C19 genotypes, the AUC of voriconazole was nearly three times higher in the CYP2C19 PM group, and about two times higher in the CYP2C19 HEM group in comparison with the CYP2C19 EM group regardless of the route of administration. Other parameters analysed are shown in Table 1. The absolute bioavailability of voriconazole was assessed for each CYP2C19 genotype separately showing a relationship, with PMs having the highest bioavailability [94.4% (78.8, 109.9)] and EMs the lowest with 75.2% (62.9, 87.4) (Figure 5). These differences were not statistically significant.
Table 1.
Pharmacokinetic parameters of voriconazole and voriconazole-N-oxide after oral and intravenous administration of a single 400 mg dose of voriconazole to 20 healthy participants; the data are sorted according to the CYP2C19 genotypes
| VRC | VRC | N-oxid | N-oxid | ||||||
|---|---|---|---|---|---|---|---|---|---|
| i.v. | Oral | i.v. | Oral | ||||||
| Mean | SD | Mean | SD | Mean | SD | Mean | SD | ||
| EM | n= 8 | ||||||||
| Cmax | nmol ml−1 | 11.6 | 3.1 | 8.3 | 3.1 | 3.2 | 1.3 | 3.9 | 1.7 |
| Tmax | h | 2.0 | 0.1 | 1.4 | 0.6 | 3.4 | 2.8 | 6.1 | 3.3 |
| t1/2 | h | 7.8 | 1.4 | 7.5 | 1.2 | 8.8 | 2.7 | 6.3 | 1.0 |
| AUC | h nmol−1 ml−1 | 53.7 | 22.5 | 38.8 | 12.8 | 47.8 | 21.3 | 56.4 | 24.4 |
| CL | ml min−1 | 420 | 221 | 572 | 352 | ||||
| MRT | h | 6.5 | 1.5 | 7.9 | 1.3 | 14.8 | 2.6 | 12.9 | 1.5 |
| F | % | 75.2 | 14.7 | 125 | 33.6 | ||||
| HEM | n= 8 | ||||||||
| Cmax | nmol ml−1 | 12.4 | 1.5 | 9.4 | 2.8 | 2.4 | 0.9 | 2.4 | 1.2 |
| Tmax | h | 2.0 | 0.2 | 1.6 | 0.6 | 4.6 | 1.6 | 4.4 | 3.7 |
| t1/2 | h | 9.0 | 4.0 | 9.5 | 5.0 | 13.7 | 5.5 | 10.4 | 6.3 |
| AUC | h nmol−1 ml−1 | 107a | 46.7 | 88.6a | 40.5 | 38.9 | 17.1 | 14.5 | 19.8 |
| CL | ml min−1 | 194a | 56.0 | 241a | 82.1 | ||||
| MRT | H | 12.6a | 8.0 | 14.2 | 9.9 | 25.6a | 10.6 | 20.4 | 8.2 |
| F | % | 84.1 | 21.9 | 126 | 52.8 | ||||
| PM | n= 4 | ||||||||
| Cmax | nmol ml−1 | 12.3 | 2.6 | 11.2 | 4.0 | 3.0 | 1.4 | 2.8 | 1.5 |
| Tmax | h | 1.9 | 0.2 | 1.6 | 1.7 | 4.2 | 2.1 | 2.7 | 1.1 |
| t1/2 | h | 9.4 | 1.6 | 9.6 | 2.3 | 16.9 | 13.3 | 15.0b | 9.3 |
| AUC | h nmol−1 ml−1 | 127b | 21.7 | 119b | 13.8 | 13.8 | 20.3 | 38.8 | 15.2 |
| CL | ml min−1 | 149b | 28.3 | 157b | 18.8 | ||||
| MRT | h | 14.1b | 1.5 | 16.1b | 3.4 | 26.6 | 15.7 | 23.2b | 10.5 |
| F | % | 94.4 | 9.8 | 120 | 56.8 | ||||
*1/*1 vs.*1/*2 P < 0.05.
*1/*1 vs.*2/*2 P < 0.05. VRC, voriconazole; EM, extensive metabolizers; MRT, mean residence time; HEM, heterozygous extensive metabolizer; PM, poor metabolizers.
Figure 5.
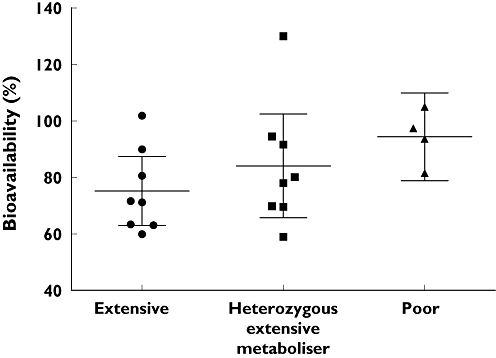
Absolute voriconazole bioavailability (mean and 95% confidence interval) for the three CYP2C19 genotypes. No significant differences between the genotypes (Kruskal–Wallis test with Dunn's multiple comparisons test)
Large interindividual differences were seen in voriconazole-N-oxide pharmacokinetics after both i.v. and oral application of voriconazole. However, only small differences were observed between the CYP2C19 genotypes for t1/2 and mean residence time. The detailed pharmacokinetic parameters are given in Table 1. Table 2 shows the derived pharmacokinetic parameter for both hydroxylated voriconazole metabolites grouped according to the three CYP2C19 genotypes. No significant differences were observed between the genotypes.
Table 2.
Pharmacokinetic parameters of OH-voriconazole and DiOH-voriconazole after oral and intravenous administration of a single 400 mg dose of voriconazole to 20 healthy participants; the data are sorted according to the CYP2C19 genotypes
| OH-VRZ | OH-VRZ | DiOH-VRC | DiOH-VRZ | ||||||
|---|---|---|---|---|---|---|---|---|---|
| i.v | Oral | i.v. | Oral | ||||||
| Mean | SD | Mean | SD | Mean | SD | Mean | SD | ||
| EM | n= 8 | ||||||||
| Cmax | nmol ml−1 | 0.1 | 0.1 | 0.1 | 0.1 | 0.2 | 0.1 | 0.2 | 0.1 |
| Tmax | h | 27.8 | 4.4 | 15.3 | 12.8 | 27.8 | 4.4 | 23.5 | 6.3 |
| t1/2 | h | 14.3 | 6.4 | 31.6 | 35.5 | 17.5 | 5.5 | 25.8 | 25.1 |
| AUC | h nmol−1 ml−1 | 3.5 | 1.0 | 3.4 | 1.3 | 5.6 | 1.4 | 6.4 | 2.1 |
| MRT | h | 33.7 | 7.9 | 55.4 | 48.6 | 38.7 | 8.0 | 48.5 | 35.9 |
| F | % | 95.0 | 18.2 | 113 | 23.6 | ||||
| HEM | n= 8 | ||||||||
| Cmax | nmol ml−1 | 0.1a | 0.04 | 0.1 | 0.03 | 0.1 | 0.07 | 0.1 | 0.04 |
| Tmax | h | 24.0 | 9.6 | 23.0 | 13.6 | 25.8 | 8.3 | 18.4 | 13.5 |
| t1/2 | h | 22.1 | 8.8 | 22.3 | 7.8 | 28.0 | 11.3 | 24.5 | 12.0 |
| AUC | h nmol−1 ml−1 | 2.9 | 1.2 | 3.0 | 0.7 | 5.3 | 2.4 | 5.0 | 0.9 |
| MRT | h | 42.7 | 13.9 | 44.2 | 12.9 | 50.7 | 14.7 | 47.6 | 15.6 |
| F | % | 107 | 23.0 | 113 | 59.5 | ||||
| PM | n= 4 | ||||||||
| Cmax | nmol ml−1 | 0.1 | 0.02 | 0.1 | 0.03 | 0.1 | 0.1 | 0.1 | 0.1 |
| Tmax | h | 21.3 | 13.2 | 15.8 | 15.6 | 23.4 | 14.4 | 16.1 | 15.3 |
| t1/2 | h | 19.5 | 3.0 | 28.9 | 12.2 | 16.8 | 1.1 | 25.9 | 10.1 |
| AUC | h nmol−1 ml−1 | 2.9 | 1.4 | 3.4 | 1.2 | 6.4 | 2.5 | 5.9 | 2.8 |
| MRT | h | 40.3 | 3.1 | 52.7 | 18.2 | 37.7 | 2.6 | 49.2 | 13.3 |
| F | % | 127 | 30.3 | 91.3 | 8.9 | ||||
*1/*1 vs.*1/*2 P < 0.05. EM, extensive metabolizers; MRT, mean residence time; HEM, heterozygous extensive metabolizer; PM, poor metabolizers.
Urinary excretion of voriconazole and its three major metabolites before and after hydrolysis is shown in Table 3. After oral and parenteral administration the main metabolite detected in urine was DiOH-voriconazole (and its conjugate) amounting to on average 13% of the administered voriconazole dose.
Table 3.
Amount of voriconazole and its metabolites excreted in urine over 96 h after oral and intravenous administration of a single 400 mg (= 1.145 mmol) dose of voriconazole to 20 healthy participants; the data are sorted according to the CYP2C19 genotypes
| Before hydrolysis | After hydrolysis | |||||||
|---|---|---|---|---|---|---|---|---|
| i.v. (µmol) | Oral (µmol) | i.v. (µmol) | Oral (µmol) | |||||
| Mean | SD | Mean | SD | Mean | SD | Mean | SD | |
| EM (n= 8) | ||||||||
| Voriconazole | 6.7 | 3.8 | 4.4 | 2.6 | 9.8 | 3.8 | 6.8 | 3.7 |
| Voriconazole-N-oxide | 14.7 | 8.8 | 17.3 | 8.1 | 24.1 | 7.5 | 23.1 | 7.9 |
| OH-voriconazole | 29.1 | 10.4 | 34.3 | 10.6 | 38.9 | 19.2 | 40.9 | 12.9 |
| DiOH-voriconazole | 132 | 53.1 | 128 | 43.7 | 144 | 51.6 | 133 | 50.1 |
| HEM (n= 8) | ||||||||
| Voriconazole | 10.7 | 3.7 | 6.5 | 2.3 | 16.8a | 4.5 | 12.1 | 5.6 |
| Voriconazole-N-oxide | 20.5 | 6.8 | 27.1 | 10.8 | 26.3 | 10.2 | 25.8 | 8.7 |
| OH-voriconazole | 43.8 | 16.3 | 45.0 | 19.1 | 63.8a | 19.1 | 61.0a | 17.0 |
| DiOH-voriconazole | 134 | 43.5 | 142 | 39.5 | 148 | 65.6 | 156 | 52.9 |
| PM (n= 4) | ||||||||
| Voriconazole | 10.7 | 2.3 | 9.0b | 2.7 | 18.2b | 2.8 | 17.6b | 4.3 |
| Voriconazole-N-oxide | 20.6 | 6.0 | 22.1 | 3.2 | 27.6 | 8.9 | 31.0 | 11.8 |
| OH-voriconazole | 50.5b | 13.8 | 60.2b | 19.5 | 38.9 | 9.6 | 42.7 | 9.9 |
| DiOH-voriconazole | 158 | 47.1 | 165 | 54.5 | 158 | 56.2 | 172 | 61.3 |
*1/*1 vs.*1/*2 P < 0.05.
*1/*1 vs.*2/*2 P < 0.05. EM, extensive metabolizers; HEM, heterozygous extensive metabolizer; PM, poor metabolizers.
Both the total (i.v.) and apparent oral clearance showed a clear CYP2C19 genotype dependency (Figure 6, Table 1), with PM subjects having three to four times lower clearances compared with CYP2C19 EMs. Renal clearance of voriconazole was small (always <4 ml min−1) and showed no differences between the genotypes. Both hydroxylated metabolites had substantially higher renal clearances than voriconazole and exceeded glomerular filtration rate (Table 4). The partial metabolic clearance of voriconazole to its N-oxide was independent of the route of administration and was decreased by half if a nonfunctional CYP2C19 allele was present (Figure 7). The partial metabolic clearance via hydroxylation was up to eightfold higher than via N-oxidation and was also decreased in CYP2C19 PM subjects (Figure 8, Table 4).
Figure 6.
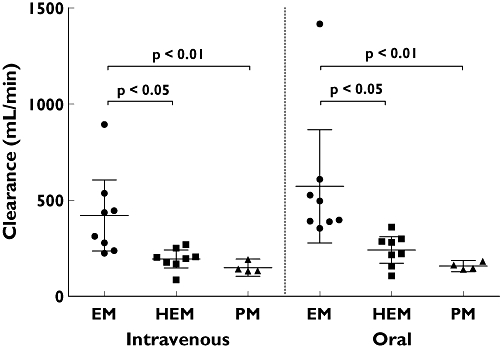
Total (intravenous) and apparent oral clearance (mean and 95% confidence interval) of voriconazole after oral and intravenous administration of a single 400 mg dose to 20 healthy participants. CYP2C19 genotype differences have been assessed by the Kruskal–Wallis test with Dunn's multiple comparisons test
Table 4.
Renal clearances of voriconazole and its metabolites and partial metabolic clearances of voriconazole (N-oxide and hydroxylation) after oral and intravenous administration of a single 400 mg dose of voriconazole to 20 healthy participants; the data are sorted according to the CYP2C19 genotypes
| CLR (ml min−1) | CLR (ml min−1) | CLR (ml min−1) | CLR (ml min−1) | |||||
|---|---|---|---|---|---|---|---|---|
| i.v. | Oral | i.v. | Oral | |||||
| Mean | SD | Mean | SD | Mean | SD | Mean | SD | |
| EM (n= 8) | ||||||||
| Voriconazole | 2.3 | 1.3 | 1.9 | 0.8 | ||||
| Voriconazole-N-oxide | 6.4 | 5.0 | 5.5 | 2.4 | 9.0 | 5.2 | 11.4 | 6.1 |
| OH-voriconazole | 145 | 54.5 | 186 | 75.3 | 72.8 | 52.5 | 99.0 | 96.7 |
| DiOH-voriconazole | 392 | 133 | 376 | 183 | ||||
| HEM (n = 8) | ||||||||
| Voriconazole | 1.8 | 0.6 | 1.4 | 0.7 | ||||
| Voriconazole-N-oxide | 11.4 | 8.3 | 12.6a | 8.8 | 4.3a | 1.4 | 5.3a | 2.2 |
| OH-voriconazole | 265a | 96.7 | 270 | 126 | 36.0 | 15.1 | 47.9 | 23.8 |
| DiOH-voriconazole | 462 | 165 | 480 | 160 | ||||
| PM (n = 4) | ||||||||
| Voriconazole | 1.4 | 0.4 | 1.3 | 0.4 | ||||
| Voriconazole-N-oxide | 11.4 | 5.5 | 10.9 | 5.1 | 3.7 | 1.5 | 4.5 | 2.1 |
| OH-voriconazole | 372b | 264 | 306 | 70.7 | 26.1 | 8.4 | 29.6b | 7.0 |
| DiOH-voriconazole | 435 | 106 | 493 | 123 | ||||
*1/*1 vs.*1/*2 P < 0.05.
*1/*1 vs.*2/*2 P < 0.05. EM, extensive metabolizers; HEM, heterozygous extensive metabolizer; PM, poor metabolizers.
Figure 7.
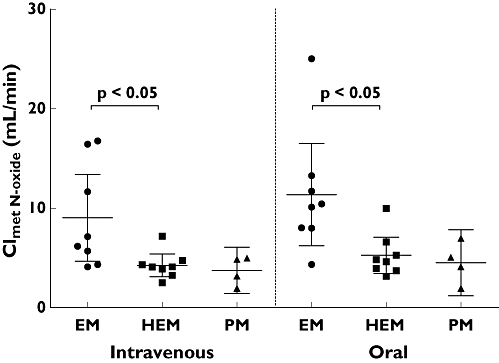
Partial metabolic clearance of voriconazole to voriconazole-N-oxide (mean and 95% confidence interval) after oral and intravenous administration of a single 400 mg dose of voriconazole to 20 healthy participants. CYP2C19 genotype differences have been assessed by the Kruskal–Wallis test with Dunn's multiple comparisons test
Figure 8.
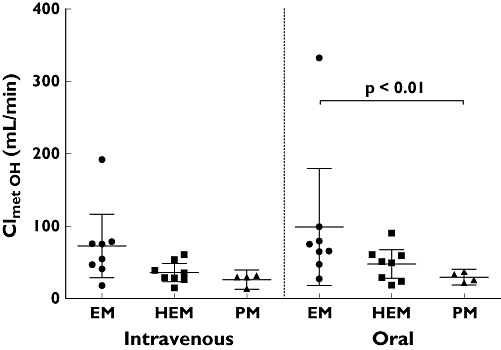
Partial metabolic clearance of voriconazole via the hydroxylation pathway (OH- and DiOH-voriconazole) (mean and 95% confidence interval) after oral and intravenous administration of a single 400 mg dose of voriconazole to 20 healthy participants. CYP2C19 genotype differences have been assessed by the Kruskal–Wallis test with Dunn's multiple comparisons test
Discussion
After a single oral dose of 400 mg voriconazole the absolute bioavailability was high (82.6%), indicating almost complete absorption of the oral preparation. This is in the range of the previously known high bioavailability of 95% reported by Pfizer [17]. There was no significant CYP2C19 genotype effect on bioavailability; however, PMs lacking CYP2C19 showed the highest bioavailability with 94.4%, and EMs the lowest bioavailability with 75.2%. Although this is not a large difference in the absolute bioavailability (also not significantly dependent on the CYP2C19 genotype), it is likely that these effects can be attributed to the lack of CYP2C19 expression in PM subjects in the gut wall resulting in reduced first-pass metabolism as an underlying mechanism [19]. With the high bioavailability in PMs of CYP2C19 in this study, the contribution of CYP3A4 to first-pass metabolism of voriconazole can almost be excluded. However, this finding is limited by the fact that only four CYP2C19 PMs were studied in this study.
For the first time the CYP2C19-dependent exposure after i.v. administration of voriconazole is reported. The almost threefold higher exposure with voriconazole in PM participants compared with EM is similar to the previously reported differences observed after oral administration [3, 4, 6, 9]. To switch from the i.v. to oral route of administration without dose adjustment is possible in general due to the high bioavailability of all CYP2C19 genotypes. However, given the interindividual differences in bioavailability within the CYP2C19 genotype groups, a dose adjustment might be necessary in CYP2C19 EMs and HEMs with a very low bioavailability. More importantly, voriconazole doses would have to be modified or adjusted according to the CYP2C19 genotype to yield similar voriconazole exposure in individuals with all CYP2C19 genotypes. Consequently, therapeutic drug monitoring might be helpful in clinical settings in which targeted voriconazole exposure is required.
Of the three metabolites quantified in this study, voriconazole-N-oxide showed the highest plasma concentrations, suggesting N-oxidation to be an important elimination pathway. However, when partial metabolic clearances of voriconazole to its N-oxide and the hydroxylated metabolites were determined, hydroxylation to mono- and dihydroxy-voriconazole was up to eightfold higher than N-oxidation. Importantly, this is independent of the route of administration, suggesting that the liver is the main organ of metabolic elimination. It has been claimed that voriconazole-N-oxide is the major metabolite of voriconazole [17, 20], although the original publication found only voriconazole-N-oxide being the major ‘circulating’ metabolite [20].
The metabolic pathways of voriconazole in humans and animals were previously described under steady-state conditions with dosing of 200 mg twice daily [20]. About 78% of the dose was excreted in urine over 5 days and about 23% was faecally eliminated. Only 2% of unchanged voriconazole was excreted in urine. N-oxidation and further metabolism yielded 31% of the dose with the N-oxide itself representing 21%. Hydroxylation to OH- and DiOH-voriconazole and the conjugate of OH-voriconazole accounted for 12%, 9% and 16%, respectively [20]. After single-dose administration of 400 mg voriconazole (i.v. and oral), we collected urine during 96 h after drug administration and on average only 20% of the dose was recovered in urine as voriconazole and its three quantified metabolites (+ conjugates). This might be a result of the single-dose administration and the long half-life of the metabolites, which then will accumulate during steady-state conditions. The major metabolite observed in urine in our study was DiOH-voriconazole, accounting on average for 13% of the administered dose of voriconazole, which is in the range reported by Roffey et al.[20]. No conjugated DiOH-voriconazole was formed, which is also in agreement with previous data [20]. For the monohydroxylated voriconazole and its conjugate, we observed only 3.5% and 1% excreted in urine. This is in contrast to the results where 12% and 16% were reported [20]. The amounts excreted in urine of voriconazole-N-oxide showed similar discrepancies from the literature, with 2.3% of the dose found in our study and 21% reported elsewhere [20]. A possible explanation might be an induction of both pathways during steady-state; however, this auto-induction was previously excluded in humans [20]. Both N-oxidation and hydroxylation pathways (partial metabolic clearance) showed considerable interindividual variability.
Both hydroxylated voriconazole metabolites showed unusual plasma concentration–time profiles, with a late second peak that occurred in every study participant irrespective of the route of administration. An analytical artefact can be excluded because all four analytes were quantified within the same analytical run. Enterohepatic circulation is a possible and likely explanation for this phenomenon, but due to the lack of concentrations between 10 and 24 h after voriconazole administration no valid interpretation can be offered. There are also no published data on these two metabolites in plasma; a comparison is therefore not possible. Furthermore, these data show the importance of obtaining blood samples over a time period which is sufficiently long (at least five half-lives). The second peak seems to indicate that these hydroxylated compounds will accumulate to a higher extent than previously anticipated during repeated administration. In addition, no data are available on the pharmacological activity of the hydroxylated metabolites and whether they contribute to the antifungal activity or adverse effects of voriconazole.
In this study the participants were stratified according to their CYP2C19 genotype. Recently, a new allele CYP2C19*17 was reported to be associated with higher activity than the wild-type allele. In presence of the CYP2C19*17 allele, reduced Cmax concentrations of voriconazole were observed [4]. We have reassessed the CYP2C19 alleles of the study participants using a method described elsewhere [4] and found six of the eight participants of the EM group to be CYP2C19*1/*17 and only two homozygous wild-type. Two of the heterozygous EM group were found to be CYP2C19*2/*17. The *17 allele was not found in the four PMs. With these limited data no valid conclusion about the influence of the *17 allele can be drawn. We have therefore decided to keep the original genotype grouping for the presentation and interpretation of the results.
In conclusion, voriconazole has a high bioavailability with no large differences between the CYP2C19 genotypes. However, voriconazole exposure in PMs was three times higher compared with EMs. The hydroxylation pathway of voriconazole elimination exceeded the N-oxidation, and both seem to be influenced by the CYP2C19 genotype. Both hydroxylated metabolites are likely to undergo enterohepatic circulation.
Competing interests
The Department of Internal Medicine VI, Clinical Pharmacology and Pharmacoepidemiology has received a grant from Pfizer, Germany to establish and make available a high-performance liquid chromatography method for the determination of voriconazole in plasma which is validated according to Food and Drug Administration standards. G.M. has received speaking fees from Pfizer, Germany. None of the authors has financial or personal relationships that could potentially be perceived as influencing the research described herein.
REFERENCES
- 1.Fachinformation VFEND. FachInfo. Fachinformationsverzeichnis. Deutschland Ausgabe 2008/6: BPI Service Gmbh.
- 2.Ghannoum MA, Kuhn DM. Voriconazole – better chances for patients with invasive mycoses. Eur J Med Res. 2002;7:242–56. [PubMed] [Google Scholar]
- 3.Hyland R, Jones BC, Smith DA. Identification of the cytochrome P450 enzymes involved in the N-oxidation of voriconazole. Drug Metab Dispos. 2003;31:540–7. doi: 10.1124/dmd.31.5.540. [DOI] [PubMed] [Google Scholar]
- 4.Weiss J, ten Hoevel MM, Burhenne J, Walter-Sack I, Hoffmann MM, Rengelshausen J, Haefeli WE, Mikus G. CYP2C19 genotype is a major factor contributing to the highly variably pharmacokinetics of voriconazole. J Clin Pharmacol. 2009;49:196–204. doi: 10.1177/0091270008327537. [DOI] [PubMed] [Google Scholar]
- 5.Wood N, Tan K, Purkins L, Layton G, Hamlin J, Kleinermans D, Nichols D. Effect of omeprazole on the steady-state pharmacokinetics of voriconazole. Br J Clin Pharmacol. 2003;56(Suppl. 1):56–61. doi: 10.1046/j.1365-2125.2003.02000.x. [DOI] [PMC free article] [PubMed] [Google Scholar]
- 6.Mikus G, Schöwel V, Drzewinska M, Rengelshausen J, Ding R, Riedel K-D, Burhenne J, Weiss J, Thomsen T, Haefeli W. Potent cytochrome P450 2C19 genotype-related interaction between voriconazole and the cytochrome P450 3A4 inhibitor ritonavir. Clin Pharmacol Ther. 2006;80:126–35. doi: 10.1016/j.clpt.2006.04.004. [DOI] [PubMed] [Google Scholar]
- 7.Purkins L, Wood N, Ghahramani P, Love ER, Eve MD, Fielding A. Coadministration of voriconazole and phenytoin: pharmacokinetic interaction, safety, and toleration. Br J Clin Pharmacol. 2003;56(Suppl. 1):37–44. doi: 10.1046/j.1365-2125.2003.01997.x. [DOI] [PMC free article] [PubMed] [Google Scholar]
- 8.Rengelshausen J, Banfield M, Riedel K-D, Burhenne J, Weiss J, Thomsen T, Walter-Sack I, Haefeli WE, Mikus G. Opposite effects of short-term and long-term St John's wort intake on voriconazole pharmacokinetics. Clin Pharmacol Ther. 2005;78:25–33. doi: 10.1016/j.clpt.2005.01.024. [DOI] [PubMed] [Google Scholar]
- 9.Ikeda Y, Umemura K, Kondo K, Sekiguchi K, Miyoshi S, Nakashima M. Pharmacokinetics of voriconazole and cytochrome P450 2C19 genetic status. Clin Pharmacol Ther. 2004;75:587–8. doi: 10.1016/j.clpt.2004.02.002. [DOI] [PubMed] [Google Scholar]
- 10.Goldstein JA, Faletto MB, Romkes-Sparks M, Sullivan T, Kitareewan S, Raucy JL, Lasker JM, Ghanayem BI. Evidence that CYP2C19 is the major (S)-mephenytoin 4’-hydroxylase in humans. Biochemistry. 1994;33:1743–52. doi: 10.1021/bi00173a017. [DOI] [PubMed] [Google Scholar]
- 11.de Morais SM, Wilkinson GR, Blaisdell J, Nakamura K, Meyer UA, Goldstein JA. The major genetic defect responsible for the polymorphism of S-mephenytoin metabolism in humans. J Biol Chem. 1994;269:15419–22. [PubMed] [Google Scholar]
- 12.de Morais SM, Wilkinson GR, Blaisdell J, Meyer UA, Nakamura K, Goldstein JA. Identification of a new genetic defect responsible for the polymorphism of (S)-mephenytoin metabolism in Japanese. Mol Pharmacol. 1994;46:594–8. [PubMed] [Google Scholar]
- 13.Goldstein JA, Ishizaki T, Chiba K, de Morais SM, Bell D, Krahn PM, Evans DA. Frequencies of the defective CYP2C19 alleles responsible for the mephenytoin poor metabolizer phenotype in various Oriental, Caucasian, Saudi Arabian and American black populations. Pharmacogenetics. 1997;7:59–64. doi: 10.1097/00008571-199702000-00008. [DOI] [PubMed] [Google Scholar]
- 14.Sim SC, Risinger C, Dahl ML, Aklillu E, Christensen M, Bertilsson L, Ingelman-Sundberg M. A common novel CYP2C19 gene variant causes ultrarapid drug metabolism relevant for the drug response to proton pump inhibitors and antidepressants. Clin Pharmacol Ther. 2006;79:103–13. doi: 10.1016/j.clpt.2005.10.002. [DOI] [PubMed] [Google Scholar]
- 15.Xie HG, Huang SL, Xu ZH, Xiao ZS, He N, Zhou HH. Evidence for the effect of gender on activity of (S)-mephenytoin 4’-hydroxylase (CYP2C19) in a Chinese population. Pharmacogenetics. 1997;7:115–9. doi: 10.1097/00008571-199704000-00004. [DOI] [PubMed] [Google Scholar]
- 16.Purkins L, Wood N, Ghahramani P, Kleinermans D, Layton G, Nichols D. No clinically significant effect of erythromycin or azithromycin on the pharmacokinetics of voriconazole in healthy male volunteers. Br J Clin Pharmacol. 2003;56(Suppl. 1):30–6. doi: 10.1046/j.1365-2125.2003.01996.x. [DOI] [PMC free article] [PubMed] [Google Scholar]
- 17.Briefing document for voriconazole (oral and intravenous formulations) FDA Antiviral Drugs Advisory Committee Available at http://www.fda.gov/ohrms/dockets/AC/01/briefing/3792b2_01_Pfizer.pdf (last accessed September 2009)
- 18.Pennick GJ, Clark M, Sutton DA, Rinaldi MG. Development and validation of a high-performance liquid chromatography assay for voriconazole. Antimicrob Agents Chemother. 2003;47:2348–50. doi: 10.1128/AAC.47.7.2348-2350.2003. [DOI] [PMC free article] [PubMed] [Google Scholar]
- 19.Obach RS, Zhang QY, Dunbar D, Kaminsky LS. Metabolic characterization of the major human small intestinal cytochrome p450s. Drug Metab Dispos. 2001;29:347–52. [PubMed] [Google Scholar]
- 20.Roffey SJ, Cole S, Comby P, Gibson D, Jezequel SG, Nedderman AN, Smith DA, Walker DK, Wood N. The disposition of voriconazole in mouse, rat, rabbit, guinea pig, dog, and human. Drug Metab Dispos. 2003;31:731–41. doi: 10.1124/dmd.31.6.731. [DOI] [PubMed] [Google Scholar]


