

Abstract
Eicosanoids, produced from arachidonic acid by cyclooxygenases (COXs) and lipoxygenases (LIPOXs), are involved in numerous brain processes. To explore if brief and noninjurious stimuli chronically alter expression of these enzymes, we examined the induction of COX-2 and LIPOX expression following unilateral neocortical spreading depression (SD). Expression was examined over time and in regions not experiencing SD (hippocampus) but synaptically connected to the site of stimulation (cortex). One hundred six male Wistar rats had SD induced via microinjection of 0.5 M KCl (0.5 M NaCl for sham) into left parietal cortex every 9 minutes for 1or 3 hours. One hour before SD some animals received dexamethasone (Dex), mepacrine (Mep), indomethacin (Indo), nordihydroguaiaretic acid (Ndga), phenylephrine (Pe), sodium nitroprusside (Snp) with Pe, or Nω-nitro-L-arginine methyl ester (Lnam). Animals survived for 0, 3, or 6 hours, or 1, 2, 3, 7, 14, 21, or 28 days. Brains were processed immunohistochemically for COX-2 and LIPOX, and the optical density (OD) of the left and right cortex, dentate gyrus (DG), CA3, and CA1 immunoreactivity (IR) were measured. Induction was expressed as the log of left divided by right side OD for each region. COX-2 IR in the left cortex was elevated rapidly and was sustained for 21 days following SD. COX-2 IR was also elevated in the ipsilateral hippocampus not experiencing SD, with the rank order of induction as follows: DG > CA3 > CA1. Dex, Snp, and/or Pe significantly reduced the induction of COX-2. No changes in LIPOX IR were observed. These results show that long-term changes in COX-2 expression are induced by SD and these changes decrease with synaptic distance. Benign stimuli increase COX-2 expression and thus may influence brain function for extended periods and at distant locations.
Indexing terms: prostaglandins, leukotrienes, arachidonic acid, nitric oxide, hippocampus
Eicosanoids are metabolites of arachidonic acid produced by the cyclooxygenase (COX), lipoxygenase (LIPOX), and cytochrome P450 enzymes (for review, see Needleman et al., 1986). Arachidonic acid (AA) and the eicosanoids have been implicated in many brain functions including the control of sleep-wake cycles (Hayaishi, 1991), temperature and fever (Ueno et al., 1982; Stitt, 1991), pituitary hormone production (Ojeda et al., 1982), and even long-term potentiation (LTP; Luo and Vallano, 1995; for review, see Bliss and Collingridge, 1993). Furthermore, these molecules have a well-established role as mediators of inflammation (Goetzl et al., 1995). Thus, any change in content of these eicosanoid-producing enzymes following stimulation might have pro-found effects on brain function.
Cyclooxygenase, also known as prostaglandin endoperoxide H synthase (PGHS), has two known isoforms, a constitutive form (COX-1; Smith et al., 1991) and an inducible form (COX-2; Xie et al., 1991). The distribution of these enzymes in the brain has been characterized (Breder et al., 1992, 1995; Breder, 1996; Yamagata et al., 1993). The distribution of the main LIPOX enzymes and their derivatives in the brain has only begun to be characterized (Miyamoto et al., 1987a,b; Simmet and Peskar, 1990; Cluoet et al., 1991; Nishiyama et al., 1992, 1993).
Yamagata et al. (1993) have shown that the expression of COX-2 can be rapidly and transiently elevated from seizures. Furthermore, expression was induced by electrical activity that induced LTP and modulated by systemic administration of glutamate receptor blockers and tetrodotoxin treatment of the optic nerve. These results have led to the suggestion that COX-2 may function as an “immediate” or “early” factor following stimulation and that synaptic activity may have a role in its expression.
Spreading depression (SD) is a propagating wave of electrical silence and negative interstitial DC potential (Leão, 1944) significantly different from a seizure, as it is a benign phenomenon that is never associated with irreversible injury of brain cells (Nedergaard and Hansen, 1988; Kraig et al., 1991). Seizures induced by chemical (for review, see Nadler et al., 1986) or electrical (Olney et al., 1983a,b) stimulation can cause characteristic patterns of neuronal cell death. Although it is noninjurious, SD stimulation transforms astrocytes (Kraig et al., 1991) and microglia (Gehrmann et al., 1993; Caggiano and Kraig, 1996) into reactive cells. We have previously shown that the eicosanoids alter the induction of microgliosis from SD (Caggiano and Kraig, 1996). Here we investigate how the expression of the eicosanoid-producing enzymes (i.e., COX-2 and LIPOX) are modulated in the cortex following unilateral cortical SD.
Previous work (Kraig et al., 1991) has shown that changes in glial fibrillary acidic protein (GFAP) expression are induced by cortical SD in regions anatomically connected to the cortex but not experiencing SD. Because SD does not travel between gray matter areas (Bures et al., 1974), this observation suggests that some effects of SD may be transmitted by a synaptic mechanism. To determine if COX-2 and/or LIPOX expression are sensitive to these transynaptic effects, we examined COX-2 and LIPOX following cortical SD in regions not experiencing SD, namely the hippocampus. Hippocampal circuitry has been well characterized (Swanson and Cowan, 1977) and provides an ideal location to look at events one, two, and three synapses away from events in the cortex (i.e., dentate gyrus, CA3, and CA1, respectively). SD only travels between gray matter areas under extreme circumstances (e.g., see Largo et al., 1996); thus, cortical SD would not be predicted to travel to the hippocampus, and any changes in the expression of enzymes in the hippocampus following neocortical SD would be the result of hippocampal projections from the cortex. We confirmed a lack of SD in the hippocampus and examined COX-2 and LIPOX expression in the cortex, dentate gyrus (DG), CA3, and CA1 following unilateral neocortical SD.
Our results show that COX-2 immunoreactivity (IR) was increased rapidly in the hemisphere experiencing SD and remained elevated for 21 days. This change was reduced by Dex (a glucocorticoid), Pe (an adrenergic agonist), and Snp (a nitric oxide donor; NO) with Pe. Mep (a phospholipase A2 inhibitor), Indo (a COX inhibitor), Lnam (a NO synthase antagonist), and Ndga (a LIPOX inhibitor) did not alter the induction of COX-2. The LIPOX IR was unchanged from SD. Recordings confirmed that SD did not occur in the hippocampus; however, COX-2 IR was significantly elevated in the ipsilateral DG, CA3, and CA1, with the extent of change in the order: cortex > DG > CA3 > CA1. LIPOX IR remained unchanged in the hippocampus.
MATERIALS AND METHODS
Animal preparation and recording
All procedures followed those of Caggiano and Kraig (1996) with some modification. Animals were prepared as previously described (Kraig et al., 1991; Moskowitz et al., 1993) with the minor modifications described below. Wistar male rats (250–450 g; Harlan Sprague-Dawley, Indianapolis, IN and Charles River, Wilmington, MA), were housed individually and maintained on a 12-hour day/night cycle with food and water available ad libitum. Following a 16-hour fasting period, animals (n = 106) were anesthetized via inhalation with halothane (5% induction, 3% during surgery and 1.0–2.5% during electrophysiological recordings) in a 20% oxygen-nitrogen gas mixture. Animals breathed spontaneously and were maintained at 37 ± 0.5°C with a water body jacket.
SD was induced as previously described (Caggiano and Kraig, 1996). Briefly, 0.5 M KCl was injected via a glass micropipette (#6010 glass; A-M, Corporation, Everett, WA), with a tip diameter of 12 μm at 6 mm caudal to bregma, 4.5 mm lateral to the midline, and 750 μm below the pial surface for 0.5–8 seconds every 9 minutes for 3 hours at 30 p.s.i. Total volumes of injected KCl were between 6 and 12 μl over the 3-hour period. Recordings were made from two 150 mM NaCl microelectrodes (#6030 glass; A-M, Corporation, Everett, WA) with tip diameters of 2–8 μm, placed 3 mm anterior to bregma, 2 mm to either side of the sagittal suture at a depth of 750 μm. A reference electrode made from the same glass with 150 mM NaCl in 3.5% agar was placed in the left temporalis muscle. In one set of animals, recordings were also made in the hippocampus ipsilateral to the KCl injections by microelectrodes placed at 6 mm posterior to bregma, 4.5 mm left of the sagittal suture at a depth of 2,800 μm. Dye was injected through the hippocampal microelectrode and confirmed placement in DG and CA3. Records were amplified with an Axoprobe A-1 system (Axon Instruments, Burlington, CA), filtered at 2 Hz and displayed on a chart recorder. During recordings, Ringer solution was applied to the exposed skull surface (1–3 ml/min). Ringer contained (in mM): Na+ 143.5, K+ 3.0, Ca2+ 1.5, Cl− 115, HCO3− 26.4, gluconate 9.6, and glucose 5.0, which when aerated with 95% oxygen and 5% carbon dioxide had a pH of 7.3–7.4 (modified from Bretag, 1969). Animals experiencing SD without pharmacological manipulation were designated as the “Sd” group.
Arterial blood was sampled from a cannulated tail artery. Carbon dioxide tension (PaCO2), oxygen tension (PaO2), and pH were monitored every 30–60 minutes with a Corning blood gas analyzer (model 238; Ciba Corning Diagnostics, Medfield, MA). Blood glucose was also monitored (Glucometer; Miles Laboratory, Naperville, IL). After 3 hours of SD, electrodes were removed and animals were allowed to recover for 0, 3, or 6 hours, 1, 2, 3, 7, 14, 21, or 28 days under the same conditions described above.
A second group of animals (5/group) was treated 1hour prior to surgery with either Dex, Mep, Indo, Ndga, Lnam, Pe, or Snp. Dex and Lnam were purchased from Merck, Sharp and Dohme (West Point, PA) and Mep, Ndga, Indo, and Snp from Sigma (St. Louis, MO). Drugs were administered in 0.1- to 0.4-ml volumes via intraperitoneal injection at concentrations to give the following doses: Dex, 2 mg/kg in saline; Mep, 10 mg/kg in water; Indo, 5 mg/kg in saline; Ndga, 10 mg/kg in 0.01 M NaOH; Lnam, 30 mg/kg in 37 mM phosphate-buffered saline, (PBS; 7.4 pH). The dosages were derived from the literature (for sources, see Caggiano and Kraig, 1996). All drug-treated animals were allowed to survive 3 days following SD under conditions described above.
Pe and Snp were delivered according to the methods of Zhang et al. (1994) via cannulation of the femoral and external carotid artery, respectively. Snp was administered at 3 mg/kg/hr and Pe at 0.04% as needed to maintain blood pressure that would otherwise fall due to the nitric oxide (NO) donation of Snp.
Sham controls (Sh) were performed by replacing the KCl with 0.5 M NaCl. Drug control groups received drugs at the above dosages, but did not have SD induced. Normal animals (Nm) were also included in the analysis.
Immunohistochemistry
Immunohistochemical staining followed the procedures of Breder et al. (1995) with some modifications. Animals were anesthetized transiently with halothane and then deeply with pentobarbital (50 mg/kg). Following an intra-cardiac injection of heparin (100 units in 1.0 ml), animals were perfused transcardially with 200–300 ml normal saline followed by 500 ml of fixative (2% paraformaldehyde, 0.075 M lysine-HC1, 0.010 M sodium periodate, in 37 mM phosphate buffer, (PB, pH 6.2). Brains were removed and postfixed for 2 hours in the same fixative. Brains were transferred to 10% sucrose in PBS for 2 hours and then into 20% sucrose in PBS for 48 hours. Brains were blocked, frozen in isopentane cooled to −35°C, and stored until use at −80°C.
COX-2 staining
Frozen coronal sections were cut at 40 μm with a cryostat microtome (model #855; Reichert-Jung, Cambridge Instruments, Heildelberg, Germany). Sections were incubated in 0.3% H2O2 and 0.25% Triton X-100 (Sigma, St. Louis, MO) for 30 minutes and washed 3 × 5 minutes in (PBS, 10 mM PB with 150 mM NaCl). Sections were then incubated in blocking solution containing 3% normal goat serum (Colorado Serum Co, Denver, Co), 0.25% Triton X-100, and 0.001% sodium azide in PBS (PGT + Azide) for 1 hour at room temperature. Primary antibody against COX-2 (provided by D. Dewitt, Michigan State University, East Lansing, MI) was diluted to 1:750 concentration in PGT + Azide, and tissue was incubated in this solution overnight at 4°C. Specificity of this antibody is addressed in Breder et al. (1995). Sections were rinsed 3 × 5 minutes in PBS and incubated in horseradish peroxidase–tagged goat anti-rabbit IgG (Biosource Intl., Burlingame, CA) for 1 hour. Tissue was rinsed, and antibody was visualized by incubation in 0.05% diaminobenzidine dihydro-chloride (DAB, Sigma) and 0.01% H2O2 for 7 minutes. All steps were done at room temperature with gentle agitation unless otherwise noted. Sections were rinsed again, mounted on gelatin-coated slides, dehydrated in ethanol, and cleared in xylenes. Silver intensification of staining was performed according to the procedures of Breder et al. (1992). Slides were dehydrated, cleared, and coverslipped with DPX (BDH Limited, Poole, England).
Sections from a few animals were processed with a commercially available COX-2 antibody (#90050; Cayman Chemical Company, Ann Arbor, MI). Tissues from test animals within each experimental group were processed, and staining intensity, distributions, and log ratios were comparable to tissue processed with the above COX-2 antibody.
LIPOX staining
LIPOX staining procedures were identical with COX-2 staining with the following exceptions. After sectioning, tissue was floated on 0.1% glutaraldehyde in 4% paraformaldehyde for 5 minutes to flatten tissue. The primary antibody (LX12A, lot number 022894) was purchased from Cayman Chemical Company (Oxford, MI). Their tests have confirmed its specificity for lipoxygenase enzymes, and while it was raised against 12-lipoxygenase, it has substantial cross reactivity with 5 and 15-lipoxygenase enzymes. Following primary antibody incubation (1:300 in PGT + Azide), antibody was localized with the Vectastain® ABC Elite Kit (Vector Laboratories, Burlingame, CA) and DAB. The secondary antibody of the ABC Kit was diluted fivefold more than recommended by Vectastain® protocols. Dehydration and silver-intensification were as above.
Computer-based image analysis
Image analysis was done as described by Caggiano and Kraig (1996). Briefly, coronal sections were trans-illuminated with an Intralux® 4000 fiber-optic flat light source (Volpi MFG, Co., Auburn, NY), through a 480/40 band-pass filter (Chroma Technology Corp., Brattleboro, VT). The operator was blinded to experimental conditions at the time of image acquisition, and the technician was blinded during data analysis. A CCD camera (CH250; Photometrics, Tucson, AZ), and 200-mm zoom lens were used to capture images on an optical drive (Pinnacle Micro® Sierra 1.3GB; Pinnacle Micro, Inc. Irvine, CA) by using PMIS® software (version 3.0; Photometrics Inc., Tucson, AZ). Images were prepared and analyzed with Image Pro Plus® (version 1.2; Media Cybernetics, Silver Springs, MD). All processes were run under Windows® (3.1) on a 486 AST® computer (AST Research, Inc., Irvine, CA) on an uninterruptible power source (MUPSA-1000; Philtek Power Corp., Blaine, WA). For complete details on methods of image analysis, see Caggiano and Kraig (1996).
Data analysis
Areas of Interest (AOIs) were drawn around the left and right cortex, DG, CA3, and CA1 in coronal sections at the level of the entorhinal cortex. Preliminary analysis of IR in neocortical subregions showed that staining in each subregion was changing in parallel (Kraig et al., 1995); thus, for final analysis all neocortical subregions were grouped together and referred to as “cortex.” Optical density (OD) of these areas was then measured with light and dark limits set to 475 and 3,000 for COX-2 OD and 400 and 1,600 for LIPOX OD. The right-side cortex, DG, CA3, and CA1 served as controls for the respective left-side experimental regions. Values are expressed as the log of the left-side OD divided by the right-side OD (log (1/r)). In this manner, equal left and right staining intensities will give a value of zero. We have shown that our method of densitometry produces values that are reproducible to within 0.004% (Caggiano and Kraig, 1996).
Analysis of densitometry by ratiometric analysis provides internal controls and eliminates problems of quantification resulting from variable staining intensities typically found from immunohistological procedures. Ratiometric-based quantification procedures are well described by Imaging Research Inc.’s (St. Catharines, Ontario, Canada) manual, “Fundamentals of Image Analysis, (1995).” This method of analysis is established in the literature. We (Kraig et al., 1991; Caggiano and Kraig, 1996) and others (Mize and Luo, 1992; Garrison et al., 1993) have used it extensively. Ratiometric analysis provides semi-quantitative estimates of left vs. right changes, but it does not report absolute (single-side) values. Ratiometric analysis eliminates the problem of diffuse background staining, as the background in the left and right hemispheres is extremely even (see Figs. 2A, 4A, 6A). As some degree of variability is encountered in most immunohistological procedures, small-to-moderate variations in staining intensity should be evaluated (where possible) by the inclusion of “internal controls” (i.e., immunostaining of the contralateral areas).
Fig. 2.

Brightfield photomicrographs of cyclooxygenase-2 (COX-2) staining in a normal rat. A Low-power photomicrograph of 40-μm coronal section using a 200-mm zoom lens. 8×. Observe that staining intensity is equal in the left and right neocortices. Neocortical COX-2 immunoreactivity (IR) was most intense in layers II and III. B,C: Medium-power photomicrographs of COX-2 IR in the left (B) and right (C) entorhinal cortices. 60 ×.D,E: High-power photomicrographs from left (D) and right (E) entorhinal cortices taken at 378×. Scale bars. = 100 μm in B,C, 15 μm in D,E.
Fig. 4.

Brightfield photomicrographs of lipoxygenase (LIPOX) immunostaining in a normal rat. A: Low-power photomicrograph of 40-μm coronal section using a 200-mm zoom lens. ×8. Observe that staining intensity is equal in the left and right hemisphere. Neocortical LIPOX IR was more distributed across all layers than was COX-2 IR. B,C: Medium-power photomicrographs of LIPOX IR in the left (B) and right (C) entorhinal cortices. × 60. D,E: High-power photomicrographs from left (D) and right (E) entorhinal cortices taken at ×378. Scale bars = 100 μm in B,C, 15 μm in D,E.
Fig. 6.

Photomicrographs of COX-2 IR 3 days after 3 hours of spreading depression. A: Low-power photomicrograph of 40-μm coronal section using a 200-mm zoom lens. ×8. Observe that staining intensity in the left cortex has greatly increased compared with its right-side control. Also note that the right cortex is not appreciably different from control animals (Fig. 2A,C,E). Neocortical COX-2 IR was again most intense in layers II and III, but increased staining was observed across all layers. B,C: Medium-power photomicrographs of COX-2 IR in the left (B) and right (C) entorhinal cortices. ×60. D,E:. High-power photomicrographs from left (D) and right (E) entorhinal cortices taken at ×378. Scale bars =100 μm in B,C, 15 μm in D,E.
Data in the time-course analyses were evaluated by calculating the probability of encountering many successive values above zero from a population equally distributed on both sides of zero according to the equation: (Binomial Coeff.) × (prqn-r) (Snedecor and Cochran, 1989), where “n” is the number of cases and “r” is the number of times a value above zero was encountered. “p” and “q” both have the value of 0.5, as there is an equal probability of encountering a positive and negative value. Similarly, cortex was compared with DG, DG with CA3, and CA3 with CA1, using a nonparametric sign test of the means at each time point. Values were also compared with values from normal animals using the Student t-test and the Dunnett test when multiple comparisons were necessary. The values in the arterial blood gas table were evaluated by analysis of variance (ANOVA) and post-hoc Tukey. Statistics were performed on Systat® software (version 5; Systat, Inc., Evanston, IL), and histograms were prepared by using Sigma Plot® software (version 2.0; Jandel Scientific, San Rafael, CA). Means and standard errors are shown in all histograms.
Histologic illustrations are electronic images acquired as described above, except that a 450/40 band pass filter was used for COX-2 IR images and a 540/40 band pass filter was used while acquiring LIPOX-IR images. These images were then sharpened with a “higauss” filter (5 × 5 pixel matrix at 50% strength and two passes; Image Pro® software) and printed on a dye-sublimation printer (XLT-7720; Eastman Kodak, Rochester, NY). Magnification and scale bars are as indicated in figure legends.
RESULTS
SDs were reliably induced in the experimental left cortex following the experimental procedures described above. A characteristic example of electrical activity during SD is shown in Figure 1A. No SDs occurred in the control right cortex (bottom trace of each pair). Recordings from the ipsilateral (left) hippocampus revealed that SD did not occur in the hippocampus. The bottom trace in Figure 1B is from the ipsilateral hippocampus during neocortical SD (top trace). Notice the small change in the hippocampal record corresponding to each neocortical SD, associated with a reduction in spontaneous synaptic activity. Also note a similar reduction was seen in the contralateral (right) cortex at layer III–IV. No SDs were induced in sham-operated animals.
Fig. 1.
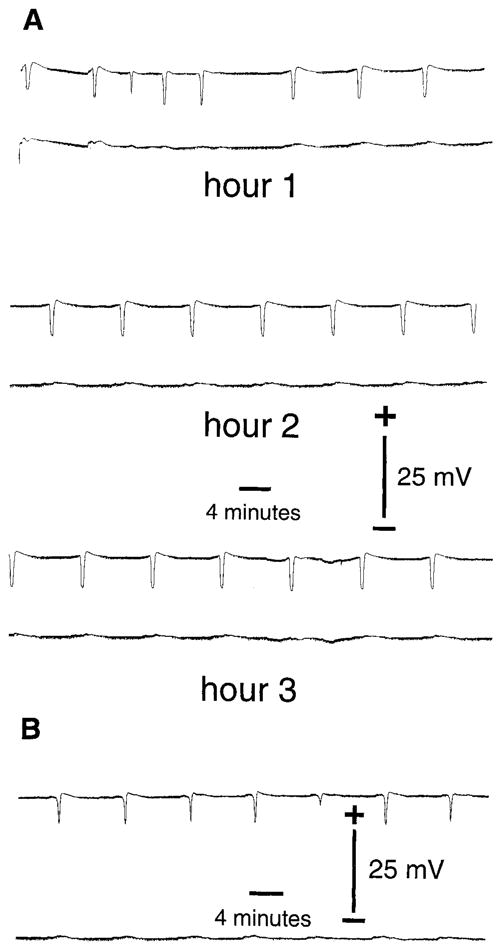
A: Electrophysiological recording of spreading depression (SD) in frontal neocortices. DC potentials are shown from the left (top trace of each pair) and right (bottom trace of each pair) frontal neocortices during 3 hours of recurrent SD. SD was induced by micro-injection of 0.5 M KCl into the left parietal cortex every 9 minutes for 3 hours. At the conclusion of the recordings, animals were allowed to survive for a given time and then processed for COX-2 and LIPOX IR as described in the Methods. Sham control animals were micro-injected with 0.5 M NaCl and never experienced SD. Time scale and potential are as shown in figure. B: Electrophysiological recording as in A, except the bottom trace of pair is a recording from a microelectrode placed in the left (ipsilateral) hippocampus. No SDs were ever observed in the hippocampus during neocortical SD. Time scale and potential are as shown.
All animals appeared normal and healthy following surgery and SD. They displayed feeding, grooming, and motor activity of normal animals. The blood gases and vital signs were all within expected ranges for spontaneously breathing animals anesthetized with halothane (see Table 1). Each value was analyzed by ANOVA and post-hoc Tukey test. Group values differing from other groups are marked by an asterisk.
TABLE 1.
Blood Physiologic Variables, Temperature, Anesthesia, and Number of SDs1
| Animal group (survival) | PH | PaCO2 (torr) | PaO2 (torr) | Hematocrit (%) | Blood pressure (mm Hg) | Temperature (°C) | Halothane (%) | SDs (No.) | Glucose (mMol) |
|---|---|---|---|---|---|---|---|---|---|
| Time studies | |||||||||
| Sham | 7.21 ± 0.05 | 64 ± 4 | 99 ± 12 | 40 ± 2 | 107 ± 7 | 37.3 ± 0.2 | 1.7 ± 0.1 | 0 ± 0* | 3.4 ± 3.3 |
| 0 (1 hour SD) | 7.17 ± 0.02 | 57 ± 4 | 100 ± 8 | 42 ± 2 | 92 ± 14 | 37.5 ± 0.2 | 1.8 ± 0.0 | 12 ± 2* | 6.9 ± 1.4 |
| 0 (3 hour SD) | 7.21 ± 0.05 | 65 ± 4 | 94 ± 10 | 40 ± 4 | 110 ± 10 | 37.7 ± 0.7 | 1.2 ± 0.2 | 27 ± 8 | 3.3 ± 3.3 |
| 3 hour | 7.21 ± 0.01 | 61 ± 4 | 105 ± 6 | 43 ± 4 | 115 ± 15 | 37.7 ± 0.4 | 1.2 ± 0.0 | 28 ± 4 | 6.5 ± 1.8 |
| 6 hour (COX) | 7.24 ± 0.02 | 58 ± 5 | 94 ± 1 | 42 ± 5 | 97 ± 12 | 37.6 ± 0.5 | 1.2 ± 0.3 | 28 ± 6 | 2.4 ± 0.0 |
| 6 hour (LIPOX) | 7.34 ± 0.06 | 56 ± 9 | 104 ± 3 | 40 ± 1 | 110 ± 5 | 37.6 ± 0.1 | 2.0 ± 0.0 | 20 ± 2 | 5.2 ± 0.6 |
| 1 day | 7.20 ± 0.02 | 59 ± 4 | 105 ± 15 | 43 ± 4 | 97 ± 6 | 37.2 ± 0.1 | 1.3 ± 0.1 | 25 ± 12 | 4.5 ± 4.3 |
| 2 day | 7.25 ± 0.05 | 58 ± 4 | 117 ± 23 | 38 ± 8 | 106 ± 17 | 37.4 ± 0.4 | 1.3 ± 0.2 | 29 ± 4 | 4.1 ± 2.8 |
| 3 day | 7.21 ± 0.09 | 61 ± 9 | 102 ± 20 | 41 ± 5 | 112 ± 10 | 37.2 ± 0.2 | 1.3 ± 0.1 | 30 ± 9 | 5.6 ± 0.4 |
| 7 day | 7.21 ± 0.03 | 67 ± 8 | 114 ± 6 | 41 ± 3 | 95 ± 10 | 37.9 ± 0.5 | 1.3 ± 0.3 | 24 ± 2 | 8.2 ± 2.7 |
| 14 day | 7.21 ± 0.02 | 64 ± 5 | 104 ± 17 | 43 ± 0 | 106 ± 12 | 37.4 ± 0.0 | 1.8 ± 0.3 | 24 ± 7 | 6.7 ± 0.0 |
| 21 day (COX) | 7.20 ± 0.00 | 62 ± 3 | 93 ± 6 | 41 ± 1 | 106 ± 9 | 37.3 ± 0.5 | 1.8 ± 0.3 | 24 ± 4 | 7.1 ± 0.7 |
| 21 day (LIPOX) | 7.34 ± 0.02 | 53 ± 4 | 98 ± 12 | 40 ± 0 | 107 ± 3 | 37.1 ± 0.2 | 1.8 ± 0.1 | 21 ± 1 | 5.0 ± 0.2 |
| 28 day | 7.23 ± 0.07 | 68 ± 10 | 97 ± 4 | 44 ± 1 | 115 ± 13 | 37.1 ± 0.1 | 1.5 ± 0.3 | 17 ± 1 | 5.8 ± 1.3 |
| Hippo | 7.25 ± 0.02 | 68 ± 3 | 96 ± 7 | 45 ± 2 | 118 ± 6 | 37.0 ± 0.2 | 1.6 ± 0.3 | 21 ± 1 | 4.8 ± 0.3 |
| Drug studies | |||||||||
| Dex | 7.30 ± 0.05 | 58 ± 3 | 104 ± 4 | 38 ± 0 | 114 ± 9 | 37.4 ± 0.3 | 1.5 ± 0.0 | 30 ± 6 | 5.3 ± 0.0 |
| Mep | 7.29 ± 0.03 | 57 ± 4 | 105 ± 12 | 42 ± 4 | 118 ± 28 | 37.2 ± 0.3 | 1.5 ± 0.4 | 25 ± 7 | 4.0 ± 0.3 |
| Indo | 7.22 ± 0.01 | 69 ± 6* | 103 ± 2 | 39 ± 1 | 125 ± 25 | 37.2 ± 0.1 | 1.4 ± 0.1 | 27 ± 5 | 5.1 ± 1.7 |
| Ndga | 7.29 ± 0.06 | 58 ± 9 | 105 ± 17 | 41 ± 4 | 114 ± 10 | 37.4 ± 0.4 | 1.4 ± 0.4 | 18 ± 5 | 5.3 ± 1.0 |
| Eph | 7.31 ± 0.01 | 59 ± 5 | 103 ± 14 | 42 ± 1 | 150 ± 13* | 37.1 ± 0.6 | 1.4 ± 0.1 | 19 ± 1 | 6.4 ± 0.8 |
| Snp/Ep | 7.25 ± 0.04 | 54 ± 5 | 109 ± 7 | 43 ± 1 | 99 ± 34 | 37.3 ± 0.2 | 1.6 ± 0.2 | 14 ± 3* | 11.0 ± 1.1* |
| Lnam | 7.20 ± 0.01 | 65 ± 2* | 101 ± 10 | 41 ± 1 | 123 ± 10 | 37.4 ± 0.2 | 1.4 ± 0.1 | 20 ± 5 | 5.6 ± 0.3 |
All values are means ± standard deviation.
Indicates significantly different from other groups according to ANOVA and post-hoc Tukey. All groups contain three to five animals.
Note: Hippocampal recordings were made in animals not processed for immunohistochemistry as electrode placement itself may cause an increase in enzyme expression next to the electrode tract. Immunohistochemical analysis of cortex was performed well posterior to the placement of recording electrodes and well anterior to zone of SD induction.
COX-2 distribution in normal brain
IR for COX-2 in normal animals was as previously published (Breder et al., 1995). COX-2 IR displayed a low intensity and neuronal distribution throughout layers II and III of the cortex. This pattern is evident in the low, medium, and high-power digital photomicrographs (Fig. 2A,B, and D, left, C and E, right). In the hippocampus, staining intensity was greatest in CA3 (Fig. 3E,F), slightly less intense in the DG (Fig. 3C,D) and least intense in CA1 (Fig. 3G,H). Very little left-versus-right variation in staining intensity was encountered in normal animals (compare Fig. 3 left column with right column). The left-versus-right intensity is expressed as the log of the ratio of left-side divided by right-side optical density (Fig. 8). Sham-operated animals also displayed no left-versus-right change in COX-2 IR (Fig. 8).
Fig. 3.

Photomicrographs of COX-2 IR in normal rat left and right hippocampi. A,B: Low-power photomicrographs of left (A) and right (B) hippocampi taken at × 15. Notice the even staining intensity in the left and right sides. In normal rats, hippocampal COX-2 IR was slightly less intense in the dentate gyrus (C,D) than in CA3 (E,F),and least intense in CA1 (G,H). C–H were taken at × 150. Scale bars = 400 μm in A,B, 40 μm in C–H.
Fig. 8.

Histograms of the log ratios of left-versus-right COX-2 OD at given time points following 3 hours of SD. Top left: Log ratios from the cortex. Ten of 11 time points analyzed were increased above zero. The probability of this according to the binomial distribution is < .003. Top right: Log ratios from the dentate gyrus. Ten of 11 time points analyzed were increased above zero. The probability of this according to the binomial distribution is < .003. Furthermore, at ten of 11 time points the change in the cortex was greater than the change in the dentate gyrus. The probability of this is <.003. Bottom left: Log ratios from CA3. Ten of 11 time points analyzed were increased above zero. The probability of this according to the binomial distribution is < .003. Ten of 11 time points showed greater change in the dentate gyrus than in CA3 (P < .003). Bottom right: Log ratios from CA1. Nine of 11 time points analyzed were increased above zero. The probability of this according to the binomial distribution is < .03. At nine of 11 time points the change in CA3 was greater than the change in CA1. The probability of this is <.03. Asterisks above bars indicate significantly elevated above zero. ** indicates P < .003 and * indicates P < .03. Nm, normal animals; Sh, sham-operated animals; 0′, no survival, 1-hour SD; 0″, no survival, 3-hour SD.
Lipoxygenase distribution in normal brain
IR for LIPOX in cortex of normal animals was similar to the COX-2 distribution; however, LIPOX IR was more evenly distributed across cortical lamina. This pattern is evident in the low-, medium-, and high-power digital photomicrographs (Fig. 4A,B and D, left, C and E, right). In the hippocampus, staining intensity was greatest in CA2, whereas slightly less intense IR was encountered in the DG (Fig. 5C,D), CA3 (Fig. 5E,F), and CA1 (Fig. 5G,H). Very little left-versus-right variation in staining intensity was encountered in normal animals (compare left and right columns of Fig. 5). As with the COX-2 IR, the staining intensity is expressed as the log of the ratio of left-side divided by right-side OD (Fig. 9). Sham-operated animals also displayed no left-versus-right change in LIPOX IR.
Fig. 5.

Photomicrographs of LIPOX IR in normal rat left and right hippocampi. A,B: Low-power photomicrographs of left (A) and right (B) hippocampi taken at × 15. Notice the even staining intensity in the left and right sides. LIPOX IR was evenly distributed across hippocampal cellular layers with the exception of CA2, where staining intensity was consistently more intense. LIPOX IR in the dentate gyrus (C,D), CA3 (E,F),and CA1 (G,H). C–H were taken at × 150. Scale bars = 400 μm in A,B, 40 μm in C–H.
Fig. 9.

Histograms of the log ratio of left-versus-right LIPOX OD at given time points following 3 hours of SD. Log ratios from the cortex (top left), dentate gyrus (top right), CA3 (bottom left), and CA1 (bottom right). None of the values at any of the time points were significantly different from normal animals or zero. Furthermore, unlike the COX-2 data, of the four regions at three time points, five values were above 0 and seven values were below 0. It does appear that SD induced a degree of variability in the LIPOX IR; however, any increase of decrease in LIPOX expression is well below the sensitivity of the methods employed in this work.
Cortical COX-2 immunoreactivity elevated and sustained following SD
Left-versus-right COX-2 IR in the cortex was elevated above zero in animals experiencing SD at 10 out of 11 time points observed. The elevation was evident by 3 hours, reaching a maximal level between 1 and 3 days and returning to normal, or even possibly rebounding past normal, by 28 days (Fig. 8, top left). The probability of encountering an elevation above zero in 10 of 11time points is less than 0.003. The log ratio was significantly elevated above zero at all time points between 3 hours and 21 days (P < .05). This is clearly visualized in the low-power digital photomicrographs showing a coronal section of an animal 3 days after SD and processed for COX-2 IR (Fig. 6A). The higher-power images show that the COX-2 IR has maintained a mostly neuronal distribution, but increased IR may now be found in other neocortical layers (Fig. 6B,C,D,E). Notice that COX-2 IR in the right cortex is not noticeably different from control animals (compare Fig. 2C,E with Fig. 6C,E).
Hippocampal COX-2 immunoreactivity increased following SD
COX-2 IR was also elevated in the left-side DG, CA3 and CA1 following SD in the left cortex. Again, recall that no SDs were observed in the hippocampus (Fig. 2B). The hippocampal COX-2 IR is visualized with low- and high-power digital photomicrographs (Fig. 7). Notice obvious increases in left-side staining in each of these areas (Fig. 7A,C,E,G) compared with their corresponding contralateral controls (Fig. 7B,D,F,H). This change was quantitated by the log of the ratio of the left-side divided by right-side OD (Fig. 8). Log ratios in DG, CA3, and CA1 were elevated above 0 at 10 out of 11, 10 out of 11, and 9 out of 11 time points, respectively. The probability of encountering elevations above zero at 10 out of 11, 10 out of 11, and 9 out of 11 time points is less than 0.003, 0.003, and 0.026, respectively. The changes in IR were again noticeable by 3 hours and lasted through 21 days.
Fig. 7.

Photomicrographs of COX-2 IR in left and right hippocampi 3 days after 3 hours of SD. A,B: Low-power photomicrographs of left (A) and right (B) hippocampi taken at × 15. As confirmed by statistical analysis of optical density (Fig. 8), induction of COX-2 IR was greater in the dentate gyrus C,D than in CA3 E,F. Induction of COX-2 in CA3 was greater than in CA1 (G,H). Photomicrographs C–H were taken at × 150. Scale bars = 400 μm in A,B, 15 μm in C–H.
The increase in left to right staining intensity following SD was greater in the cortex than the increase encountered in the DG at 9 out of 11time points evaluated. If there were no differences between the two populations (i.e., cortex and DG), the probability of encountering higher values in the cortex than in DG in 9 out of 11 time points is less than .026. Similarly, the COX-2 IR change in the DG was greater than that of CA3 (9 out of 11 time points; P < .026) and the CA3 change was greater than that encountered in CA1 (9 out of 11 time points; P < .026).
Cortical LIPOX immunoreactivity following spreading depression
LIPOX IR was not significantly elevated in the experimental cortex at any time point following SD. As no difference in LIPOX IR was found between SD animals and normal controls, these sections are not shown. LIPOX distribution in the left and right cortices remained identical and not appreciably different from control animals. No left-versus-right change in hippocampal LIPOX IR intensity or distribution was observed at any time point following SD. Densitometry analyses confirm a lack of change in left-versus-right LIPOX IR (Fig. 9). As no changes were observed at 6 hours, 3 days, or 21 days (time points encompassing the change observed in COX-2 IR), the remaining time points were not measured to conserve animal use.
Effects of drug treatments on COX-2 IR
Left-versus-right COX-2 IR was evaluated as above, 3 days after SD, with or without pretreatment treatment with either Dex, Indo, Ndga, Lnam, Pe, or Snp with Pe. Treatment with Dex, Pe, and Snp significantly reduced the log ratio of cox-2 IR from SD alone (P’s < .05). Figure 10 shows a low-power coronal section from each of the drug groups; along with a section from a normal SD animal. The reduction in left-versus-right staining intensity is readily apparent. These differences have been quantitated as above using the log ratio of the left-side divided by right-side optical density and displayed in Figure 11. Significant reductions from SD (P’s < .05) are indicated by an asterisk. Log ratios were not significantly different from SD in the Indo, Lnam, and Ndga groups.
Fig. 10.
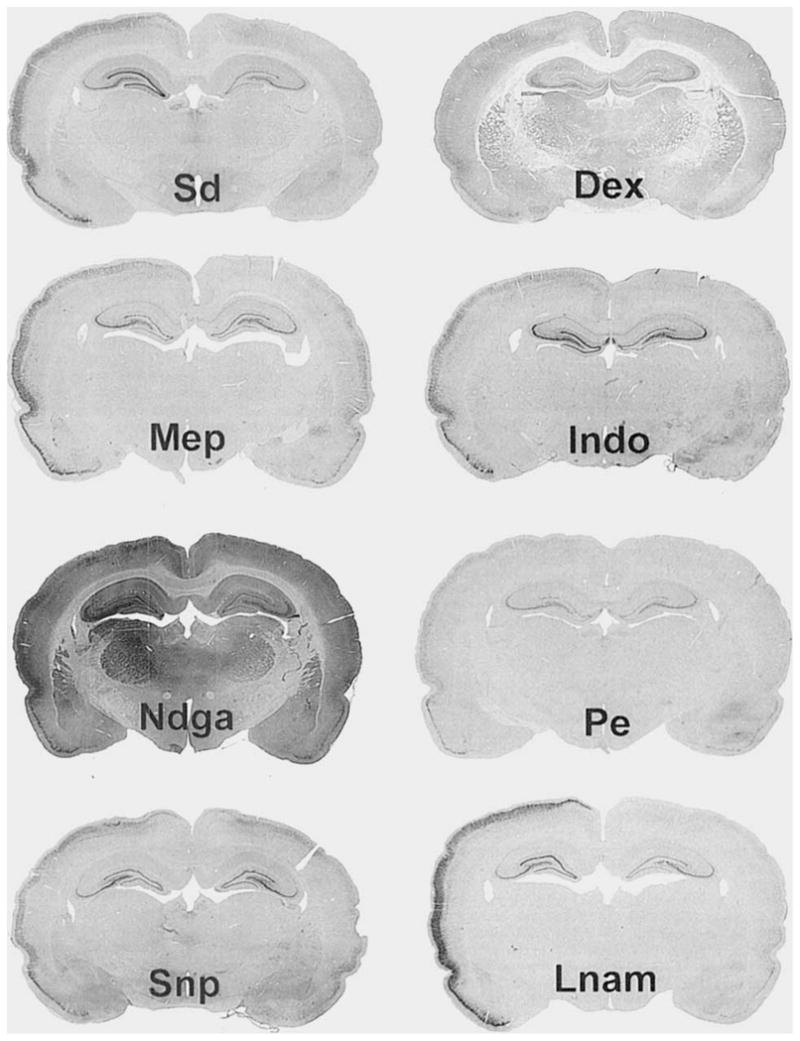
Photomicrographs of COX-2-IR in animals treated with pharmacological agents 1 hour before SD. All photomicrographs are of 40-μm coronal sections 3 days after 3 hours of neocortical SD. Photomicrographs were taken with a 200-mm zoom lens as in Figure 2. ×5. Spreading Depresion (Sd): Section from animal experiencing SD but receiving no drug. Observe the increased COX-2 IR in the left cortex and hippocampus. Dexamethasone (Dex): Section from animal treated with Dex 1 hour before 3 hours of SD. Observe the left-versus-right COX-2-IR induction is reduced (see also Fig. 11), but still slightly apparent. Mepacrine (Mep) and Indomethacin (Indo): Sections from animals treated with Mep and Indo, respectively. Neither agent significantly reduced the induction of left-versus-right COX-2 IR (Fig. 11). Nordihydroguaiaretic acid (Ndga): Section from animal treated with Ndga. Observe that the staining intensity is greatly increased across the whole brain. Phenylephrine (Pe) and Sodium Nitroprusside with Pe (Snp): Sections from animals treated with Pe alone or Snp with Pe, respectively. Left-versus-right COX-2 log ratios were significantly reduced from SD animals in both groups. Nω-nitro-L-arginine methyl ester (Lnam): Section from animal treated with Lnam.
Fig. 11.

Histograms of the log ratio of COX-2 OD from animal groups treated with eicosanoid and NO-altering drugs. All abbreviations are as in Figure 10. Significant differences from the Sd group (P’s < .05) are indicated by an asterisk. Dex, Pe, Snp, and the normal group (Nm) have log ratios of COX-2 IR significantly reduced from the Sd group which received no drug treatment. Histologic sections representing each of these groups are found in Figure 10.
As the log ratio of LIPOX IR never deviated from normal, the effect of the drug treatment on LIPOX IR with SD was not evaluated.
DISCUSSION
We have demonstrated that COX-2, but not LIPOX IR, is elevated rapidly and remains elevated for 3 weeks in the cortex following unilateral cortical SD. Furthermore, rapid and long-term elevation of COX-2 IR occurred in the ipsilateral hippoacampus, which did not experience SD, with the magnitude of left-versus-right difference occurring in the following order: cortex > DG > A3 >CA1. Thus, COX-2 enzyme expression is responsive to noninjurious stimuli, and changes in enzyme expression occur at local tions that do not experience SD but receive projections from the site of SD.
SD, elicited in the left cortex by microinjection of 0.5 M KCl, induced an elevation in the left-versus-right COX-2 IR within 3 hours of the SD and at a distance away from the injection site. Furthermore, this elevation was maintained for 21 days. Previous work (Yamagata et al., 1993) shows that COX-2 is elevated following seizures. This elevation is rapid but not sustained. In contrast to seizures (Nadler et al., 1986; Olney et al., 1983a,b), SD has no potential to cause cell death (Nedergaard and Hansen, 1988; Kraig et al., 1991); however, SD caused long-lasting elevation in COX-2 IR (Figs. 6–8).
COX-2 has been implicated as an “early on” or “immediate” factor following perturbation. Indeed, others have shown that COX-2 can be “up” and “down” regulated (Yamagata et al., 1993). We were interested in determining if the induction of COX-2 expression would be sensitive to events occurring in distant but anatomically connected locations. We examined COX-2 and LIPOX IR at locations zero, one, two, and three synapses away from SD: that is, in the cortex (where SD occurred), and in DG, CA3, and CA1 (where SD did not occur). Recordings from the hippocampus ipsilateral to the neocortical SD confirmed that SDs did not spread to the hippocampus (Fig. 1B). Notice that the electrical tracing corresponding to the hippocampus shows activity changes like those that occur in the contralateral cortex (Fig. 1A). Despite a lack of SD in the hippocampus, COX-2 expression in the ipsilateral hippocampus was elevated compared with the contralateral controls (Figs. 7,8).
The extent of COX-2 induction occurred in the following order: cortex > DG > CA3 > CA1 (Fig. 8). This order of degree of change follows the anatomical connectivity of the cortex to the hippocampus (Swanson and Cowan, 1977), where cortex projects to DG via the perforant pathway (PP), DG projects to CA3 via the mossy fiber pathway (MF), and CA3 projects to CA1 via the Schaffer collateral pathway (SC). Although areas of cortex do project directly to CA1 (as well as DG), attempts to achieve long-term changes in DG, CA3, and CA1 have been most successful by stimulation of the PP, MF and SC, respectively (see Bliss and Lomo, 1973; Nicoll et al., 1988; Zalutsky and Nicoll, 1990). Layer 4 of the contralateral cortex is also monosynaptically connected to the cortex experiencing SD but did not show an increase in COX-2 expression (compare Fig. 6C,E with Fig. 2C,E). This fact and the small change observed in CA1 show that connectivity alone does not seem sufficient to induce an increase in COX-2-IR, and that COX-2 expression changes may have specific roles in brain function in specific brain systems.
High-frequency stimulation of the perforant pathway that induces LTP, but not low-frequency stimulation, has been shown to elevate the expression of COX-2 in the hippocampus (Yamagata et al., 1993). Here we have shown that SD in the ipsilateral cortex is sufficient to induce long-lasting elevations in COX-2 expression in the hippocampus. The stimuli in the hippocampus responsible for the long-term elevation of COX-2 may be a substance released from hippocampal-projecting cortical neurons (traditional transmitters or other chemicals) or the small associated depolarizations along with the transient small decrease in spontaneous activity seen in the hippocampus during neocortical SD (Figs. 1B, 7, 8). Thus, it appears that COX-2 is an exquisitely sensitive marker of recent changes in neuronal conditions. Furthermore, this shows that brief depolarizations and reductions in spontaneous activity over multiple synapses may be as strong a stimulus for inducing long-lasting changes in the brain as high-frequency stimulation with concurrent depolarization (i.e., seizures or LTP induction).
LIPOX IR remained unchanged in the cortex and hippocampus following SD (Fig. 9). To confirm that an elevation in enzyme content could be detected using our antibody, we examined brain sections from rats treated with lipopolysaccharide. A clear elevation in LIPOX IR was evident (data not shown). This raises the question of why COX-2 expression is so dramatically elevated following SD whereas LIPOX expression remains constant. Previous work from this laboratory (Caggiano and Kraig, 1996) has shown that blockade of lipoxygenase enzymes retards the induction of reactivity in microglia, whereas cyclooxygenase inhibition may enhance the induction of reactivity in microglia. In addition, neurotoxicity by brain macrophages is reduced by COX products (Théry et al., 1994). These results suggest that both LIPOX and COX-2 are involved in brain inflammation, possibly serving pro-inflammatory and protective roles, respectively. Accordingly, one might speculate that it would be adaptive to increase the content of enzymes producing substances with neuroprotective or anti-inflammatory properties (e.g., cyclooxygenases) but not enzymes that produce neurotoxic or inflammatory products (e.g., lipoxygenases).
It has been shown that COX-2 elevation following seizure can be reduced with Dex, but not Indo (Yamagata et al., 1993). We examined the effect of these agents (Dex and Indo) and also Mep, Ndga, Snp+Pe, Pe, and Lnam on the elevation of COX-2 IR from SD at its point of greatest left-versus-right difference (i.e., 3 days post-SD in the cortex). We found that COX-2 IRs in animals treated 1 hour before 3 hours of SD with Dex, Snp+Pe, and Pe were significantly reduced from animals experiencing SD but receiving no drug treatment (P’s< .05, Figs. 10, 11), whereas COX-2 IR in animals treated with Mep, Indo, Lnam, and Ndga had no effect (Figs. 10, 11). Others have shown that nitric oxide (NO) has regulatory effects upon the activity of cyclooxygenases and lipoxygenases (Kanner et al., 1992; Salvemini et al., 1993; Stadler et al., 1993; Franchi et al., 1994; Nakatsuka and Osawa, 1994); thus, we examined if agents that alter NO levels (Snp and Lnam) might also alter COX-2 or LIPOX enzyme content. Pe was used to maintain blood pressure in Snp-treated animals. Both Pe and Snp+Pe-treated animals showed a significant reduction in COX-2 IR at 3 days following SD (Figs. 10, 11). Thus, Pe reduces the induction of COX-2 content, but no conclusions can be drawn about Snp and NO.
As cyclooxygenase products have been implicated in many brain processes ranging from hormone secretion to induction of LTP (Ojeda et al., 1982; Ueno et al., 1982; Hayaishi, 1991; Stitt, 1991; Bliss and Collingridge, 1993; Luo and Vallano, 1995; Goetzl et al., 1995), long-lasting elevation in enzyme content following brief, noninjurious stimulation may have significant and sustained effects on brain function. We have shown that COX-2, but not LIPOX enzyme expression, is rapidly elevated following SD, and this elevation is sustained for weeks. Furthermore, COX-2 expression is increased in regions not experiencing SD, but synaptically connected to an area experiencing SD, and the relative degree of increase may depend on the synaptic distance to the area of stimulation. This shows that COX-2 expression is extremely sensitive, even to events occurring at great distance, and may reflect the level of local brain activity occurring up to 3 weeks in the past. The long-term alteration of the enzymatic machinery of the brain, such as COX-2, has clear implications on brain function and its plasticity.
Acknowledgments
This work was supported by grants from the National Institute of Neurological Disorders and Stroke (NS-19108), the American Heart Association of Metropolitan Chicago, and the Brain Research Foundation of the University of Chicago. A.O.C. was supported by a Medical Scientist National Research Service Award (T32-GM-07281) from the National Institute of General Medical Health.
We also thank several members of our laboratory for their assistance in this project. Ms. Marcia P. Kraig provided assistance in animal experiments. Dr. P.E. Kunkler, and C.D. Lascola provided critical advice throughout the experiments. R. Hulse participated in the computer-based image analyses. P. Park participated in preliminary data analyses. J. Hunter and Dr. R.A. Thisted provided assistance with statistical procedures.
LITERATURE CITED
- Bliss TVP, Collingridge GL. A synaptic model of memory: long-term potentiation in the hippocampus. Nature. 1993;361:31–39. doi: 10.1038/361031a0. [DOI] [PubMed] [Google Scholar]
- Bliss TVP, Lomo T. Long-lasting potentiation of synaptic transmission in the dentate area of the anaesthetized rabbit following stimulation of the perforant path. J Physiol (Lond) 1973;232:331–356. doi: 10.1113/jphysiol.1973.sp010273. [DOI] [PMC free article] [PubMed] [Google Scholar]
- Breder CD. Cyclooxygenase Systems in the Mammalian Brain. Ann NY Acad Sci. 1996 doi: 10.1111/j.1749-6632.1997.tb51708.x. In Press. [DOI] [PubMed] [Google Scholar]
- Breder CD, Smith WL, Raz A, Masferrer JL, Seibert K, Needleman P, Saper CB. The distribution and characterization of cyclooxygenase-like immunoreactivity in the ovine brain. J Comp Neurol. 1992;322:409–438. doi: 10.1002/cne.903220309. [DOI] [PubMed] [Google Scholar]
- Breder CD, Dewitt D, Kraig RP. Characterization of inducible cyclooxygenase in rat brain. J Comp Neurol. 1995;355:29–315. doi: 10.1002/cne.903550208. [DOI] [PMC free article] [PubMed] [Google Scholar]
- Bretag AH. Synthetic interstitial fluids for isolated mammalian tissue. Life Sciences. 1969;8:319–329. doi: 10.1016/0024-3205(69)90283-5. [DOI] [PubMed] [Google Scholar]
- Bures J, Buresova 0, Krivanek J. The Mechanism and Applications of Leao’s Spreading Depression of Electroencephalographic Activity. New York: Academic Press; 1974. [Google Scholar]
- Caggiano AO, Kraig RP. Eicosanoids and nitric oxide influence induction of reactive gliosis from spreading depression in microglia but not astrocytes. J Comp Neurol. 1996;369:93–108. doi: 10.1002/(SICI)1096-9861(19960520)369:1<93::AID-CNE7>3.0.CO;2-F. [DOI] [PMC free article] [PubMed] [Google Scholar]
- Cluoet P, Niot I, Bouchard P, Gree R, Lelouche JP, Beaucourt JP, Fonlupt P, Duperray B, Bezard J, Lagarde M. Distribution of tritium labeled 12 (S) hydroxy-eicosatetraenoic acid (12-HETE) in the rat. Prostaglandins. 1991;42:39–45. doi: 10.1016/0090-6980(91)90092-t. [DOI] [PubMed] [Google Scholar]
- Franchi AM, Chaud M, Rettori V, Suburo S, McCann SM, Gimeno M. Role of nitric oxide in eicosanoid synthesis and uterine motility in estrogen-treated rat uteri. Proc Natl Acad Sci USA. 1994;91:539–543. doi: 10.1073/pnas.91.2.539. [DOI] [PMC free article] [PubMed] [Google Scholar]
- Garrison CJ, Dougherty PM, Carlton CM. Quantitative analysis of substance P and calcitonin gene-related peptide immunohisto- chemical staining in the dorsal horn of neuropathic MK-801-treated rats. Brain Res. 1993;607:205–214. doi: 10.1016/0006-8993(93)91508-p. [DOI] [PubMed] [Google Scholar]
- Gehrmann J, Miles G, Bonnekoh P, Banati R, Iijima T, Kreutzberg GW, Hossmann KA. Microglial reaction in the rat cerebral cortex induced by cortical spreading depression. Brain Pathol. 1993;3:11–17. doi: 10.1111/j.1750-3639.1993.tb00720.x. [DOI] [PubMed] [Google Scholar]
- Goetzl EJ, An S, Smith WL. Specificity of expression and effects of eicosanoid mediators in normal physiology and human diseases. FASEB J. 1995;9:1051–1058. doi: 10.1096/fasebj.9.11.7649404. [DOI] [PubMed] [Google Scholar]
- Hayaishi O. Molecular mechanisms of sleep-wake regulation–roles of prostaglandin-D2 and prostaglandin-E2. FASEB J. 1991;5:2575–2581. [PubMed] [Google Scholar]
- Kanner J, Harel S, Granit R. Nitric oxide, an inhibitor of lipid oxidation by lipoxygenase, cyclooxygenase and hemoglobin. Lipids. 1992;27:46–49. doi: 10.1007/BF02537058. [DOI] [PubMed] [Google Scholar]
- Kraig RP, Dong L, Thisted R, Jaeger CB. Spreading depression increases immunohistochemical staining of glial fibrillary acidic protein. J Neurosci. 1991;11:2187–2198. doi: 10.1523/JNEUROSCI.11-07-02187.1991. [DOI] [PMC free article] [PubMed] [Google Scholar]
- Kraig RP, Breder CD, Park P. Spreading depression elevates inducible cyclooxygenase immunoreactivity in discrete brain regions. Soc Neurosci Abstr. 1995;21:1867. [Google Scholar]
- Largo C, Cuevas P, Somjen GG, del Río RM, Herreras O. The effects of depressing glial function in rat brain in situ on ion homeostasis, synaptic transmission, and neuron survival. J Neurosci. 1996;16:1219–1229. doi: 10.1523/JNEUROSCI.16-03-01219.1996. [DOI] [PMC free article] [PubMed] [Google Scholar]
- Leão AAP. Spreading depression of activity in the cerebral cortex. J Neurophysiol. 1944;7:359–390. doi: 10.1152/jn.1947.10.6.409. [DOI] [PubMed] [Google Scholar]
- Luo Y, Vallano ML. Arachidonic acid, but not sodium nitroprusside, stimulates presynaptic protein kinase C and phosphorylation of GAP-43 in rat hippocampal slices and synaptosomes. J Neurochem. 1995;64:1808–1818. doi: 10.1046/j.1471-4159.1995.64041808.x. [DOI] [PubMed] [Google Scholar]
- Miyamoto T, Lindgren JA, Hökfelt T, Samuelson B. Formation of lipoxygenase products in the rat brain. Adv Prostaglandin Thromboxane Leukotriene Res. 1987a;17:929–933. [PubMed] [Google Scholar]
- Miyamoto T, Lindgren JA, Hokfelt T, Samuelson B. Regional distribution of leukotriene and mono-hydroxyeicosatetraenoic acid production in the rat brain. Highest leukotriene C4 formation in the hypothalamus. FEBS Lett. 1987b;216:123–127. doi: 10.1016/0014-5793(87)80769-x. [DOI] [PubMed] [Google Scholar]
- Mize RR, Luo Q. Visual deprivation fails to reduce calbindin 28kd of GABA immunoreactivity in the Rhesus monkey superior colliculus. Vis Neurosci. 1992;9:157–168. doi: 10.1017/s0952523800009627. [DOI] [PubMed] [Google Scholar]
- Moskowitz MA, Nozaki K, Kraig RP. Neocortical spreading depression provokes the expression of c-fos protein-like immunoreactivity within trigeminal nucleus caudalis via trigeminovascular mechanisms. J Neurosci. 1993;13:1167–1177. doi: 10.1523/JNEUROSCI.13-03-01167.1993. [DOI] [PMC free article] [PubMed] [Google Scholar]
- Nadler JV, Okazaki MM, Gruenthal M, Ault B, Armstrong DR. Kainic acid seizures and neuronal cell death: insights from studies of selective lesions and drugs. In: Schwarcz R, Ben-Ari Y, editors. Excitatory Amino Acids and Epilepsy, Adv Exp Med Biol. Vol. 203. New York: Plenum; 1986. pp. 673–686. [DOI] [PubMed] [Google Scholar]
- Nakatsuka M, Osawa Y. Selective inhibition of the 12- lipoxygenase pathway of arachidonic acid metabolism by L-arginine or sodium nitroprusside in intact human platelets. Biochem Biophys Res Commun. 1994;200:1630–1634. doi: 10.1006/bbrc.1994.1638. [DOI] [PubMed] [Google Scholar]
- Nedergaard M, Hansen AJ. Spreading depression is not associated with neuronal injury in rat brain. Brain Res. 1988;449:395–398. doi: 10.1016/0006-8993(88)91062-1. [DOI] [PubMed] [Google Scholar]
- Needleman P, Turk J, Jakschik BA, Morrison AR, Lefkowith JB. Arachidonic acid metabolism. Annu Rev Biochem. 1986;55:69–102. doi: 10.1146/annurev.bi.55.070186.000441. [DOI] [PubMed] [Google Scholar]
- Nicoll RA, Kauer JA, Malenka RC. The current excitement in long-term potentiation. Neuron. 1988;1:97–103. doi: 10.1016/0896-6273(88)90193-6. [DOI] [PubMed] [Google Scholar]
- Nishiyama M, Okamoto H, Watanabe T, Hori T, Hada T, Ueda N, Yamamoto S, Tsukamoto H, Watanabe K, Kirino T. Localization of arachidonate 12-lipoxygenase in canine brain tissues. J Neurochem. 1992;58:1395–1400. doi: 10.1111/j.1471-4159.1992.tb11355.x. [DOI] [PubMed] [Google Scholar]
- Nishiyama M, Watanabe T, Ueda N, Tsukamoto H, Watanabe K. Arachidonate 12-lipoxygenase is localized in neurons, glial cells, and endothelial cells of the canine brain. J Histochem Cytochem. 1993;41:111–117. doi: 10.1177/41.1.8417106. [DOI] [PubMed] [Google Scholar]
- Ojeda S, Negro-Vilar A, McCann SM. Evidence for involvement of alpha adrenergic receptors in norepinephrine induced PGEz and luteinizing hormone releasing hormone from the median eminence. Endocrinology. 1982;110:409–412. doi: 10.1210/endo-110-2-409. [DOI] [PubMed] [Google Scholar]
- Olney JW, deGubareff T, Sloviter RS. “Epileptic” brain damage in rats induced by sustained electrical stimulation of the perforant path. I. Acute electrophysiological and light microscopic studies. Brain Res Bull. 1983a;10:675–697. doi: 10.1016/0361-9230(83)90037-0. [DOI] [PubMed] [Google Scholar]
- Olney JW, deGubareff T, Sloviter RS. “Epileptic” brain damage in rats induced by sustained electrical stimulation of the perforant path. II. Ultrastructural analysis of acute hippocampal pathology. Brain Res Bull. 1983b;10:699–712. doi: 10.1016/0361-9230(83)90038-2. [DOI] [PubMed] [Google Scholar]
- Salvemini D, Misko TP, Masferrer JL, Seibert K, Currie MG, Needleman P. Nitric oxide activates cyclooxygenase enzymes. Proc Natl Acad Sci USA. 1993;90:7240–7244. doi: 10.1073/pnas.90.15.7240. [DOI] [PMC free article] [PubMed] [Google Scholar]
- Simmet T, Peskar BA. Lipoxygenase products of polyunsaturated fatty acid metabolism in the central nervous system: biosynthesis and putative functions. Pharmacol Res. 1990;22:667–682. doi: 10.1016/s1043-6618(05)80093-3. [DOI] [PubMed] [Google Scholar]
- Smith WL, Marnett LJ, Dewitt D. Prostaglandin and thromboxane biosyntbesis. Pharmacol Ther. 1991;49:153–179. doi: 10.1016/0163-7258(91)90054-p. [DOI] [PubMed] [Google Scholar]
- Snedecor GW, Cochran WG. Statistical Methods. Ames Iowa State University Press; 1989. pp. 107–130. [Google Scholar]
- Stadler J, Harbrecht BG, DiSilvio M, Curran RD, Jordan ML, Simmons RL, Billar TR. Endogenous nitric oxide inhibits the synthesis of cyclooxygenase products and interleukin-6 by rat Kuppffer cells. J Leukocyte Biol. 1993;53:165–172. doi: 10.1002/jlb.53.2.165. [DOI] [PubMed] [Google Scholar]
- Stitt JT. Differential sensitivity in the sites of fever production by prostaglandin-El within the hypothalamus of the rat. J Physiol (Lond) 1991;432:99–110. doi: 10.1113/jphysiol.1991.sp018378. [DOI] [PMC free article] [PubMed] [Google Scholar]
- Swanson LW, Cowan WM. An autoradiographic study of the organization of the efferent connections of the hippocampal formation in the rat. J Comp Neurol. 1977;172:49–84. doi: 10.1002/cne.901720104. [DOI] [PubMed] [Google Scholar]
- Théry C, Dobbertin A, Mallat M. Downregulation of in vitro neurotoxicity of brain macrophages by prostaglandin E2 and a β-adrener-gic agonist. Glia. 1994;11:383–386. doi: 10.1002/glia.440110411. [DOI] [PubMed] [Google Scholar]
- Ueno R, Narumiya S, Ogorochi T, Nakayama T, Ishikawa Y, Hayaishi O. Role of prostaglandin D2 in the hypothermia of rats caused by bacterial lipopolysaccharide. Proc Natl Acad Sci USA. 1982;79:6093–6097. doi: 10.1073/pnas.79.19.6093. [DOI] [PMC free article] [PubMed] [Google Scholar]
- Xie WL, Chipman JG, Robertson DL, Erikson RL, Simmons DL. Expression of a mitogen-responsive gene encoding prostaglandin synthase is regulated by messenger RNA splicing. Proc Natl Acad Sci USA. 1991;88:2692–2696. doi: 10.1073/pnas.88.7.2692. [DOI] [PMC free article] [PubMed] [Google Scholar]
- Yamagata K, Andreasson KI, Kaufmann WE, Barnes CA, Worley PF. Expression of a mitogen-inducible cyclooxygenase in brain neurons: regulation by synaptic activity and glucocorticoids. Neuron. 1993;11:371–386. doi: 10.1016/0896-6273(93)90192-t. [DOI] [PubMed] [Google Scholar]
- Zalutsky RA, Nicoll RA. Comparison of two forms of long-term potentiation in single hippocampal neurons. Science. 1990;248:1619–1624. doi: 10.1126/science.2114039. [DOI] [PubMed] [Google Scholar]
- Zhang F, White JG, Iadecola C. Nitric Oxide donors increase blood flow and reduce brain damage in focal ischemia: evidence that nitric oxide is beneficial in the early stages of cerebral ischemia. J Cereb Blood Flow Metab. 1994;14:217–226. doi: 10.1038/jcbfm.1994.28. [DOI] [PubMed] [Google Scholar]