Abstract
There is accumulating evidence to suggest that palindromic AT-rich repeats (PATRRs) represent hot spots of double-strand breakage that lead to recurrent chromosomal translocations in humans. As a mechanism for such rearrangements, we proposed that the PATRR forms a cruciform structure that is the source of genomic instability. To test this hypothesis, we have investigated the tertiary structure of a cloned PATRR. We have observed that a plasmid containing this PATRR undergoes a conformational change, causing temperature-dependent mobility changes upon agarose gel electrophoresis. The mobility shift is observed in physiologic salt concentrations and is most prominent when the plasmid DNA is incubated at room temperature prior to electrophoresis. Analysis using two-dimensional gel electrophoresis indicates that the mobility shift results from the formation of a cruciform structure. S1 nuclease and T7 endonuclease both cut the plasmid into a linear form, also suggesting cruciform formation. Furthermore, anti-cruciform DNA antibody reduces the electrophoretic mobility of the PATRR-containing fragment. Finally, we have directly visualized cruciform extrusions from the plasmid DNA with the size expected of hairpin arms using atomic force microscopy. Our data imply that for human chromosomes, translocation susceptibility is mediated by PATRRs and likely results from their unstable conformation.
The constitutional t(11;22)(q23;q11) is the only known recurrent non-Robertsonian translocation in humans. Its recurrent nature implicates a specific genomic structure at the t(11;22) breakpoints. Analyses of numerous independent t(11;22) cases have localized the breakpoints within palindromic AT-rich repeats (PATRRs)1 on 11q23 and 22q11 (1–4). Most 11;22 translocations show breakpoints at the center of the PATRRs, suggesting that the center of the palindrome is susceptible to double-strand breaks, leading to the translocation (5, 6). Indeed, translocation-specific PCR detects a high frequency of de novo t(11;22)s in normal sperm samples (7).
The breakpoints on 22q11 are located within one of the unclonable gaps in the human genome (8, 9). Extensive screening of YAC/BAC/PAC libraries has not been successful in cloning this breakpoint region. However, experimentally derived sequences from numerous t(11;22) junction fragments demonstrate that the 22q11 breakpoints reside within a larger PATRR. The breakpoints of a variety of translocations involving 22q11 cluster within this region, suggesting that the 22q11 PATRR is highly unstable (10–13). More recently, molecular cloning of translocation breakpoints has demonstrated similar palindromic sequences on partner chromosomes, such as 17q11, 4q35.1, and 1p21.2 (14–16).
It has been suggested that for palindromic sequences in double-stranded DNA, the interstrand base pairs might convert to intrastrand pairs, producing a set of hairpin structures described as a cruciform (see Fig. 1A). In appropriate conditions, these structures can be generated from palindromic DNA in vitro and visualized directly by electron microscopy (17). Under physiological conditions, cruciform extrusion is usually kinetically blocked; it appears to take place only in response to heating, suggesting that a considerable amount of energy is required for cruciform extrusion (18). However, under appropriate conditions, palindromic DNA prefers to extrude cruciform arms even at physiological temperatures (19). In a previous report, we demonstrated that the PATRRs on 11q23, 17q11, and 22q11 are all comprised of a long AT-rich region with relatively GC-rich ends (5, 14). We have proposed that the AT richness of the PATRRs contributes to strand separation at physiological temperatures, whereas the relatively GC-rich ends contribute to the stable intrastrand complementary interaction of the PATRR. These characteristics are likely to induce or favor the formation of a cruciform structure.
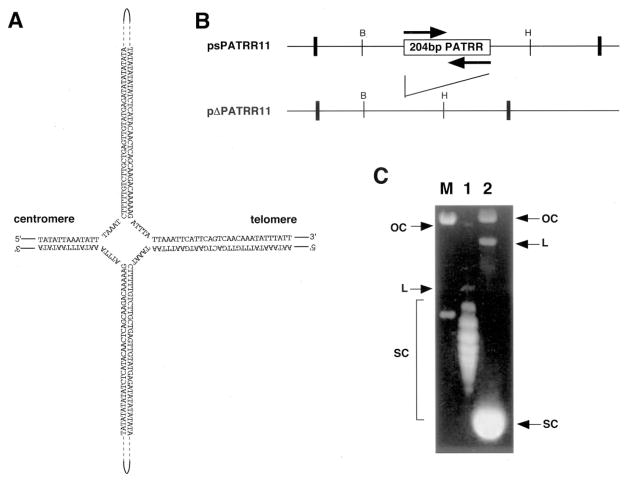
Fig. 1. Agarose gel electrophoresis of the PATRR plasmid.
A, putative cruciform structure of the PATRR of chromosome 11. B, schematic representation of psPATRR11 and pΔPATRR11. The box indicates the inverted repeat region, whereas each arrow indicates the repeat unit. pΔPATRR11 deletes almost the entire 204-bp PATRR region. Bold vertical lines indicate the cloning sites of the plasmids. The thin vertical lines indicate restriction sites for the following enzymes: BamHI (B) and HincII (H). C, agarose gel electrophoresis of psPATRR11 and pΔPATRR11. Lane M, molecular size marker; lane 1, psPATRR11; lane 2, pΔPATRR11. OC, open circle; L, linear; SC, supercoiled circle.
In this study, we have investigated the in vitro tertiary structure of the 11q23 PATRR and demonstrated that it forms a cruciform structure at physiological conditions. Our data suggest that PATRRs may form unstable structures that lead to chromosomal translocations in humans. These data also implicate a biological role for the temperature-sensitive conformational change characteristic of palindromic DNA.
EXPERIMENTAL PROCEDURES
PATRR Plasmid
A plasmid containing the chromosome 11 PATRR (204 bp) was constructed by PCR and TA cloning as described previously (psPATRR11) (1). The control plasmid that deletes the PATRR region was constructed using BAC 442e11, which deletes almost the entire PATRR region (pΔPATRR11). Plasmid DNA was isolated by means of alkaline lysis (denaturing) or Triton lysis (non-denaturing) methods and purified using ion-exchange columns (Qiagen) without the use of phenol. Isopropanol-precipitated DNA was dissolved in phosphate-buffered saline/1 mM EDTA. All of the procedures were performed at 4 °C in a cold room to avoid artifactual cruciform extrusion during the procedure. Isolated plasmid DNA was divided into small aliquots and immediately frozen until used in an experiment. The plasmid was quickly thawed, incubated at a given temperature, and then cooled on ice before electrophoresis.
DNA topoisomers containing different linking numbers were prepared by relaxation of the DNA with topoisomerase I (Invitrogen) in the presence of varied concentrations of ethidium bromide as described (20). Several samples with different ranges of linking numbers were pooled to produce a mixture with a broader distribution of topoisomers.
Two-dimensional Gel Electrophoresis
Standard agarose gel electrophoresis was performed in horizontal gel slabs immersed in 1× Tris/borate/EDTA (TBE) electrophoresis buffer. The 0.7% agarose gel was prepared in TBE in a square gel tray. Electrophoresis was performed at 45 V for 20 h at 4 °C. The gel was stained in water plus ethidium bromide at 1 μg/ml for 2 h followed by extensive destaining in several changes of water before photography. For two-dimensional gel electrophoresis, the sample was applied at the left upper corner. Electrophoresis in the first dimension was performed using the same conditions as for standard electrophoresis. The gel was then soaked in TBE plus chloroquine (0.75 μg/ml) (Sigma) for 8 h with gentle agitation for equilibration. After soaking, the gel was rotated clockwise 90° from the original position. Electrophoresis in the second dimension was performed in TBE plus chloroquine at 45 V for 20 h. The gel was then soaked in several changes of deionized water to remove the chloroquine. The gel was stained in water plus ethidium bromide in similar conditions as for standard agarose gel electrophoresis. To stabilize the cruciform structure, two-dimensional gel electrophoresis was also performed in Mg2+-containing buffer (0.5× TBE, 10 mM MgCl2) for the first dimension (21). Electrophoresis was carried out at 45 V for 30 h at 4 °C, replacing the electrophoresis buffer every 6 h (22).
Nuclease Sensitivity Assay
T7 endonuclease (New England Bio-Labs), S1 nuclease (Takara), and nuclease P1 (Roche Applied Science) digestions were performed at room temperature for 1 h in the appropriate buffers. 10 units of T7 endonuclease, 1 unit of S1 nuclease, and 0.1 units of nuclease P1 were used for digestion of 1 μg of plasmid. After digestion, the plasmid DNA was precipitated with ethanol and then subjected to 0.7% agarose gel electrophoresis.
For mapping of the cleavage sites, the nuclease-digested plasmids were purified, digested with EcoRI or BstXI, and then subjected to 2% agarose gel electrophoresis. The fragments were purified and sequenced using internal primers.
Electrophoretic Mobility Shift Assay (EMSA)
EMSA was performed as described previously (23), using a monoclonal antibody against cruciform DNA, 2D3 (24). To shorten the DNA fragment, psPATRR11 and pΔPATRR11 were digested with BamHI and HincII and subcloned into pT7Blue. 100 ng of supercoiled plasmid DNA was incubated at 4 °C for 1 h in 20 μl of binding buffer (10 mM Hepes, pH 7.8, 100 mM NaCl, 1 mM EDTA, and 5 mM MgCl2) with or without 2D3. A second circular plasmid was added simultaneously into the reaction for nonspecific competition. After the addition of 2 μl of 10× restriction digestion buffer, the plasmid was digested for 30 min at room temperature with 5 units of both BamHI and HindIII. Subsequently, 1 unit of Klenow fragment and 10 mCi of [α-32P]dCTP were added to the reaction mixture, and incubation continued for 10 min. The fragments were resolved on 4% non-denaturing polyacrylamide gels at 4 °C at 5 V/cm. Gels were dried and exposed for an appropriate time.
Atomic Force Microscopy (AFM) Experiments
The plasmid DNA sample (10 μl) was dripped onto a mica substrate coated with spermine, rinsed with 1 ml of water, and blown with dry nitrogen gas. AFM analysis was carried out using a Nanoscope IIIa Multimode system (Digital Instruments Inc., Santa Barbara, CA) in the tapping mode at room temperature in air. Silicon cantilevers of 127 μm in length with a spring constant of 48 newtons/m were purchased from Nanosensors (Wetzlar-Blankenfeld). Typical resonant frequencies of these tips were 340 kHz. The 512 × 512 pixel images were collected at a rate of two scan lines/second. The contour lengths of the DNA were determined using NIH Image software.
To lock the PATRR plasmid into the cruciform structure, DNA cross-linking was performed by a method similar to that described previously (25). In brief, plasmid DNA was dissolved in a solution of 4,5′,8-trim-ethylpsoralen (100 μg/ml) and exposed to UV light at 365 nm for 5 min. The DNA was digested with EcoRI, purified, and then subjected to AFM.
RESULTS
PATRR Plasmid Prefers to Be in Its Relaxed State
We have hypothesized that the PATRR forms a cruciform structure even in physiological conditions, leading to genomic instability in humans. To test this hypothesis, we have examined the tertiary structure of a cloned 11q23 PATRR. This PATRR is too unstable to be cloned into a plasmid vector in its entirety. The 11q23 BAC including the t(11;22) breakpoint region inevitably deletes the PATRR during bacterial culture. YACs that span this region also delete the PATRR, suggesting that it is unstable even when yeast is used as the host. Previously, we identified a short polymorphic version of the PATRR (Fig. 1B) that can be stably expanded as a plasmid in Escherichia coli (5). We prepared the short PATRR-containing plasmid (psPATRR11), as well as a plasmid that deletes the PATRR (pΔPATRR11), in a buffer at physiological salt concentration (phosphate-buffered saline/EDTA) and used them for the following studies.
First, we analyzed the plasmids prepared by the standard alkaline lysis method. Upon standard agarose gel electrophoresis, a plasmid usually yields three bands, which correspond to supercoiled, linear, and open circular DNA. In addition to the expected bands, the psPATRR11 showed a ladder migrating at the position for supercoiled DNA. The pΔPATRR11 did not yield such a ladder (Fig. 1C). Each band of the ladder corresponds to a topoisomer containing different linking numbers. Relaxed topoisomers move slowly in the gel. The observed ladder suggests that the PATRR-containing plasmid, unlike the plasmid without the PATRR, prefers to be in its relaxed state in solution.
Cruciform formation involves unpairing of the complementary strands and thus reduces the interstrand twist number. For negatively supercoiled DNA, a reduction in twist number reduces the degree of supercoiling and thus would cause a reduction in electrophoretic mobility. The observed ladder is consistent with cruciform formation of the PATRR plasmid.
Nuclease Sensitivity Assay
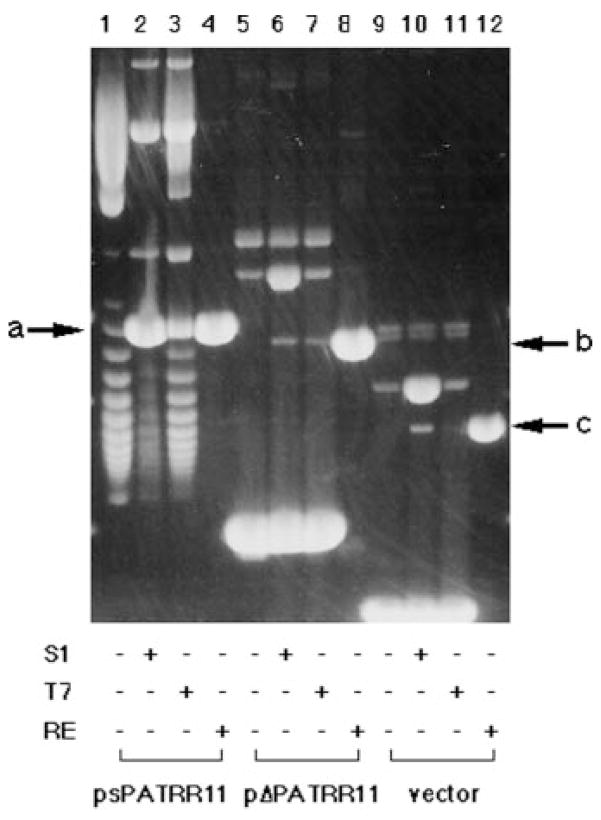
Cruciform DNA is known to be digested by S1 nuclease, nuclease P1, or T7 endonuclease (26). To confirm cruciform extrusion of the psPATRR11 and exclude the possibility of other conformational variants, we examined the nuclease sensitivity of the PATRR plasmid prepared by the alkaline lysis method. S1 nuclease, which is known to cut single-stranded DNA at the tip of the cruciform structure, cleaved most of the supercoiled psPATRR11 into a linear form (Fig. 2, lane 2) but cleaved only a small amount of the pΔPATRR11 or TA cloning vector (Fig. 2, lanes 6 and 10). Since the pH for the S1 nuclease reaction buffer is so low, it may nick the plasmid and affect the results. Thus, we also incubated the plasmid with buffer, which resulted in no background linearization (data not shown). Nuclease P1, which can react at physiological pH, produced similar results (data not shown). To exclude the possibility that S1 nuclease cleaves single-stranded DNA of the psPATRR11 only because of the AT-rich nature of the palindrome, we used T7 endonuclease, which can cut the four-way junction of the cruciform structure. When incubated at room temperature, a considerable amount of the ps-PATRR11 was digested by T7 endonuclease into a linear form (Fig. 2, lane 3). In contrast, the endonuclease did not cut either pΔPATRR11 or the TA cloning vector (Fig. 2, lanes 7 and 11).
FIG. 2. Nuclease sensitivity assay of the PATRR plasmid.
The original plasmid, plasmid with S1 nuclease digestion, plasmid with T7 endonuclease digestion, and plasmid with restriction enzyme digestion that cuts the plasmid only once were subjected to agarose gel electrophoresis in this order. Lanes 1–4, psPATRR11; lanes 5–8, pΔPATRR11; lanes 9–12, TA cloning vector. The arrows indicate the position of the linear form of psPATRR11 (a), pΔPATRR11 (b), and TA cloning vector (c). S1, S1 nuclease; T7, T7 endonuclease; RE, restriction enzyme.
Two-dimensional Gel Electrophoresis
To confirm cruciform extrusion of the psPATRR11 further, we performed two-dimensional gel electrophoresis. The first dimension, run in the absence of intercalative ligands, resolves the topoisomers on the basis of torsion in the backbone. Since structural transitions due to unwinding torsion are reversed in the presence of chloroquine, a second dimension run in the presence of this ligand resolves the topoisomers on the basis of linking differences.
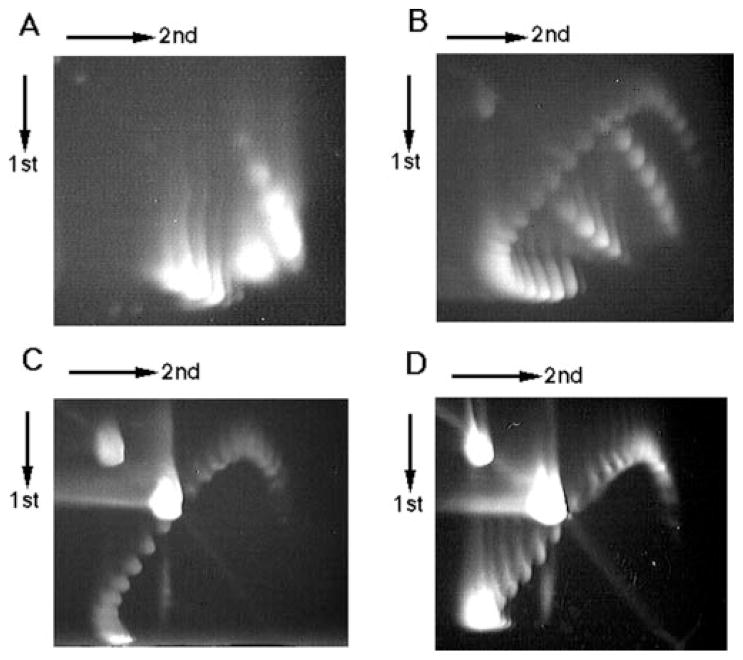
Examination of psPATRR11 prepared by the standard alkaline lysis method reveals two non-continuous downward-sloping curves on the gel, suggestive of an abrupt structural transition (Fig. 3A). Next, we treated psPATRR11 with topoisomerase I in the presence of various amounts of ethidium bromide so as to prepare plasmids with broader topoisomer distribution. After topoisomerase I treatment, psPATRR11 yields an additional curve above the original two (Fig. 3B). This additional curve corresponds to more relaxed topoisomers generated by topoisomerase I treatment. In the first dimension, the electrophoretic mobilities of cruciform-containing topoisomers are retarded in comparison with the same topoisomers without the cruciform, whereas these two forms migrate identically in the second dimension. This is the result of the elimination of cruciform structures in the presence of chloroquine, which acts to reduce torsional stress. Since a greater degree of negative supercoiling is known to accelerate cruciform extrusion (17, 18), the two minor curves on this gel are likely to originate from cruciform DNA.
FIG. 3. Two-dimensional gel electrophoresis of the PATRR plasmid.
A, psPATRR11 prepared by the alkaline lysis method. B, psPATRR11 treated with topoisomerase I in the presence of various amounts of ethidium bromide. C, topoisomerase I-treated psPATRR11 digested with T7 endonuclease. D, topoisomerase I-treated psPATRR11 digested with S1 nuclease. Two downward-sloping curves originating from cruciform extrusion are observed at the lower right side on both the A and the B gels, but neither are observed in the C nor in the D gel. Spots at the upper left side on the gels originate from open circular nicked plasmids, whereas spots near the center of the gels are from nuclease-cleaved linear plasmids.
We digested topoisomerase I-treated psPATRR11 with S1 nuclease or T7 endonuclease prior to the two-dimensional gel electrophoresis. As expected, the two minor curves virtually disappeared as a result of nuclease digestion, whereas the other curve remained unchanged (Fig. 3, C and D). Large spots indicative of open circles and linear DNA appeared instead. These results demonstrate that two minor arcs originate from cruciform DNA and that, combined with the data derived from undigested psPATRR11, the majority of psPATRR11, when isolated by the alkaline lysis method, forms a cruciform extrusion.
Mg2+ is known to stabilize a cruciform structure (21, 22). We repeated the two-dimensional gel electrophoresis experiments in Mg2+-containing buffer for the first dimension. The results were similar to those seen for standard TBE buffer (data not shown).
Mapping of Nuclease Cleavage Sites in the PATRR
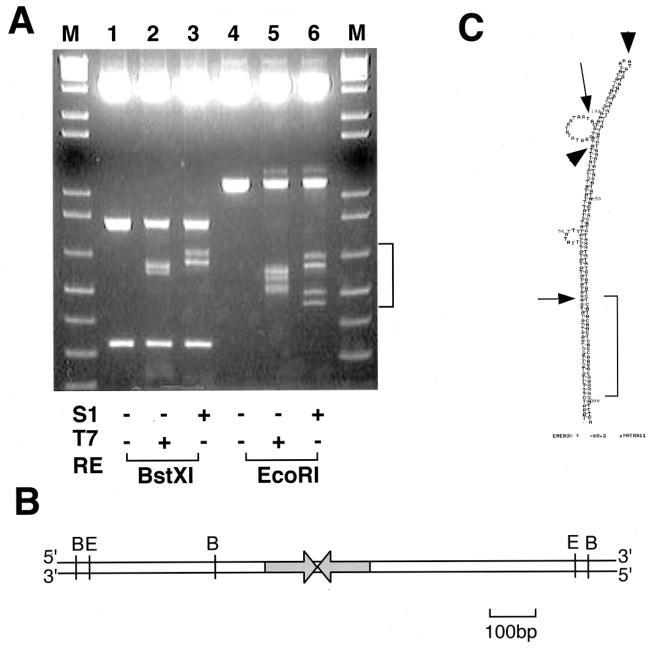
The presence of two curves on the two-dimensional gel indicates that the psPATRR11 adopts two types of cruciform conformations. To localize the subregion of the PATRR responsible for cruciform extrusion, we mapped nuclease cleavage sites using restriction enzyme digestion (Fig. 4, A and B). Both T7 endonuclease and S1 nuclease yielded several fragments that were shorter than that of the PATRR-containing fragment, whereas the intensity of the original fragment was reduced by treatment with the nucleases. The pattern of cleavage provides additional support toward confirming cruciform extrusion of the PATRR region of the plasmid.
FIG. 4. Mapping of nuclease cleavage sites in the PATRR.
A, mapping by digestion with restriction enzyme. S1, S1 nuclease; T7, T7 endonuclease; RE, restriction enzyme. B, restriction map of the PATRR-flanking region. C, mapping by sequencing. The entire PATRR is shown as a putative hairpin structure predicted by mfold software (mfold.burnet.edu.au/dna_form). The arrows indicate cleavage sites with T7 endonuclease, whereas the arrowheads indicate those with S1 nuclease. the relatively GC-rich region is indicated by a bracket.
To further map the cleavage sites, we performed sequence analysis of each nuclease-cleaved fragment. Four EcoRI-T7 endonuclease fragments were sequenced, and we localized the cleavage sites at two positions (Fig. 4C). Thus, we conclude that psPATRR11 forms large and small cruciform extrusions as was predicted from the two-dimensional gel analysis. The small cruciform extrusion originates from the 36-bp region at the center of the PATRR. Further, the PATRR has a relatively GC-rich region at both ends (1, 5). Thus, the large cruciform originates from the region that excludes this GC-rich region. The cleavage sites of S1 nuclease were rather complicated. One of the cleavage sites colocalized with the precise center of the PATRR, the putative tip of the cruciform structure (Fig. 4C). The rest of the cleavage sites of S1 nuclease were mapped at the mismatch regions between the proximal and distal arms of the PATRR. These results suggest intrastrand annealing within the PATRR, which is also consistent with cruciform formation.
Temperature-sensitive Structural Transition of the PATRR
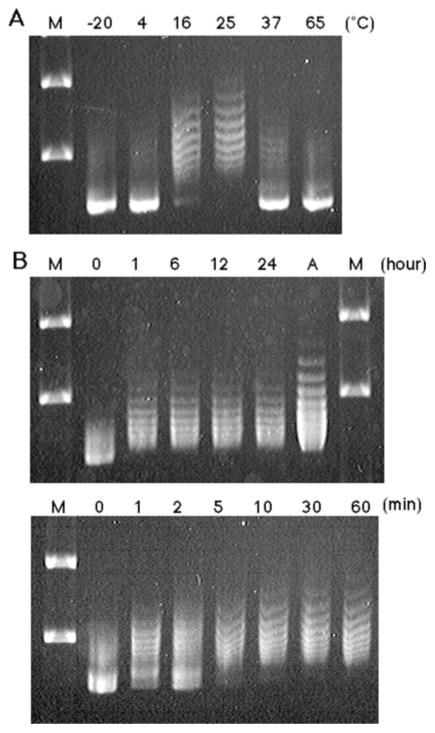
To determine whether the PATRR plasmid adopts cruciform conformation in E. coli, we have prepared the plasmid by a Triton lysis method (non-denaturing method) since denaturation of the PATRR can induce artifactual cruciform formation. Unlike plasmids isolated by the alkaline lysis method, psPATRR11 did not yield a characteristic ladder in standard agarose gel electrophoresis (Fig. 5A, lane 1). This suggests that the psPATRR11 does not form a cruciform in E. coli.
FIG. 5. Temperature-sensitive structural transition of the PATRR.
A, temperature-dependent gel mobility shift of the PATRR plasmid. psPATRR11 prepared by the Triton lysis method was incubated at various temperatures shown on the top. A, psPATRR11 prepared by the alkaline lysis method. M, molecular size markers. B, a time course of incubation at room temperature. psPATRR11 was incubated at room temperature for periods indicated on the top.
Next, we incubated the psPATRR11 at various temperatures for 1 h prior to agarose gel electrophoresis. Mobility retardation of the supercoiled plasmid was observed as a characteristic ladder in samples incubated at temperatures between 16 and 37 °C (Fig. 5A). This band shift must be the result of a transition from non-cruciform to a cruciform conformation. Unexpectedly, mobility retardation was most prominent in the plasmid incubated at room temperature. The ladder appeared as soon as 1 min after the start of incubation at room temperature, and the fraction of upward shifted bands expanded with increasing duration of incubation (Fig. 5B). Since the band pattern of the sample after 1 h of incubation was similar to that prepared by the alkaline lysis method, incubation at room temperature for 1 h appeared to be sufficient for a large fraction of the plasmid to form the cruciform extrusion. The sample incubated for 1 h at room temperature was subjected to two-dimensional gel analysis, producing similar results to that prepared by the alkaline lysis method (data not shown).
EMSA
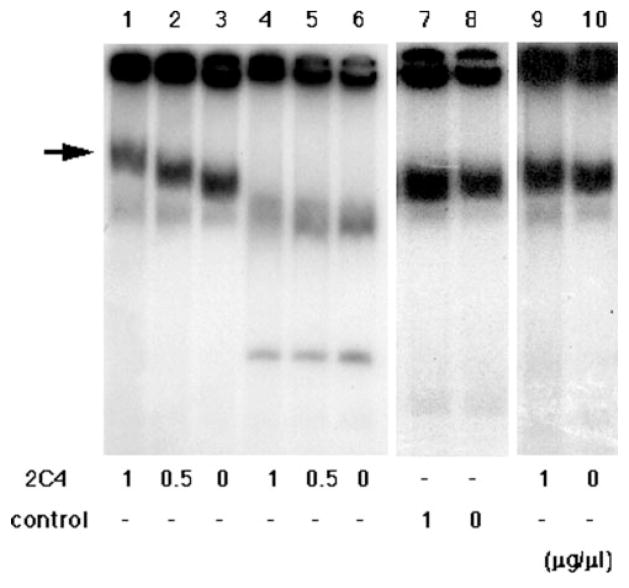
We performed EMSA using the anti-cruciform antibody 2D3, which recognizes cruciform DNA (24). To reduce the size of the PATRR fragments, we subcloned BamHI/HincII fragments into a plasmid vector (Fig. 1B). The sizes of the subfragments from psPATRR11 and pΔPATRR11 are 375 and 162 bp, respectively. Plasmid DNA samples prepared by the Triton lysis method were used for EMSA. Without any preincubation of the plasmid, the addition of the 2D3 antibody did not result in a band shift for the subfragments from ps-PATRR11 (Fig. 6, lanes 9 and 10) or from pΔPATRR11 (data not shown). However, when the plasmids were incubated at room temperature for 7 days prior to the reaction to maximize the fraction adopting cruciform conformation, subfragments from psPATRR11 demonstrated a robust band shift in an antibody concentration-dependent manner (Fig. 6, lanes 1–3). The subfragment from pΔPATRR11 did not show a band shift even after incubation at room temperature for 7 days (Fig. 6, lanes 4–6). Since retardation of psPATRR11 was not observed with control monoclonal antibodies (Fig. 6, lanes 7 and 8), this band shift indicates that the 2D3 antibody bound specifically to the PATRR plasmid incubated at room temperature.
FIG. 6. Gel electrophoresis mobility shift assay of the PATRR fragment.
psPATRR11 (lanes 1–3) or pΔPATRR11 (lanes 4–6) prepared by the Triton lysis method was incubated at room temperature for 7 days and then reacted with anti-cruciform antibody, 2D3. For psPATRR11, another monoclonal antibody was used as a control (lanes 7–8). psPATRR11 without incubation at room temperature was also reacted with 2D3 (lanes 9–10). The concentration of 2D3 antibody is indicated at the bottom. The arrow indicates the shifted band.
AFM Study
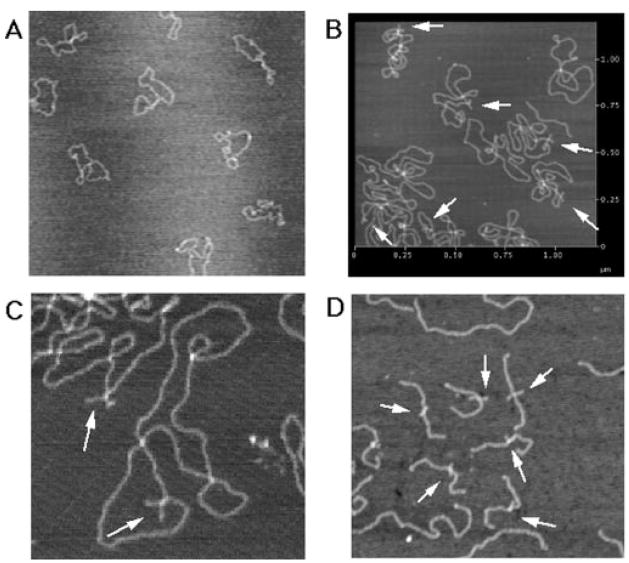
We used atomic force microscopy to examine the tertiary structure of the PATRR plasmid and to directly visualize the cruciform extrusion (27). We examined ps-PATRR11 prepared by the Triton lysis method. Initial examination revealed no overt cruciform extrusion (Fig. 7A). However, after incubation of the DNA samples at room temperature for 7 days, 37 of 45 plasmids analyzed (82.2%) showed cruciform extrusions (Fig. 7, B and C). The mean length of extrusions was 23.2 ± 4.3 nm. Since the size of the PATRR is 204 bp, the predicted size for the cruciform arm is 34.68 nm. When the GC-rich region at both ends of the PATRR (31 bp each) was excluded, the predicted size of the cruciform arm is 24.14 nm, which nearly corresponds to the observed size. Two types of extrusions are expected; those with extended or those with acute geometry of the cruciform arms. However, all of the observed cruciforms had acute geometry (X-type), with a mean cruciform arm angle of 89.3 ± 35.2°. The small cruciform, the size of which was predicted to be 6.12 nm from its nucleotide size (18 bp), was too small to be identified by AFM.
FIG. 7. AFM image of the PATRR plasmid.
A, an AFM image of psPATRR11 prepared by the Triton lysis method. B, an AFM image of the psPATRR11 after incubation at room temperature. C, another image of psPATRR11 at a higher magnification. D, an AFM image of psPATRR11 after DNA cross-linking followed by restriction digestion. The arrows indicate the cruciform extrusion. Longer fragments without cruciform structure may originate from the cloning vector. The scale bar is indicated in μm.
To localize the cruciform extrusion of the psPATRR11 within the PATRR region, we separated the insert including the PATRR (1 kb) from the plasmid vector (4 kb). psPATRR11 was cross-linked with psoralen and UV prior to EcoRI digestion. Cruciform extrusion was observed at the center of the 1-kb fragment but not in the 4-kb fragment (Fig. 7D), demonstrating that the PATRR formed a cruciform extrusion.
DISCUSSION
In this study, we have demonstrated that the 11q23 PATRR located at the t(11;22) breakpoint region can form a cruciform structure in vitro. Most individuals carry a 445-bp PATRR with an AT content of 93%. The homology between the proximal and distal arms is 98%, comprising a nearly complete palindromic structure (5). Previously, we identified a short polymorphic allele of the PATRR among a group of individuals. The total size of the short PATRR is 204 bp, with an AT content of 88%. The homology between the proximal and distal arms is 88%, with a 34-bp asymmetric center. Since it is difficult to clone DNA containing the complete palindrome, the plasmid we used for structural analysis contained this shorter version of the 11q23 PATRR. Our results clearly demonstrate that the short 11q23 PATRR forms a cruciform configuration at physiological conditions. Although there is no direct evidence that the short PATRR is involved in genesis of the translocation, one exceptional t(11;22) case appears to have originated from a short PATRR (5). Thus, it seems likely that the short PATRR behaves similarly to the long PATRR. It is reasonable to predict that the long 445-bp PATRR, as well as other PATRRs involved in chromosomal translocations, may also form cruciform structures that induce genomic instability.
It has been suggested that palindromic DNA capable of forming unstable cruciform structures induces both homologous and illegitimate recombination, leading to translocations. The data presented here support this proposed mechanism. Although the mechanism of PATRR-mediated double-strand break induction remains unknown, it is possible that the cruciform structure blocks progression of the replication fork, generating free ends that must be repaired (28, 29). Alternatively, a conformation-specific endonuclease may cleave at the center of the PATRR. However, no key enzyme to catalyze this cleavage has been identified. Cruciform structures that comprise a four-way junction resemble Holliday junctions, which may be a target for Holliday junction resolvase. Such a break might be repaired by non-homologous end joining, for there are symmetrical bx; 1deletionsba at the center of the PATRR, and there is no homology between the sequences of the translocation breakpoint partners (16).
In this report, we have demonstrated that cruciform extrusion is temperature-sensitive. Interestingly, cruciform formation is most efficient at room temperature, consistent with previous observations by Panyutin et al. (19). We have often observed strand separation of the PATRR fragment even at 37 °C.2 The temperature-induced drop in cruciform formation might be attributed to the competition for superhelix energy release, taking place between cruciform and open regions within the premelting range. We previously reported that only meiotic cells undergo this translocation (7). This prompted the hypothesis that PATRR-mediated translocations may represent errors in meiotic recombination and that the double-strand break catalytic enzyme involved in meiotic recombination might recognize a specific DNA conformation. Male meiosis might be permissive to such temperature-sensitive cruciform extrusion, and we have previously identified frequent de novo t(11;22)s in male meiosis. Unfortunately, a similar opportunity does not exist to examine female meiotic cells. We have analyzed only one case of a de novo t(11;22), and it indicated an origin in the paternal germ line.2 Thus, it is not unreasonable to imagine that PATRR-mediated translocations might occur only in male meiotic cells generated at a lower body temperature.
In vivo cruciform extrusion is still controversial. No report has directly demonstrated in vivo cruciform structures in palindromic DNA. Although previous studies addressed cruciform DNA in E. coli, others have argued against the phenomenon (18, 26, 30). Based on the fact that PATRR plasmids prepared by the non-denaturing method do not demonstrate cruciform extrusion, the favored PATRR cruciform conformation is likely to be inhibited in E. coli. Cruciform extrusion is known to require sufficient negative superhelicity. The natural negative superhelicity of a plasmid in E. coli may not afford it the opportunity to adopt a cruciform configuration. Since the replication of a plasmid may be too rapid for a transition to a cruciform arrangement to take place, this may be the reason why the observation of cruciform configurations is rare in bacteria. In mammals, the doubling time is sufficiently long to permit palindromic DNA to generate cruciform extrusion configurations. Thus, although a cruciform configuration is generally thought to be energetically unfavorable, our results indicate that the PATRR prefers to adopt a cruciform configuration even at physiological conditions. Further, recent studies have demonstrated that mammalian chromatin remodeling factors induce negative superhelical torsion of DNA, leading to cruciform extrusion of palindromic DNA (31). This suggests that palindromic DNA may adopt a cruciform conformation within the chromatin scaffold. The conformational status of genomic DNA affects many cellular functions through the regulation of DNA replication or transcription (23, 32). Thus, the elucidation of an in vivo cruciform structure may lead to a further understanding of the regulation of such cellular functions.
Acknowledgments
The authors thank Drs. M. Zannis-Hadjopoulos and G. B. Price for 2D3 anti-cruciform DNA monoclonal antibody. AFM images were measured by R. Hirota and Y. Iwazaki of the Research Institute of Biomolecule Metrology, Tsukuba, Ibaraki, Japan.
Footnotes
The abbreviations used are: PATRR, palindromic AT-rich repeat; TBE, Tris/borate/EDTA buffer; EMSA, electrophoretic mobility shift assay; AFM, atomic force microscopy.
B. S. Emanuel and H. Kurahashi, unpublished data.
This work was supported by a grant-in-aid for scientific research from the Ministry of Education, Science, Sports and Culture of Japan (to H. K.) and Grants HD26079 and CA39926 from the Charles E. H. Upham chair in Pediatrics (to B. S. E.).
References
- 1.Kurahashi H, Shaikh TH, Hu P, Roe BA, Emanuel BS, Budarf ML. Hum Mol Genet. 2000;9:1665–1670. doi: 10.1093/hmg/9.11.1665. [DOI] [PubMed] [Google Scholar]
- 2.Kurahashi H, Shaikh TH, Zackai EH, Celle L, Driscoll DA, Budarf ML, Emanuel BS. Am J Hum Genet. 2000;67:763–768. doi: 10.1086/303054. [DOI] [PMC free article] [PubMed] [Google Scholar]
- 3.Edelmann L, Spiteri E, Koren K, Pulijaal V, Bialer MG, Shanske A, Goldberg R, Morrow BE. Am J Hum Genet. 2001;68:1–13. doi: 10.1086/316952. [DOI] [PMC free article] [PubMed] [Google Scholar]
- 4.Tapia-Paez I, Kost-Alimova M, Hu P, Roe BA, Blennow E, Fedorova L, Imreh S, Dumanski JP. Hum Genet. 2001;109:167–177. doi: 10.1007/s004390100560. [DOI] [PubMed] [Google Scholar]
- 5.Kurahashi H, Emanuel BS. Hum Mol Genet. 2001;10:2605–2617. doi: 10.1093/hmg/10.23.2605. [DOI] [PubMed] [Google Scholar]
- 6.Emanuel BS, Shaikh TH. Nat Rev Genet. 2001;2:791–800. doi: 10.1038/35093500. [DOI] [PubMed] [Google Scholar]
- 7.Kurahashi H, Emanuel BS. Nat Genet. 2001;29:139–140. doi: 10.1038/ng1001-139. [DOI] [PubMed] [Google Scholar]
- 8.Dunham I, Shimizu N, Roe BA, Chissoe S, Hunt AR, Collins JE, Bruskiewich R, Beare DM, Clamp M, Smink LJ, Ainscough R, Almeida JP, Babbage A, Bagguley C, Bailey J, Barlow K, Bates KN, Beasley O, Bird CP, Blakey S, Bridgeman AM, Buck D, Burgess J, Burrill WD, O’Brien KP, et al. Nature. 1999;402:489–495. doi: 10.1038/990031. [DOI] [PubMed] [Google Scholar]
- 9.Shaikh TH, Kurahashi H, Saitta SC, O’Hare AM, Hu P, Roe BA, Driscoll DA, McDonald-McGinn DM, Zackai EH, Budarf ML, Emanuel BS. Hum Mol Genet. 2000;9:489–501. doi: 10.1093/hmg/9.4.489. [DOI] [PubMed] [Google Scholar]
- 10.Kehrer-Sawatzki H, Haussler J, Krone W, Bode H, Jenne DE, Mehnert KU, Tummers U, Assum G. Hum Genet. 1997;99:237–247. doi: 10.1007/s004390050346. [DOI] [PubMed] [Google Scholar]
- 11.Rhodes CH, Call KM, Budarf ML, Barnoski BL, Bell CJ, Emanuel BS, Bigner SH, Park JP, Mohandas TK. Cytogenet Cell Genet. 1997;78:247–252. doi: 10.1159/000134667. [DOI] [PubMed] [Google Scholar]
- 12.Debeer P, Mols R, Huysmans C, Devriendt K, Van de Ven WJ, Fryns JP. Clin Genet. 2002;62:410–414. doi: 10.1034/j.1399-0004.2002.620510.x. [DOI] [PubMed] [Google Scholar]
- 13.Spiteri E, Babcock M, Kashork CD, Wakui K, Gogineni S, Lewis DA, Williams KM, Minoshima S, Sasaki T, Shimizu N, Potocki L, Pulijaal V, Shanske A, Shaffer LG, Morrow BE. Hum Mol Genet. 2003;12:1823–1837. doi: 10.1093/hmg/ddg203. [DOI] [PubMed] [Google Scholar]
- 14.Kurahashi H, Shaikh T, Takata M, Toda T, Emanuel BS. Am J Hum Genet. 2003;72:733–738. doi: 10.1086/368062. [DOI] [PMC free article] [PubMed] [Google Scholar]
- 15.Nimmakayalu MA, Gotter AL, Shaikh TH, Emanuel BS. Hum Mol Genet. 2003;12:2817–2825. doi: 10.1093/hmg/ddg301. [DOI] [PubMed] [Google Scholar]
- 16.Gotter AL, Shaikh TH, Chieffo C, Budarf ML, Rhodes CH, Emanuel BS. Hum Mol Genet. 2003;13:103–115. doi: 10.1093/hmg/ddh004. [DOI] [PMC free article] [PubMed] [Google Scholar]
- 17.Mizuuchi K, Mizuuchi M, Gellert M. J Mol Biol. 1982;156:229–243. doi: 10.1016/0022-2836(82)90325-4. [DOI] [PubMed] [Google Scholar]
- 18.Courey AJ, Wang JC. Cell. 1983;33:817–829. doi: 10.1016/0092-8674(83)90024-7. [DOI] [PubMed] [Google Scholar]
- 19.Panyutin I, Klishko V, Lyamichev V. J Biomol Struct Dyn. 1984;1:1311–1324. doi: 10.1080/07391102.1984.10507522. [DOI] [PubMed] [Google Scholar]
- 20.Peck LJ, Wang JC. Proc Natl Acad Sci U S A. 1983;80:6206–6210. doi: 10.1073/pnas.80.20.6206. [DOI] [PMC free article] [PubMed] [Google Scholar]
- 21.Dai X, Greizerstein MB, Nadas-Chinni K, Rothman-Denes LB. Proc Natl Acad Sci U S A. 1997;94:2174–2179. doi: 10.1073/pnas.94.6.2174. [DOI] [PMC free article] [PubMed] [Google Scholar]
- 22.Vologodskaia MY, Vologodskii AV. J Mol Biol. 1999;289:851–859. doi: 10.1006/jmbi.1999.2811. [DOI] [PubMed] [Google Scholar]
- 23.Kim EL, Peng H, Esparza FM, Maltchenko SZ, Stachowiak MK. Nucleic Acids Res. 1998;26:1793–1800. doi: 10.1093/nar/26.7.1793. [DOI] [PMC free article] [PubMed] [Google Scholar]
- 24.Frappier L, Price GB, Martin RG, Zannis-Hadjopoulos M. J Mol Biol. 1987;193:751–758. doi: 10.1016/0022-2836(87)90356-1. [DOI] [PubMed] [Google Scholar]
- 25.Bell LR, Byers B. Cold Spring Harbor Symp Quant Biol. 1983;47:829–840. doi: 10.1101/sqb.1983.047.01.095. [DOI] [PubMed] [Google Scholar]
- 26.Haniford DB, Pulleyblank DE. Nucleic Acids Res. 1985;13:4343–4363. doi: 10.1093/nar/13.12.4343. [DOI] [PMC free article] [PubMed] [Google Scholar]
- 27.Shlyakhtenko LS, Potaman VN, Sinden RR, Lyubchenko YL. J Mol Biol. 1998;280:61–72. doi: 10.1006/jmbi.1998.1855. [DOI] [PubMed] [Google Scholar]
- 28.Leach DR. BioEssays. 1994;16:893–900. doi: 10.1002/bies.950161207. [DOI] [PubMed] [Google Scholar]
- 29.Lobachev KS, Gordenin DA, Resnick MA. Cell. 2002;108:183–193. doi: 10.1016/s0092-8674(02)00614-1. [DOI] [PubMed] [Google Scholar]
- 30.Lyamichev V, Panyutin I, Mirkin S. J Biomol Struct Dyn. 1984;2:291–301. doi: 10.1080/07391102.1984.10507568. [DOI] [PubMed] [Google Scholar]
- 31.Havas K, Flaus A, Phelan M, Kingston R, Wade PA, Lilley DM, Owen-Hughes T. Cell. 2000;103:1133–1142. doi: 10.1016/s0092-8674(00)00215-4. [DOI] [PubMed] [Google Scholar]
- 32.Novac O, Alvarez D, Pearson CE, Price GB, Zannis-Hadjopoulos M. J Biol Chem. 2002;277:11174–11183. doi: 10.1074/jbc.M107902200. [DOI] [PubMed] [Google Scholar]


