Abstract
A new wireless transceiver is described for recording individual neuron firing from behaving rats utilizing Bluetooth transmission technology and a processor onboard for discrimination of neuronal waveforms and associated time stamps. This universal brain activity transmitter (UBAT) is attached to rodents via a backpack and amplifier headstage and can transmit 16 channels of captured neuronal firing data via a Bluetooth transceiver chip over very large and unconstrained distances. The onboard microprocessor of the UBAT allows flexible online control over waveform isolation criteria via transceiver instruction and the two-way communication capacity allows for closed-loop applications between neural events and behavioral or physiological processes which can be modified by transceiver instructions. A detailed description of the multiplexer processing of channel data as well as examples of neuronal recordings in different behavioral testing contexts is provided to demonstrate the capacity for robust transmission within almost any laboratory environment. A major advantage of the UBAT is the long transmission range and lack of object-based line of sight interference afforded by Bluetooth technology, allowing flexible recording capabilities within multiple experimental paradigms without interruption. Continuous recordings over very large distance separations from the monitor station are demonstrated providing experimenters with recording advantages not previously available with other telemetry devices.
Keywords: Wireless recording, Neuronal data, Behaving rats, Bluetooth transceiver, Onboard microprocessor, Universal recording capacity, Multiple applications
1. Introduction
Investigators of single neuron activity in behaving animals have designed, fabricated and implemented devices for wireless recording for a number of years (Fryer et al., 1975). In recent years methods of recording and transmitting neural signals in a wireless manner have been developed and applied successfully by a number of laboratories and companies (Hawley et al., 2002; Obeid et al., 2004; Mohseni and Najafi, 2006; Parthasarathy et al., 2006; Sodagar et al., 2006; Ativanichayaphong et al., 2008). However, the range of recording in most wireless devices is usually restricted and susceptible to line of sight interruption (Wise et al., 2004; Cieslewski et al., 2006). Such restrictions prevent application to many testing situations where animals are required to traverse different spatial locations (Moser and Moser, 2008) or to perform different tasks during the same recording session (Hasselmo, 2008). We report here the successful implementation of a multichannel wireless recording device that: (1) records neural activity from freely moving animals within nearly any laboratory or open field context, (2) continues to record the same activity in different experimental contexts, (3) analyzes neural firing data onboard and transmits in a format that does not require post-transmission A/D processing, and (4) can be utilized to interact online with the animal’s performance related to transmitted neural events. A description of the device is presented with demonstration of its capacity to record and transmit within different behavioral contexts while requiring no disconnection or interruption between tasks, and to remain fully functional despite intervening physical barriers or prohibitive distances from the receiving station.
2. Materials and methods
A wireless recording device was developed within a collaborative arrangement with Triangle Biosystems Inc. (Durham, NC) that could utilize Bluetooth technology in conjunction with a local programmable interface computer (PIC) processor to transmit pre-analyzed neural activity from the brains of freely moving rats within standard laboratory testing environments as well as in unrestricted locales where normally such recording would not be possible. A patent was recently granted for our ‘Wireless Systems and Methods for the Detection of Neural Events Using Onboard Processing’ (US Patent # 7,460,904). A prototype device has been implemented to detect and transmit neural activity using the onboard processor for: (1) computer identification of neuronal action potential waveforms and timestamping of those events, which are (2) transmitted over distances that exceed the ranges of existing telemetry systems, and (3) send signals back to the device to complete an interactive loop in which recorded neural activity can be tied directly to external events controlled by the experimenter. A working prototype of the device is shown in Fig. 1 that incorporates the following features (1) a Bluetooth radio transmitter (BT), (2) a PIC processor and (3) an amplifier front end with high pass (>250 Hz) filter. The device has a 16 channel recording capacity capable with a 6.0 kHz upper frequency on each channel. This universal brain activity transmitter (UBAT) prototype has been employed in several experimental contexts to test the feasibility of application in multiple laboratory environments using freely moving, behaving rodents. Examples of data recorded with the UBAT device are presented in the Results to demonstrate its capacity to reliably depict and transmit multi-neuron recorded data from hippocampal array electrodes in rats performing tasks within several different laboratory recording circumstances in order to illustrate implementation in almost any context in which an animal with indwelling electrodes is to be tested.
Fig. 1.
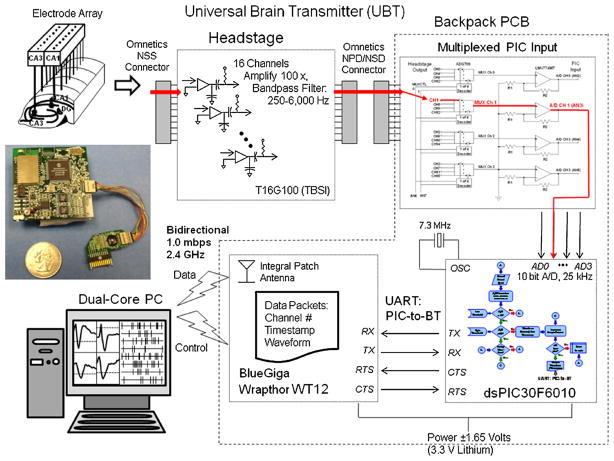
Diagram of universal brain activity transmitter (UBAT). Photo at left shows the device prototype board constructed of discrete components, along with the 16 channel headstage and cable that connects to the hippocampal array electrode (top left). The diagrams at center and right illustrate each stage of processing and transmission. Microvolt-level neural signals are amplified 100× and bandpass filtered from 250 Hz to 6.0 kHz by a modified T16G100 headstage (top center TBSI Inc.). The 16 headstage recording channels are multiplexed to 4 processor input channels using two dual ADG709 decoders (top right). Final 40× amplification stage is applied prior to input to the dsPIC30F6010 programmable interface computer (PIC). Multiplexed neural signals are input to high-speed 10 bit analog-to-digital (A/D) converters with 25 kHz sampling integrated in the dsPIC30F6010. The PIC processor (lower right) is programmed to detect neuronal waveforms, and then continuously transmit their timestamps and, if requested the waveforms also, via the two-way Universal Asynchronous Receiver Transmitter (UART) link with the Bluetooth v2.0 transceiver (BlueGiga Wrapthor WT12). The UBAT is powered by a 3.3 V lithium battery small enough to allow mounting on the animal (Fig. 3). Customized programs written with Labview modular programming language convert Bluetooth transmitted data to online computer display of real-time signals delayed only 0.5–1.8 s from actual occurrence.
2.1. UBAT components
The UBAT prototype consists of three main parts or sections: (A) a headstage that amplifies and filters neural signals from chronically implanted microelectrodes, (B) a backpack printed circuit board (PCB) containing the filter, amplifier, PIC and Bluetooth transmitter, and (C) a commercial-off-the-shelf Bluetooth v2.0 universal serial bus receiver (Fig. 1). Design and operation of each functional component in Section 3 is described with associated components below.
2.1.1. Power and clock
Power for the UBAT backpack is provided by a single lithium-ion polymer battery (nominal 3.3 VDC). The voltage is divided and regulated to provide ±1.65 VDC power for signal conditioning and amplification of biphasic neural electrical signals. The PIC and Bluetooth modules are powered by the full 3.3 V source, while the amplifier, filter, multiplexer and analog inputs operate on ±1.65 V. A 7.3 MHz crystal oscillator (CSX750F) is used to provide a processor clock for the PIC.
2.1.2. Neuronal signal amplification and filtering
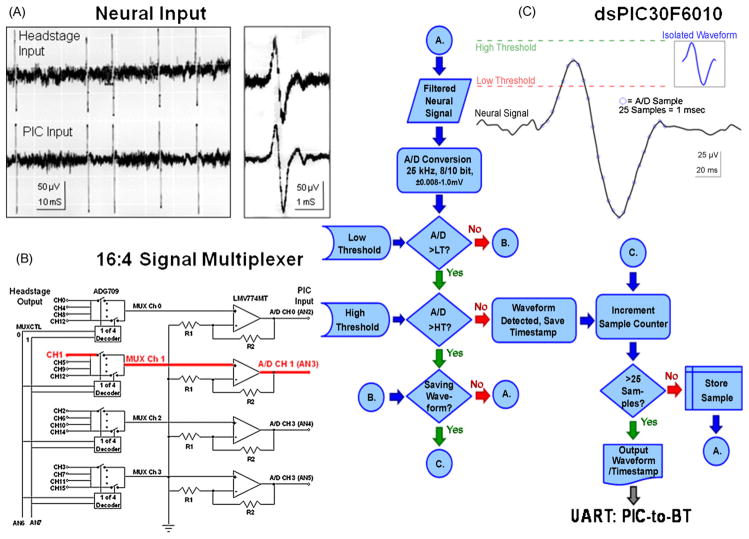
Continuous microvolt-level electrical signals from implanted metal microelectrodes (Fig. 1, electrode array) are amplified 100× via a headstage incorporating a proprietary 16-channel very-large-scale-integration (VLSI) application-specific integrated circuit (ASIC) modified TBSI T16G100 headstage (photo and diagram in Fig. 1). The headstage is wired directly to the UBAT backpack and provides input to a 16-to-4 channel multiplexor to reduce demand on the PIC processor in the subsequent processing stage (Mohseni and Najafi, 2006). The traces in Fig. 2A show a series of neural spikes recorded simultaneously at the headstage (1) input (Fig. 1) and (2) output feeding into the PIC A/D inputs. Fig. 2B shows the 16:4 channel multiplexor consisting of two ADG 709 dual 1-of-4 decoders (controlled by the PIC) that multiplex the 16 headstage output channels to 4 PIC input channels for further processing. Each of the four multiplexer channel outputs is connected to a single-pole high pass filter with 40× gain (Fig. 2B). Frequency response is determined by 250 Hz high pass filtering at the headstage and 6–6.5 kHz upper limit determined by the analog-to-digital sampling frequency of the PIC. The four multiplexed, conditioned signal channels are input to A/D channels AN2-AN5 of the PIC, with A/D channels AN0-AN1 used for programmable gain setting and AN6-AN7 used to provide the 2-bit multiplexer channel selector for the ADG709 decoders.
Fig. 2.
Stages of UBAT processing. (A) Oscilloscope tracings of neuronal spike input signals. Top trace is recoded at input to the T16G100 headstage and illustrated at raw signal amplitude (±50 μV). Bottom trace is the same signal after headstage filtering (250 Hz to 6.0 kHz) and conditioning prior to input to the dsPIC30F6010 A/D processing stage (Fig. 1). Expanded traces at right illustrate similarity of neuronal waveform even after processing through respective stages of the circuit (waveform in C). (B) Block circuit diagram for 16:4 channel multiplexer shown in Fig. 1. Bold red line indicates specific signal path (shown also in Fig. 1) for single neuron events (waveforms) identified by input channel (Ch. 1). (C) Diagram of spike waveform detection in PIC. Filtered, amplified neuronal waveforms are digitized at 25 kHz and compared to adjustable threshold voltages for an “amplitude window” corresponding to action potential “peak” voltage. Waveform amplitudes between the low and high threshold settings generate a timestamp that records time of occurrence. The neuron waveform, consisting of 5 A/D samples before and 20 samples after threshold crossing, is saved for further processing. A data packet consisting of channel number, timestamp and waveform is assembled for transfer to the Bluetooth transceiver, via complementary Universal Asynchronous Receiver Transmitter (UART) ports on both the dsPIC30F6010 and WT12 Bluetooth transceiver, and the data packet is then transmitted to the host computer (Fig. 1).
2.1.3. Onboard PIC processor for analog-to-digital conversion and spike-thresholding
Each of the 16 input channels are digitized, four at a time, by high speed 10 bit, 25 Hz sampling A/D convertors incorporated into the dsPIC30F6010 chip. The two least significant bits are discarded, yielding jitter-free 8-bit representation of input signal with 0.012 mV resolution. Since the input signals are filtered and amplified 400×, the PIC is capable of discriminating raw signals in the range of −4.125 to +4.125 mV in increments of 0.032 mV, however in this application the programmable A/D gain settings of the PIC are set to an effective range of ±1.0 mV inputs in 0.008 mV increments.
The A/D conversion and spike waveform detection cycle for a given recording channel of the UBAT is diagrammed and illustrated in Fig. 2 and is similar to other reported onboard microprocessors (Sodagar et al., 2006). Filtered, amplified signals (Fig. 2A) from each electrode channel (waveform trace in Fig. 2C) are converted from analog-to-digital values by successive approximation (blue dots on waveform) then compared to the spike detection thresholds programmed via the Bluetooth control interface. If the A/D sample is greater than the low threshold (red dashed line, inset Fig. 2C), it is then compared with the high threshold limit (green dashed line, inset). If the A/D sample is less than the low threshold, or greater than the high threshold, the PIC will next determine whether a threshold crossing was previously detected (“B” in flow diagram in Fig. 2C) and check whether the current A/D sample should be saved (“C”). If not, processing will resume for the next channel, next A/D sample at “A”. Once a threshold crossing is detected, the timestamp of the current A/D sample is stored, and a 25 sample counter started, to preserve the previous 5 and subsequent 20 samples. Each of the 16 channels is processed one sample at a time by selecting the first bank of 4 inputs from the multiplexer (Fig. 2B), examining one sample from each of the 4 A/D inputs (AN2-AN5) then commanding the multiplexer to switch to the next bank of 4 inputs, until one A/D sample has been processed for each of the 16 channels in the headstage (Mohseni and Najafi, 2006). Once all channels have been examined, the process repeats by setting the multiplexer back to the first bank of inputs and proceeds in temporal sequence to the next A/D sample from each channel. Processing time to examine each channel is approximately 1.5 ms, with approximately 25 ms required to examine all 16 channels. The A/D sampling clock is set to 19 cycles of the 7.3 MHz CSX750F oscillator, approximating a 25 kHz sampling rate.
Following threshold detection on a given channel, the PIC retains 25 A/D samples comprising a detected spike waveform of approximately 1.0 ms duration (waveform in Fig. 2C). The bidirectional Universal Asynchronous Receiver Transmitter (UART) of the onboard PIC processor can be instructed via the Bluetooth transceiver to: (1) store and transmit all isolated neuronal waveforms on a channel-by-channel basis, or (2) to retain and transmit only the timestamps and channel identity for each detected waveform. In timestamp-only mode, the channel number and timestamp are sent immediately from the PIC to the Bluetooth transceiver. In waveform-mode, the PIC retains spike waveforms and transmits the packet when there is sufficient bandwidth available on the Bluetooth transceiver for the additional data with the constant timestamp transmission. For more complex analyses such as required with the use of tetrodes (Gray et al., 1995) in hippocampus, the program resident in the PIC processor could be modified to perform amplitude ratios between extracted waveforms on each channel.
The UBAT does not record field potential data because of the high-pass (250 Hz to 6.0 kHz) filter used in the headstage (Fig. 1). However this capability is inherent within the device with minor modifications to bandpass filter parameters and a different analysis program resident in the PIC processor (Fig. 3) for detection of field potential characteristics.
Fig. 3.
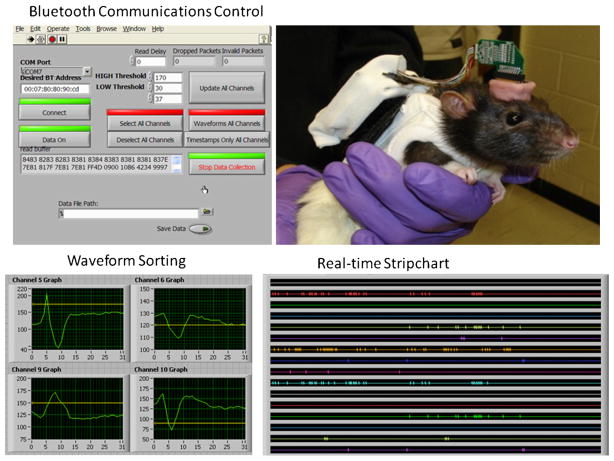
Photographs depict various aspects of UBAT function. Photo at upper right shows UBAT on a rat with headstage and battery mounted on backpack that contains prototype board shown in Fig. 1. Upper left shows monitor display of UBAT user interface for controlling Bluetooth connection state, program variable settings, and monitoring of the serial data stream containing channel identification, timestamps, waveform amplitudes thresholds, and transmission error indicators. Lower Left shows online display of captured neural waveforms which can range across all channels and are updated continuously or on demand. Each display shows the baseline and upper amplitude threshold level set for each captured waveform (Fig. 2). Photo at lower right shows online stripchart display of the UBAT captured waveform timestamps in real-time display of all channels. All display programs were custom programmed in Labview (National Instruments) designed specifically to receive PIC processor A/D converted signals from UBAT.
2.1.4. Bluetooth wireless transmission
Transmission of data packets from the Bluetooth transceiver is via the integrated UART of the PIC connected to complementary UART inputs of a Wrapthor WT12 Bluetooth v2.0 transceiver commercial-off-the-shelf integrated circuit (Cieslewski et al., 2006). The Bluetooth transceiver is configured as a wireless serial port and utilizes the UART transmit and receive functions of the respective PIC and Bluetooth devices. The Bluetooth base station consists of a USB Bluetooth v2.0 “dongle” on a desktop or laptop “host” computer. All data received by the Bluetooth transceiver from the PIC is automatically transmitted to the host computer, likewise any commands received from the host computer are passed through to the PIC. Effective serial transmission rate is 115,200 bits per second, allowing continuous transmission of 20–30 neuronal (i.e. 1.0 ms duration) waveforms and associated timestamps per second per channel for all 16 channels. The Bluetooth transceiver is responsible for several unique properties of the UBAT: (1) spread-spectrum 2.4 GHz radio transmission provides a robust signal capable of transmission distances in excess of 10 m; (2) digital transmission is error-correcting both in hardware (via spread-spectrum broadcast) and software (checksums and packet delimiters); (3) UART connections allow Bluetooth transceiver to act as a wireless serial port, simplifying interface programming; (4) host interface uses commercial-off-the-shelf Bluetooth v2.0 transceivers plugged into the USB interface of either desktop or laptop computer; (5) two-way Bluetooth and UART communications allow real-time command and control of the PIC program and spike detection algorithm by the host computer. Control and communication with the UBAT is via a custom written interface Labview program using the interface platform (National Instruments, Fig. 3). Data transmission from the UBAT consists of a variable length data packet consisting of a packet-start identifier (1 byte), packet size (1 byte), channel ID (1 byte), timestamp (5 bytes, binary-coded-decimal), waveform data (typical 25, up to 48 bytes). Packet size is thus dependent on whether or not waveforms are transmitted for each detection event, or stored and transmitted later, as well as the number of waveforms stored. The range from 8 bytes in timestamps-only transmission mode to 56 bytes in waveform transmission mode makes a considerable difference with respect to speed of transmission. Data transmission to the UBAT from the host consists of keywords and data values to set high and low thresholds (per channel), waveform vs. timestamp-only transmission (per channel), channel off/on, number of waveform samples to store (all channels), and program stop/start commands. These commands demonstrate the bidirectional capacity of the system and indicate that neuronal signals can be analyzed and a resident program in the PIC can use this information to activate other onboard devices or transmit a signal to a behavioral device via the Bluetooth transceiver (Figs. 2 and 3). This capability links the neuronal signals that are processed by the PIC to other aspects of the experimental protocol creating a closed loop between neuronal activity and other factors that can affect neural processing.
3. Results
3.1. Implementation in behaving animals
Fig. 3 shows the UBAT prototype as it currently is employed with behaving rats. The prototype containing all electronic components is mounted with the ±1.65 V lithium battery on the back of the animal using a small non-restrictive Velcro-cloth harness. Attachment to the multi-electrode connector on the animals’ head is through a PCB headstage connector and short 10 cm 16 channel cable. The PCB contains amplifiers and filters mounted on the head-stage plugged into the multi-electrode connector on the animal, while the cable connects headstage and UBAT backpack. The entire assembly including battery weighs 60.3 g (16.5 g PCB and head-stage, 43.8 g battery pack) and is carried easily by adult (250–400 g) rats. In the current size and battery configuration the time of operation for most behavioral recording sessions, heat generation by the backpack battery power supply has not been a factor. The battery/circuit board assembly (backpack) is placed inside a nylon pouch and attached to a Lomir Biomedical Inc. rodent jacket by a large Velcro patch and neither the battery nor the circuitry are in direct contact with the animal. We have tested and found no discernable change in temperature through these materials when the circuitry is in operation irrespective of time. While it is clear that the device weighs more than most transceivers, most of the 60 g weight is due to the Lithium-ion-polymer battery capable of 5+ hours continuous operation, battery. Smaller batteries that allow only 2–3 h reduce the backpack weight to 40 g. We have found that rats >250 gm in body weight are able to carry the backpack and perform exploratory or delayed-non-match-to-sample behaviors (shown below) for up to 40 min without problems with locomotion or lack of motivation. Acclimation to wearing the rodent jacket and backpack takes about a week, and is due more to adapting to the jacket than the added weight of the backpack. In addition we have found that animals are capable of adapting to the extra weight of the device in behavioral tasks for which they are motivated to perform for palatable and scheduled rewards within their daily routine.
The real-time display for UBAT control is shown at the upper left in Fig. 3, indicating the several features that can be continuously monitored in a wireless interactive manner. Currently the device has the capacity to record 16 separate channels of neural activity in the range of 250 Hz to 6.0 kHz, with an electronic “window” for each channel to isolate individual neural waveforms via threshold adjustments for amplitude compared to baseline (Fig. 2). The waveforms and timestamps are fed to a Wrapthor transmitter/receiver combination that acts as a wireless high-speed serial port that receives digitized signals to provide a real-time display of all channel data. Neuronal waveform isolations are shown in Fig. 3 (lower left) for 4 (out of 11) different neurons recorded from the hippocampus. The stripchart at the lower right in Fig. 3 displays the time-locked activity of the isolated neurons as the information is received and the timestamps decoded in real-time format.
3.2. Onboard recording and isolation of neuronal activity
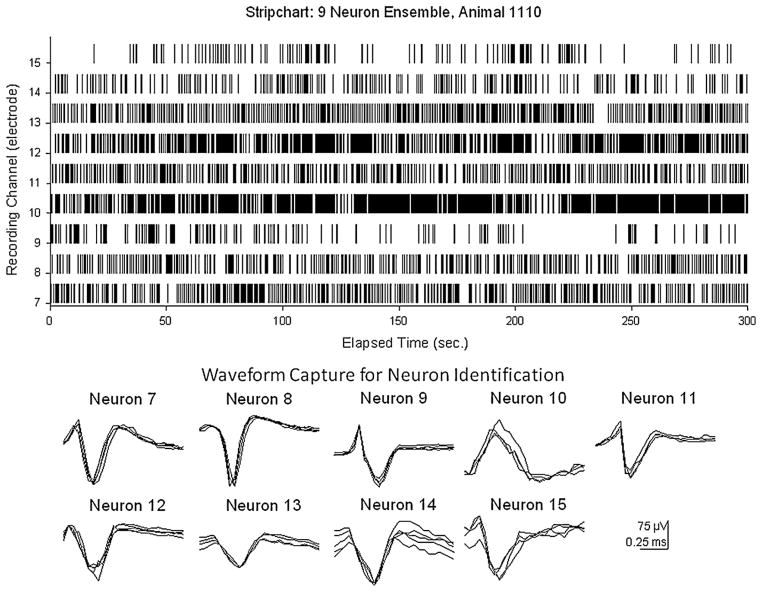
Fig. 4 provides a detailed representation of the isolated waveforms from the dsPIC processor and the individual timestamps of each captured waveform over a continuous 5 min recording period to demonstrate (1) the differences in waveshape and amplitudes demonstrate the flexibility in the windowing and thresholding functions in the onboard PIC processor (Fig. 2), (2) the consistency of recording neural events over time is illustrated by the superimposition of several extractions of the 9 different isolated waveforms from each channel over the same time period and (3) the lack of disruption of firing in these 9 different hippocampal neurons indicated by the continuous receipt of spike events (timestamps) over the uninterrupted 5 min recording period (Fig. 4, upper stripchart).
Fig. 4.
Data transmitted by UBAT after on-board isolation of multichannel neuronal firing by dsPIC30F6010 processor. Transmitted data consists of individual waveforms and associated timestamps. Stripchart (top) shows continuous display of timestamps (tick marks) for 9 individual neurons recorded on separate channels (7–15) of UBAT over a 5 min (300 s) period. Waveforms corresponding to firing of individual neurons from each channel are shown below. Multiple waveform samples are superimposed from different segments of 5 min record to show UBAT reliability with respect to reproduction of PIC processor isolated characteristics. Waveforms and timestamps were broadcast by Bluetooth transceiver (Fig. 1).
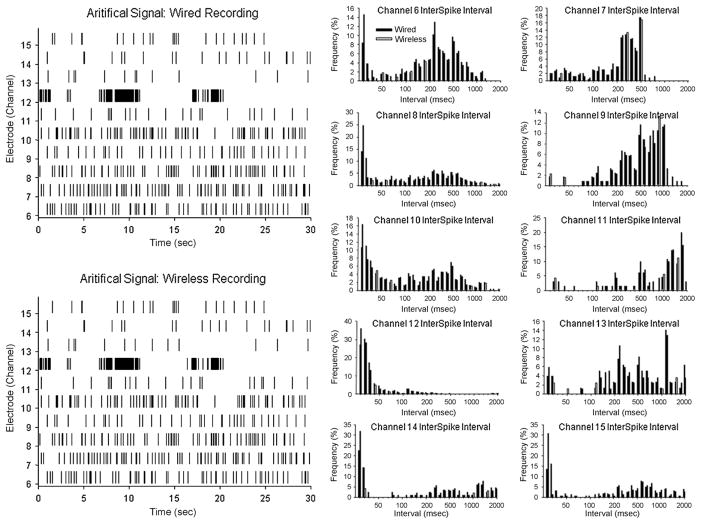
Since no other reports of Bluetooth transmitted neural information are available, it was necessary to empirically determine the validity and/or fidelity of the signal coming from the UBAT by comparing it to the exact same signal recorded via a direct wire connection to the source. In addition it was important that the signal used for comparison represent neuronal activity that the UBAT was designed to capture and transmit. Therefore a stored digitized version of raw wideband neural activity (0.5 Hz to 10.0 kHz) previously recorded from rat hippocampus via cable connection, was played into the UBAT, transmitted and then analyzed for comparison with the signal fed into a standard direct wire recording system. The exact same digitized signal was input to a standard wired (cable-based) neuron recording system (Plexon Inc.) with the same bandpass filter settings as the UBAT. Fig. 5 shows these comparisons in the form of stripcharts and interspike interval histograms for each channel of data in the original digitized raw signal. It is clear that the data recorded with the UBAT were matched closely to recordings of the same signal from the cable-based Plexon system, which provides convincing evidence that with respect to the performance of the wired Plexon system, the onboard UBAT recording, isolation and wireless transmission did not change (1) the waveform isolation properties, or (2) timestamps of the digitized raw input signal. Fig. 5 also clearly indicates that the UBAT was capable of tracking the input signal over a wide range of frequencies in each channel and that alterations in the frequencies on some channels did not affect the Bluetooth transmitted representation of signals on other channels.
Fig. 5.
Direct comparison of UBAT vs. direct wired recording of neural signals. The raw data consisted of a digitized multichannel neural signals previously recorded from the hippocampus of a rat, with a frequency range (DC to 10 kHz) that contained neuronal spike activity imposed on higher amplitude lower frequency slow potentials to mimic real online input from rat brain to both recording devices. The UBAT output was compared with output from a Plexon Instruments cable headstage and recording system with matched bandpass filter settings to the UBAT (250 Hz to 6.0 kHz). Left: the exact same temporal segments of rat brain digitized signal were fed into both systems (wired recording system on top, UBAT on the bottom) and the timestamps of discriminated spike events (indicated in the stripcharts) compared. Right: time interval histograms derived from the same input signal are compared for the UBAT wireless system (gray bars) and Plexon Inc. wired-cable recordings (black bars), for each channel. The close match of the distributions indicates the accuracy of UBAT recording and wireless transmission for the same neural spike information recorded directly through the wired recording system. The only discrepancy between the two systems was that very high frequency events which occurred <10 ms apart which were shown more consistently in the wired system because of a modifiable rejection algorithm programmed into the onboard UBAT PIC processor for recording typically lower frequency hippocampal neural events.
3.3. Versatility of UBAT in the laboratory
Another important feature of the UBAT in the laboratory is the capacity to move the animal being recorded to different experimental setups without disconnecting and reconnecting to a different receiving station. This has a decided advantage over short-range telemetry systems since there is no need to duplicate recording systems in restricted laboratory locations. The recordings shown below were obtained from the same rat in different laboratory rooms that housed different experimental features, each related to a unique behavioral context for collecting data. The rat was moved from one location to the next without interruption or re-positioning of the receiver or monitor workstation and the same neurons recorded in each circumstance and location.
3.4. Comparison of UBAT transmitted activity with established neuronal correlates of behavior
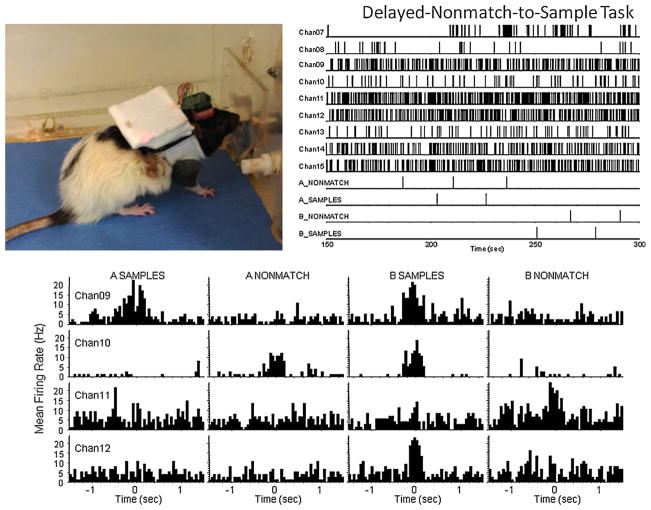
One of the important tests of the versatile UBAT telemetry system was to ensure that recorded activity in a standardized behavioral context was similar to that recorded with direct cable connection. Fig. 6 shows hippocampal activity recorded from a rat performing a delayed non-match to sample (DNMS) task (photo upper left) in a standard operant chamber with associated UBAT transmitted neural activity correlated with task-related behavioral events (lever presses that alternate from sample to non-match phase with a delay of 1–30 s interspersed). The stripchart at the upper right illustrates the firing frequencies of the cells shown in the perievent histograms (PEHs) below for the neurons with task-related firing correlates (reviewed in Hampson et al., 2008). The firing patterns are similar to well-established prototypical functional cell types (FCTs) for this task described in many reports from this laboratory (Song et al., 2007; Zanos et al., 2008). In addition to the detection of task-related firing, the photo shows that UBAT transmission of the data transcended the confines of the enclosed soundproof chamber, the walls of a separate room (Fig. 6) and other factors including concomitant operation of video and electronic equipment in the same behavioral testing chamber. The reliability of the correlated firing patterns in Fig. 6 illustrate the robustness of the UBAT to record and transmit non-distorted neural activity within the confines of nearly any currently utilized rodent isolation testing chamber.
Fig. 6.
UBAT recording of neural activity associated with performance of delayed-non-match-to-sample (DNMS) task. Upper left: UBAT transmitter mounted on rat performing DNMS task. Upper right: continuous recorded neural activity shown in stripchart for all channels. Bottom: perievent histograms (PEHs) show examples of previously demonstrated hippocampal functional cell types (FCTs; Deadwyler and Hampson, 2004) recorded from the indicated channels (in stripchart above) via wireless UBAT system in the same behavioral task. The occurrence of each behavioral event is indicated at 0.0 s in the PEH with associated averaged neural activity for ±1.5 s. Behavioral events were synchronized to the transmitted signal via timestamps sent directly to UBAT monitor station.
3.5. UBAT recording in open field with video tracking
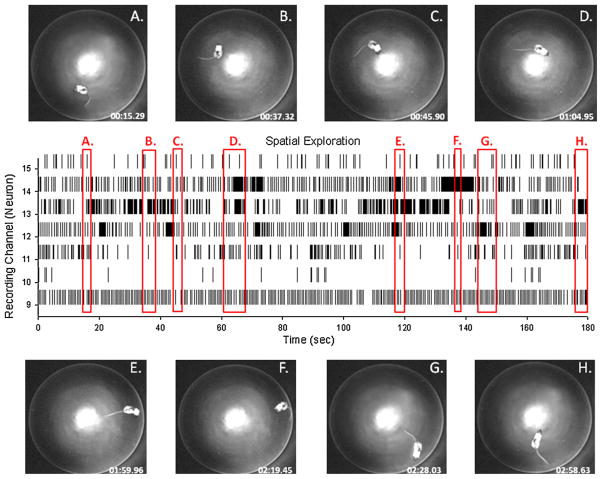
Another advantage of the UBAT is the capacity to test the same neuronal activity in two different environmental or behavioral contexts by simply moving the animal without concern for maintaining recording capacity via disconnection or loss of signal transmission. Fig. 7 shows recordings from the same rat trained in the DNMS task in Fig. 6 that was transported to the circular open field hippocampal “place cell” testing apparatus while employing the same laboratory wireless workstation for monitoring the UBAT. Within the chamber hippocampal neural recordings are displayed continuously (stripchart channels 9–15) as the animal is tracked by a video monitor above the circular test field during traversal to different sectors or locations for correlation with spatial firing attributes (Cacucci et al., 2004). The output of the UBAT and video camera were monitored and integrated by the same Bluetooth workstation and displayed conjointly in Fig. 7. Firing within the different sectors of the chamber (photos A–H) is depicted by the same labeled vertical red rectangles (A, B, C, etc.) that capture the segments of the stripchart (correlated timestamps) in which firing occurred when the animal occupied that sector of the open field test environment.
Fig. 7.
Implementation of UBAT in open field test for spatial firing correlates of hippocampal neurons. (A–H) Overhead photos of rat in different spatial locations in circular open field recording chamber. Center display shows firing during spatial exploration via continuous stripchart records from 7 different neurons (channels 9–15) with red rectangles indicating entry and exits from locations labeled in overhead photos. UBAT transmission and receipt of signal utilized the same monitoring station as the DNMS task in Fig. 6; however, the rat and apparatus were located in a different room in the laboratory, indicating lack of necessity of line of sight orientation between the UBAT and monitoring station.
3.6. UBAT capacity for maintaining functional connections over large distances
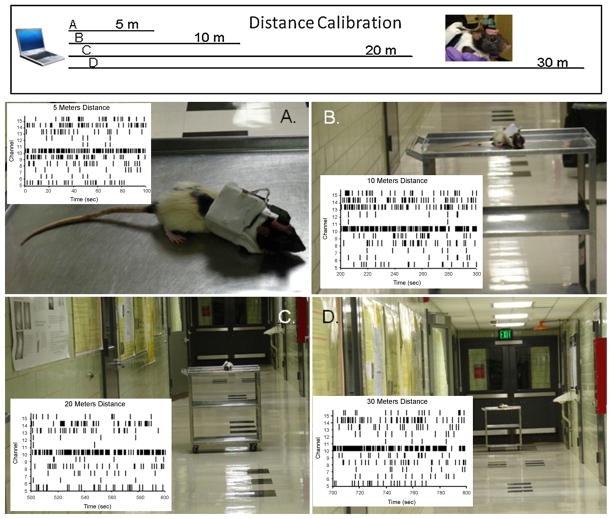
A final demonstration of the advantage of the UBAT system is illustrated in Fig. 8 which shows the same neural signals being recorded from a rat placed on a cart that is moved successive distances away from the Bluetooth laptop workstation. The distances were increased from 5 to 30 m down a hallway as shown in photos A–D in which the receiver/monitor station was located at one end. The insets in each photo show stripchart recordings of the same 10 neuron firing traces at distances of 5, 10, 20 and 30 m to indicate persistence of the same neural signals over the more than 6 fold increase in distance from the Bluetooth workstation. The relationship of distance to signal loss in most telemetry system is determined by line-of-sight with very little compensation when a visual obstruction is present between transmitter and receiver (Wise et al., 2004). The UBAT was shown to be immune from such physical obstruction in Figs. 6 and 7 and, as shown in Fig. 8, is combined with an expanded range of recording distances that allow several advantages for testing brain activity under conditions that are more realistic with respect to natural environments.
Fig. 8.
Demonstration of exceedingly long range recording capacity of UBAT. (A–D) Recording from unrestrained rat on cart moved successive distances: 5, 10, 20 and 30 m respectively, down hallway separating rat from monitoring workstation fixed in the same place for all recording distances. Records of neural firing (stripcharts) at each distance are shown in bottom right corner of photos that depict distance of UBAT and rat from the Bluetooth monitoring station.
4. Conclusions
The universal brain activity transmitter (UBAT) prototype described here was fabricated by TBSI Inc. with extensive interaction with the authors on design and development of programming features. The device is not commercially available at this time but is being reformatted and considered for future marketing. Specifics on how the UBAT is linked to recording electrodes (Fig. 1), the capacity for recording and broadcasting single waveforms and timestamps as well as the basis for bidirectional interaction via the Bluetooth workstation (Fig. 2), are available. The UBAT has multiple potential applications in laboratory and other (non-laboratory) environments for most species of experimental animals including mice, rats, NHPs as well as humans. The potential to link recorded activity to biologically dependent events such as operation of artificial limbs (Obeid et al., 2004), electrical stimulation within connected brain regions (Ativanichayaphong et al., 2008), etc. is inherent in the capacity of the UBAT onboard PIC processor. However, the primary advantage of the UBAT device is the range over which neural signals can be transmitted reliably which provides for different laboratory contexts and capacity to conduct small or large animal recording studies. Given the fact that a single laptop computer is all that is required for monitoring UBAT transmission, it is likely that such minimization could provide the means to reduce costs of performing complex recording experiments while maintaining the flexibility to alter the recording environment without interruption of ongoing behavior or experimental protocols.
Acknowledgments
The authors would like to acknowledge the valued assistance of Triangle Biosystems Inc., Andrew Sweatt, George McLoud and Chad Collins. This work was supported by the DARPA HAND Program, a subcontract from BMES NSF ERC and National Institutes of Health Grants DA06634, 2R01DA07625 and DA00119, to S.A.D.
References
- Ativanichayaphong T, He JW, Hagains CE, Peng YB, Chiao JC. A combined wireless neural stimulating and recording system for study of pain processing. J Neurosci Methods. 2008;170:25–34. doi: 10.1016/j.jneumeth.2007.12.014. [DOI] [PubMed] [Google Scholar]
- Cacucci F, Lever C, Wills TJ, Burgess N, O’Keefe J. Theta-modulated place-by-direction cells in the hippocampal formation in the rat. J Neurosci. 2004;24:8265–77. doi: 10.1523/JNEUROSCI.2635-04.2004. [DOI] [PMC free article] [PubMed] [Google Scholar]
- Cieslewski G, Cheney D, Gugel K, Sanchez JC, Principe JC. Neural signal sampling via the low power wireless pico system. Conf Proc IEEE Eng Med Biol Soc. 2006;1:5904–7. doi: 10.1109/IEMBS.2006.260506. [DOI] [PubMed] [Google Scholar]
- Deadwyler SA, Hampson RE. Differential but complementary mnemonic functions of the hippocampus and subiculum. Neuron. 2004;42:465–76. doi: 10.1016/s0896-6273(04)00195-3. [DOI] [PubMed] [Google Scholar]
- Fryer TB, Sandler H, Freund SW, McCutcheon EP, Carlson EL. A multichannel implantable telemetry system for flow, pressure, and ECG measurements. J Appl Physiol. 1975;39:318–26. doi: 10.1152/jappl.1975.39.2.318. [DOI] [PubMed] [Google Scholar]
- Gray CM, Maldonado PE, Wilson M, McNaughton B. Tetrodes markedly improve the reliability and yield of multiple single-unit isolation from multi-unit recordings in cat striate cortex. J Neurosci Methods. 1995;63:43–54. doi: 10.1016/0165-0270(95)00085-2. [DOI] [PubMed] [Google Scholar]
- Hampson RE, Simeral JD, Deadwyler SA. Neural population recording in behaving animals: constituents of the neural code for behavior. In: Holscher C, Munk MH, editors. Neural population encoding. Cambridge, UK: Cambridge University Press; 2008. [Google Scholar]
- Hasselmo ME. Grid cell mechanisms and function: contributions of entorhinal persistent spiking and phase resetting. Hippocampus. 2008;18:1213–29. doi: 10.1002/hipo.20512. [DOI] [PMC free article] [PubMed] [Google Scholar]
- Hawley ES, Hargreaves EL, Kubie JL, Rivard B, Muller RU. Telemetry system for reliable recording of action potentials from freely moving rats. Hippocampus. 2002;12:505–13. doi: 10.1002/hipo.10040. [DOI] [PubMed] [Google Scholar]
- Mohseni P, Najafi K. A 1-MHz, 5-Kb/s wireless command receiver for electronic site selection in multichannel neural biopotential recording. Conf Proc IEEE Eng Med Biol Soc. 2006;1:6241–4. doi: 10.1109/IEMBS.2006.260651. [DOI] [PubMed] [Google Scholar]
- Moser EI, Moser MB. A metric for space. Hippocampus. 2008;18:1142–56. doi: 10.1002/hipo.20483. [DOI] [PubMed] [Google Scholar]
- Obeid I, Nicolelis MA, Wolf PD. A multichannel telemetry system for single unit neural recordings. J Neurosci Methods. 2004;133:33–8. doi: 10.1016/j.jneumeth.2003.09.023. [DOI] [PubMed] [Google Scholar]
- Parthasarathy J, Hogenson J, Erdman AG, Redish AD, Ziaie B. Battery-operated high-bandwidth multi-channel wireless neural recording system using 802.11b. Conf Proc IEEE Eng Med Biol Soc. 2006;1:5989–92. doi: 10.1109/IEMBS.2006.259578. [DOI] [PubMed] [Google Scholar]
- Sodagar AM, Wise KD, Najafi K. A neural signal processor for an implantable multi-channel cortical recording microsystem. Conf Proc IEEE Eng Med Biol Soc. 2006;1:5900–3. doi: 10.1109/IEMBS.2006.259285. [DOI] [PubMed] [Google Scholar]
- Song D, Chan RH, Marmarelis VZ, Hampson RE, Deadwyler SA, Berger TW. Nonlinear dynamic modeling of spike train transformations for hippocampal–cortical prostheses. IEEE Trans Biomed Eng. 2007;54:1053–66. doi: 10.1109/TBME.2007.891948. [DOI] [PubMed] [Google Scholar]
- Wise KD, Anderson DJ, Hetke JF, Kipke DR, Najafi K. Wireless implantable microsystems: high-density electronic interfaces to the nervous system. Proc IEEE. 2004;92:76–97. [Google Scholar]
- Zanos TP, Courellis SH, Berger TW, Hampson RE, Deadwyler SA, Marmarelis VZ. Nonlinear modeling of causal interrelationships in neuronal ensembles. IEEE Trans Neural Syst Rehabil Eng. 2008;16:336–52. doi: 10.1109/TNSRE.2008.926716. [DOI] [PMC free article] [PubMed] [Google Scholar]


