Abstract
Protein libraries are essential to the field of protein engineering. Increasingly, probabilistic protein design is being used to synthesize combinatorial protein libraries, which allow the protein engineer to explore a vast space of amino acid sequences, while at the same time placing restrictions on the amino acid distributions. To this end, if site-specific amino acid probabilities are input as the target, then the codon nucleotide distributions that match this target distribution can be used to generate a partially randomized gene library. However, it turns out to be a highly nontrivial computational task to find the codon nucleotide distributions that exactly matches a given target distribution of amino acids. We first showed that for any given target distribution an exact solution may not exist at all. Formulated as a constrained optimization problem, we then developed a genetic algorithm-based approach to find codon nucleotide distributions that match as closely as possible to the target amino acid distribution. As compared with the previous gradient descent method on various objective functions, the new method consistently gave more optimized distributions as measured by the relative entropy between the calculated and the target distributions. To simulate the actual lab solutions, new objective functions were designed to allow for two separate sets of codons in seeking a better match to the target amino acid distribution.
INTRODUCTION
Protein engineering often requires protein combinatorial libraries to investigate novel proteins, which are essential for all aspects of protein engineering, particularly for drug discovery. More than 50% post-1999 FDA-approved drugs are proteins or molecules interacting with proteins. Construction of a desired library with special properties (such as high affinity, human-like antibodies, etc.) is crucial for drug development. Libraries of variants at specific positions in proteins and antibodies are important for protein and antibody engineering and optimization (1–3).
Various strategies exist for the design of variants at codon level. A common approach is total randomization by using degenerate or mixed-base codons. For example, a protein position can be encoded by NNK (N = equal molar mix of A, C, G and T, and K = equal molar mix of G and T). There are several disadvantages to this approach. First, there is a high percentage of stop codons, which would limit the number of functional clones in a library. Second, a high percentage of Cys in the library often leads to covalent modifications, thus resulting in undesirable protein structures. Third, the amino acid distribution in the randomized positions is fixed, which can lead to unnatural and undesired amino acid sequences (e.g. WWW) to be present at high levels.
Under certain circumstances, it is advantageous or desirable that certain positions of the protein have specific distribution of the amino acids when libraries of mutants are created in protein engineering efforts (4). In addition, a species-specific codon or a user-defined codon usage is important for such a library. The advantages of the designed XYZ codon versus NNK should be apparent by comparison. At least four algorithms for deriving such XYZ codons and partially random gene libraries have been published (5–9). (Where XYZ codons are codons in partial random genes where the A, C, G and T nucleotide probabilities for each of the three codon positions can be set to any value between 0 and 1). Wet lab methods using phosphoramidites to synthesize ensembles of nucleotide sequences according to arbitrary nucleotide probabilities have also been devised (6).
In order to develop this high fidelity, codon-specific library and eliminate nonfunctional codons (e.g. stop codons), a computational tool is needed for gene library design. In this article, we explored some new algorithms and automate these processes. In addition, we developed a codon optimization strategy using two separate sets of codons to match the target amino acid distribution in order to further improve current production of libraries of engineered combinatorial proteins such as antibodies.
METHODS
We first show that for abundantly many target distributions of amino acids there simply do not exist possible nucleotide distributions that can generate the amino acids exactly matching the target protein distribution. Because of this difficulty, the design of XYZ codons for any given target can be best addressed in an approximate way: to find the nucleotide distributions such that the calculated distribution of amino acids, subject to genetic code constraints, is close enough to the target distribution. Theoretically, if a distance measure, or called ‘cost’ as in LaBean and Kauffman (7), between the two distributions can be defined, it can be used as an objective function, and finding the XYZ codons most fitting the target distribution amounts to optimizing the objective function.
Unrealizable target distributions
Let Ptarget = (Ptarget(1), … , Ptarget(21)) be the amino acid distribution at a target position of polypeptide, where 0 ≤ Ptarget(a) ≤ 1 with a = 1–20 gives the probability for amino acid a, and 0 ≤ Ptarget(21) ≤ 1 gives the probability of having a stop codon at the target position. These probabilities are subject to the constraint that Σa = 1 to 21 Ptarget(a) = 1. Let Pn1 = (Pn1(A), Pn1(C), Pn1(T), Pn1(G)) be probability distribution over the nucleotides at the first position of the codon for the target. Similarly, Pn2 = (Pn2(A), Pn2(C), Pn2(T), Pn2(G)) is defined at the second position, and Pn3 = (Pn3(A), Pn3(C), Pn3(T), Pn3(G)) at the third position. If we assume that the three codon positions be independent from one another, the probability of having amino acid a generated from the nucleotide distributions should be
 |
1 |
where n1, n2, and n3 stands for the nucleotides, the summation exhausts over all possible nucleotides, and δ(a | n1 n2 n3) = 1 if codon ‘n1 n2 n3’ encodes amino acid a and δ(a | n1 n2 n3) = 0 otherwise. The Equation (1) defines the mapping from nucleotide distribution space (a 12-dimension hypercube) to the amino acid distribution space (a 21-dimension hypercube). So, even if the mapping is injective, or one-to-one, the nature of mathematical functions makes it clear that there will be infinitely many points in the 21-dimension hypercube that cannot possibly be covered.
In practical laboratory settings, the precision for the quantities of various reagents is finite, and for the sake of discussion simply let us assume it down to 1%, as suggested in LaBean and Kauffman (7). In other words, these probabilities [Equation (1)] take integral values from 0 to 100 inclusive for each nucleotide and each amino acid. This then allows us to estimate the extent to which the target amino acid distributions cannot be matched by any nucleotide distributions via Equation (1). Since now Pn1(A), Pn1(C), Pn1(T) and Pn1(G) take an integer value between 0 and 100 each and sum to a total of 100, the number of possible assignments is C103100, i.e. 103 choose 100. As 3 nt form one codon, this value is then cubed yielding 5.53 × 10¹⁵ possible codon nucleotide distributions. Similar analysis suggests that the number of possible amino acid distributions down to 1% accuracy is C120100, which is about 2.94 × 10²². As argued above, codon distributions map into amino acid distributions, so even if the mapping is injective, or one-to-one, then at a maximum only 5.53 × 10¹⁵ of the 2.94 × 10²² amino acid distributions can be matched (7). The mapping is clearly not one-to-one because of the degeneracy of the genetic code. So, at most, 1 out of every 5.3 million amino acid distributions can have an exact match via Equation (1).
Objective functions
Because, as shown above, no exact match is achievable for many target amino acid distribution, it is a desirable compromise to find codon nucleotide distributions that match a given target amino acid distribution as closely as possible.
Objective function 1 (least squares) (10): one simple way to measure how close two amino acid distributions are is by using the difference between the calculated and the target:
| 2 |
where Ptarget (a) is the target distribution’s value for amino acid a, Pcalc (a) is the calculated distribution as given in Equation (1) and wt(a) is a weighting factor for amino acid ‘a’ to affect how a mismatch is factored into the total measure D. Then, the task of finding the best matching distribution is choosing nucleotide distributions that minimize the difference.
This simple intuitive measure is called the first objective function in (5), where four other objective functions were also used, and adopted in this study as well. These four other objective functions may be selected by the user and are listed below.
Objective function 2 (cubic function) (10):
| 3 |
where
Objective function 3 (maximum likelihood) (10):
| 4 |
Objective function 4 (Cosine Basin) (8):
| 5 |
Objective function 5 (chi square and relative entropy) (5):
 |
6 |
where ε is an arbitrary small constant introduced to avoid numerical instability.
Codon usage
To further enhance the yield, the codon usage information for the host organisms where the protein libraries are synthesized should be taken into account. Let ka(n1 n2 n3) be the frequency that codon ‘n1 n2 n3’ are used for amino acid a, and then with codon usage being factored in the adjusted target distribution becomes Ptarget(a |n1 n2 n3) = Ptarget(a) ka(n1 n2 n3). We can replace the target distribution in all these five objective functions with the adjusted target distribution to take into account of codon usage. For example, objective function 5 [Equation (6)] is modified as follows.
 |
7 |
The codon usage information can be found in various databases, such as the one at the Codon Usage Database (http://www.kazusa.or.jp/codon/). If codon usage is not specified, the default codon usage will be a uniform distribution among all the codons.
Optimization
One major improvement from previous work (5) is that we make use of a genetic algorithm (11) to perform the optimization instead of using gradient descent method, which is known to be more susceptible to get stuck in local optima. Another major contribution of this work is detailed analysis of the constraints imposed by the genetic code and a method for circumventing these constraints by using more than one codon nucleotide distribution to match a given amino acid distribution. When multiple codon nucleotide distributions are used, the genetic algorithm, with proper encoding schemes (see below), can also optimize on the weighting factors for these distributions; these weighting factors are free parameters in the objective functions and cannot be easily optimized otherwise.
Optimization using genetic algorithm
The main evolutionary algorithm, called CodonOptima, is given by the following pseudocode.
Input: population size ps, objective function f, fitness_threshold ft, maximum time mt, maximum iterations mi, mutation rate mr, mutation density md, crossover rate cr, double crossover rate dcr
Algorithm
Generate a population p, of size ps, of codon nucleotide distributions at random
Evaluate the fitness of each member using the chosen objective function, f
Terminate, if the fitness of the best member is below a certain stopping fitness threshold, ft, or the maximum time, mt, or number of iterations, mi, has been exceeded.
Remove those with low fitness and replace with new random members. Mutate some of the population, where mutation density, md, is the probability of mutating a single member and mutation rate, mr, is the probability of mutating a single position in a member that has been selected for mutation. Crossover and double crossover also occurs at the rates specified by cr and dcr respectively. Go to step 2
Output: p, the population of codon nucleotide distributions sorted by objective function fitness and/or R-value
Encoding of distributions and implementation of mutations and crossing over
The distributions are encoded as strings representing the relative percentages of ACGT for each of the three codon positions. For the purpose of wet lab preparations, a precision of 1% for any one nucleotide is sufficient. Therefore, the percentage for each nucleotide is an integer between 0 and 100 inclusive, which takes 7 bits in binary to represent. For convenience, we use 4 bytes (1 byte each) to encode the amounts for the 4 nt at a codon position, and normalize these four integers to get the relative percentage for the corresponding nucleotides. For example, the binary string ‘01001000 11101010 00001000 10000010’ give the following amounts (A = 72, C = 234, G = 8 and T = 130), and relative percentages (A = 16%, C = 53%, G = 2% and T = 29%) after normalization. While the ‘one-byte-per-nucleotide’ representation suffices for the purposes of wet lab preparations, it can be expanded to accommodate higher precision when necessary. Since there are three positions for a codon, this representation has 12 bytes in total. Even at this 1% precision, the search space of codon distributions is already of a size of ∼1016.
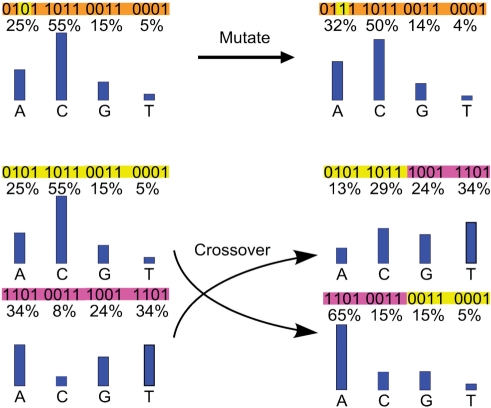
New distributions are generated by ‘evolutionary operations’ on the strings representing the existing distributions. Specifically, these evolutionary operations include point mutations and cross-overs. Point mutations are simply flips of single bits in this 12-byte string from ‘0’ to ‘1’, or vice versa. Typically, this results in a small change in the value that a byte represents, particularly when the mutation happens at the less significant bits. These small changes in value allow for fine-tuned explorations of the codon nucleotide search space. Larger jumps through the search space are accomplished by means of cross-over, where two strings will swap their characters after a random pivot point. Double cross-over is also implemented with two pivot points to allow for ‘middle’ sections to be swapped between a pair of strings. Mutation rate and density values typically range from 0.1 to 0.35, with cross-over and double cross-over rates being usually 0.8 and 0.01, respectively. In Figure 1, point mutation and cross-over are illustrated on toy examples with strings of 16 bits.
Figure 1.
Schematic illustration of point mutation and cross-over for generating new distributions. The top panel shows a point mutation from ‘0’ to ‘1’ at the third position of the string ‘0101 1011 0011 0001’, which encodes the amounts of nucleotides (A = 5, C = 11, G = 3 and T = 1), translating to a distribution (A = 25%, C = 55%, G = 15% and T = 5%) after normalization. A cross-over is shown for the bottom two strings in the left column, with a pivot point at the middle of each string, leading to two new strings in the right column, each is composed of two substrings, respectively, from the two original strings splitting at the pivot point, as indicated by their corresponding colors.
Multi-test tube solutions
Not only a target distribution may be impossible to match exactly as shown in the section ‘Unrealizable target distributions’, but it is often also difficult to find the exact match even when it exists. The situations are further complicated due to the constraints imposed by the genetic code and codon usage. To alleviate the difficulty, in a practical lab setting, it is acceptable to use two separate codon distributions (n1 n2 n3) and (n1′ n2′ n3′) in combination (i.e. two test tubes) to match a target amino acid distribution, as specified in the following equation.
 |
8 |
We implemented a combined solution of two test tubes (one for each codon). This approach can be further generalized to using multiple codon nucleotide distributions to match any given target amino acid distribution. As shown in the ‘Results’ section, this relaxation has resulted in better performance as measured by relative entropy.
This computational method of multiple test tubes can be implemented using wet lab methods. Previous work on probabilistic protein design has demonstrated using automated phosphoramidite synthesizers to create target nucleotide sequence ensembles according to the calculated arbitrary nucleotide probabilities (6). Mixtures of custom designed oligonucleotides from commercial sources can also be utilized to match target distributions (L. Shi et al., 2009 submitted for publication). Wet lab methods may also depend on the number of positions in a polypeptide that are to be matched, the complexity of the amino acid distributions at each of these positions and how far apart the positions are. For example, if the positions are far enough apart, methods such as overlapping Polymerase Chain Reaction can be used to assemble two different regions together. In general, it is preferable for wet lab methods that the number of generated codon nucleotide distributions (i.e. test tubes) be as few as possible.
What is the minimum number of test tubes that can be used to guarantee that any given target amino acid distribution can be matched? The trivial upper bound is 20 as every amino acid that is to be matched can be created from its own codons in a separate test tube. A more stringent and realistic upper bound is 6. To explain how this bound is established, let us examine the constraints imposed by the genetic code and identify amino acids that can be grouped in one test tube and still can have any distribution over them matching exactly. It is assumed that the desired distribution will contain no stop codons. For example, by inspection, if we wanted to match a target amino acid distribution over alanine (A), aspartate (D), glutamate (E), glycine (G) and valine (V), we can see that they all lie in the last four rows of the following genetic code table (Table 1).
Table 1.
Genetic code
| U | C | A | G | ||
|---|---|---|---|---|---|
| U | Phe | Ser | Tyr | Cys | U |
| Phe | Ser | Tyr | Cys | C | |
| Leu | Ser | STOP | STOP | A | |
| Leu | Ser | STOP | Trp | G | |
| C | Leu | Pro | His | Arg | U |
| Leu | Pro | His | Arg | C | |
| Leu | Pro | Gln | Arg | A | |
| Leu | Pro | Gln | Arg | G | |
| A | Ile | Thr | Asn | Ser | U |
| Ile | Thr | Asn | Ser | C | |
| Ile | Thr | Lys | Arg | A | |
| Met | Thr | Lys | Arg | G | |
| G | Val | Ala | Asp | Gly | U |
| Val | Ala | Asp | Gly | C | |
| Val | Ala | Glu | Gly | A | |
| Val | Ala | Glu | Gly | G |
That is, all these five amino acids have codons with a G in the first base position. Therefore, a mixture of these five amino acids (ADEGV) can be encoded by degenerate codons GNN, where N stands for any nucleotides. The relative amounts of U, C, A and G in the second codon position control the amounts of valine, alanine, aspartate/glutamate and glycine, respectively. The third base in the codon is degenerate for valine, alanine and glycine and does not affect their amounts, but the ratio of (U + C) to (A + G) controls the relative amounts of aspartate to glutamate. As a result, with a codon distribution given by GNN (100% G in first position), we can exactly match any given distribution for ADEGV. This distribution can then be weighted accordingly to match the initial distribution containing up to 20 target amino acid frequencies.
Based on this analysis, a list of one-test tube groupings of amino acids, which can be matched perfectly and will not contain any stop codons, can be generated and is given in Table 2. For each grouping of amino acids, the corresponding degenerate codons are also listed using the nomenclature for variable bases from Cornish-Bowden (12): H = not G, Y = T or C, R = A or G, etc.
Table 2.
Partial listing of one test tube groups of amino acids along with the corresponding degenerate codons
| Amino acids | Degenerate codon |
|---|---|
| ADEGV | GNN |
| HLPQR | CNN |
| IKMRT | ANR |
| APST | NCN |
| CFSY | UNC |
| CGRS | NGY |
| DHNY | NAY |
| FILV | NUH |
| INST | ANY |
| EKQ | VAG |
| GRW | NGG |
| LSW | UBG |
From these groupings, it is easy to propose the following partitioning of the 20 standard amino acids using six test tubes. One test tube for each of these four groups: IKMRT, ADEGV, HLPQR and CFSY. These four test tubes contain 18 unique amino acids, ACDEFGHIKLMPQRSTVY. Asparagine can be matched by codon AAY in one test tube (fifth) and tryptophan by UGG in its own test tube (sixth).
 |
9 |
where in wi, i = 1–6 are the weights to control the relative percentage of the six individual distributions from P(IKMRT) to P(W) in a target distribution. This recipe gives a total of six test tubes to exactly match any given target amino acid distribution.
Six test tubes are sufficient for exact matching, but are they necessary? The answer is yes, and the proof is outlined as follows.
Construct a 20 × 20 binary valued matrix, M, whose rows and columns correspond to 20 amino acids, and each entry is either 1 if the corresponding amino acids can be exactly matched using one codon nucleotide distribution (test tube) or 0 if otherwise. An amino acid pair can be matched exactly if there is at least one codon for each amino acid in the pair such that these two codons have a Levenshtein edit distance (13) of exactly 1.
Build a graph G based on matrix M. G contains 20 nodes corresponding to the 20 amino acids. Any two nodes x and y in G are connected by an edge if and only if M(x,y) = 0. That is, edges in G correspond to pairs of amino acids that cannot be exactly matched using one codon nucleotide distribution so they must be in separate test tubes.
Find the maximal clique of G. All of the amino acids in this clique must be in mutually exclusive test tubes.
Two maximal cliques of size 6 are found in graph G, AFMNQW and EFMNPW. For both of these maximal cliques, the six amino acids must be placed in separate test tubes giving a lower bound of 6 on the minimum number of test tubes needed. These groupings may prove useful to wet lab researchers employing probabilistic protein design techniques using codon nucleotide distributions. While most amino acid distributions can be matched sufficiently with a few test tubes, amino acid distributions containing many or all of the amino acids in these maximal cliques may prove very difficult to match if additional test tubes are not utilized. Since 6 has been demonstrated as both a lower and upper bound on the minimum number of test tubes needed to match any given amino acid distribution, then Equation (9) represents one such optimal partitioning using a minimum number of test tubes.
RESULTS
Besides the objective functions, i.e. the fitness used in the genetic algorithm, a separate metric is adopted for the purpose of comparison to evaluate the closeness of the predicted and target amino acid probability distributions, as suggested previously (5). This metric is a normalized symmetric version of the relative entropy, i.e. Kullback–Leibler divergence.
 |
10 |
Its value can range from 0 to 1 inclusive. In general, an R-value < 0.2 is a relatively good match and an R-value < 0.1 a very good match. Note that all amino acids are equally weighted in this calculation.
The data used here were adopted from previous work (5), which include the amino acid probabilities of several structures, including the SH3 domain (PDB no. 1CKA), which we use in this analysis. In previous work (5), the input amino acid probability distribution was determined using the statistical method for protein libraries (14), where the method takes as input a target structure and an energy function that quantifies sequence–structure compatibility: for each target backbone structure, the method yields the probabilities of each of the amino acids at each residue site.
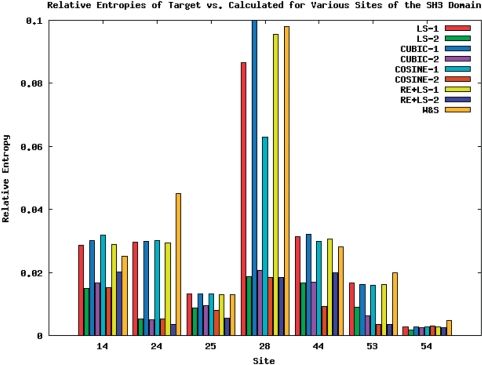
In Table 3, R-values for the seven SH3 domain sites using different objective functions with one and two test tube are listed. The last column gives the R-values from previous method (5). The results are also displayed as a bar chart in Figure 2. It can be easily seen that in almost all cases, the genetic algorithm achieved better R-values, and that the two test tube solutions in all cases are significantly better than their one-test tube counterparts.
Table 3.
R-values for various SH3 domain sites [LS, CUBIC, COSINE and RE + LS are Equations (2), (3), (5) and (6), respectively]
| Site | LS-1 | LS-2 | CUBIC-1 | CUBIC-2 | COSINE-1 | COSINE-2 | RE + LS-1 | RE + LS-2 | W&S |
|---|---|---|---|---|---|---|---|---|---|
| 14 | 0.02867 | 0.01500 | 0.03008 | 0.01675 | 0.03184 | 0.01528 | 0.02893 | 0.02024 | 0.02500 |
| 24 | 0.02972 | 0.00534 | 0.02975 | 0.00490 | 0.02999 | 0.00514 | 0.02945 | 0.00342 | 0.04500 |
| 25 | 0.01326 | 0.00878 | 0.01318 | 0.00942 | 0.01329 | 0.00795 | 0.01302 | 0.00551 | 0.01300 |
| 28 | 0.08659 | 0.01855 | 0.18291 | 0.02070 | 0.06283 | 0.01838 | 0.09544 | 0.01844 | 0.09800 |
| 44 | 0.03135 | 0.01665 | 0.03213 | 0.01688 | 0.02985 | 0.00929 | 0.03062 | 0.02000 | 0.02800 |
| 53 | 0.01659 | 0.00902 | 0.01608 | 0.00613 | 0.01597 | 0.00358 | 0.01625 | 0.00338 | 0.02000 |
| 54 | 0.00272 | 0.00184 | 0.00269 | 0.00257 | 0.00277 | 0.00306 | 0.00274 | 0.00259 | 0.00480 |
The use of one or two test tubes, i.e. nucleotide distributions, is indicated by a 1 or 2 after the hyphen. W&S is the R-value reported in the previous work (5).
Figure 2.
R-values for calculated distributions achieved by various objective functions with one, two test tube and the method of Wang and Saven (5).
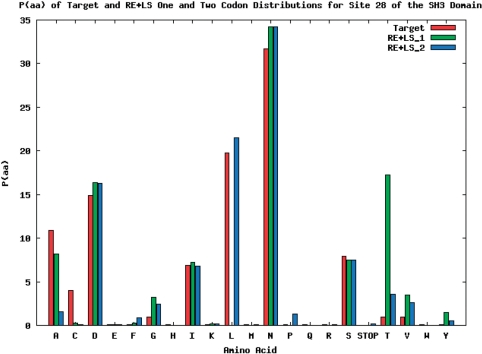
The target amino acid probability distribution of site 28 of the SH3 domain was the hardest to match of the seven sites distributions from the SH3 domain. In Figure 3, site 28 of the SH3 domain is the target distribution and the corresponding codon nucleotide distributions are being matched using the RE + LS objective function. For the calculated amino acid probability distribution with the best R-value using one codon nucleotide distribution (Figure 4), it is not able to match threonine and leucine while simultaneously matching the other amino acid probabilities. However, using two codon nucleotide probability distributions (Figure 5) allows for both threonine and leucine to be matched much more closely, while at the same time still matching the amino acids that were well matched by the one codon nucleotide distribution case.
Figure 3.
Site 28 of SH3 domain with one and two codon distributions using the RE + LS objective function.
Figure 4.
Single codon nucleotide probability distribution for site 28 of SH3 domain using the RE + LS objective function.
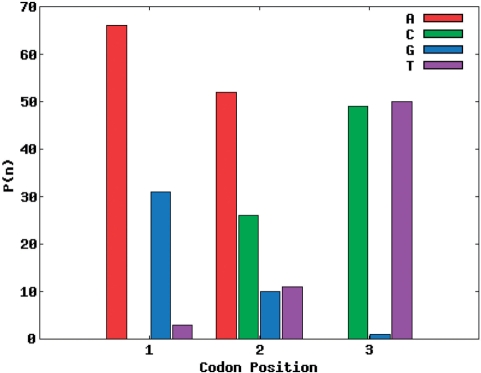
Figure 5.
Nucleotide probability distributions for two weighted codons for site 28 of SH3 domain generated using the RE + LS objective function. The first and second codon nucleotide distributions are weighted 0.29 and 0.71, respectively.
Specifically, in the two codon nucleotide probability distribution case the second codon, which weighs 0.71, closely matches the single codon case (Figure 4), while the first codon of Figure 5 is very different. It has a large amount of T (or U) in the first and second positions of the codon and a large amount of A in the third position. TTA codes for leucine and this additional codon probability distribution allows for the target leucine probability to be better matched in the two codon case. It should be noted that the codon distribution in Figure 4 is not a seed or initial value for the second codon in Figure 5. This is a demonstration of the ability of multiple codon distributions to match hard to optimize amino acid probability distributions.
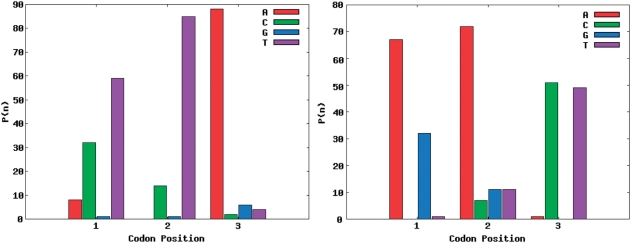
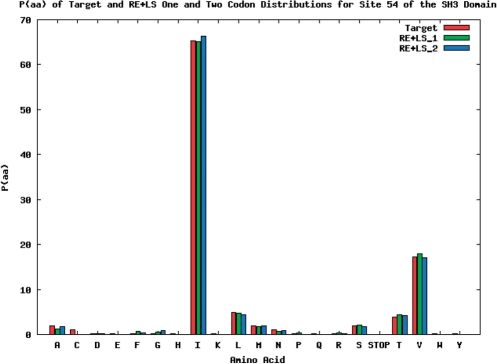
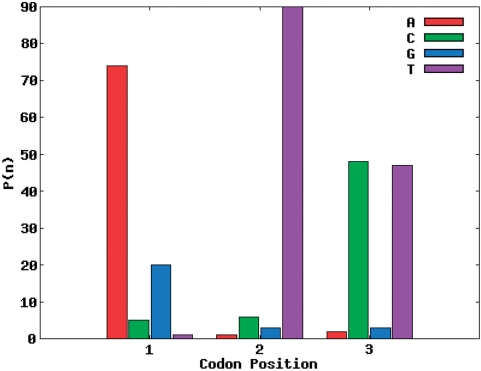
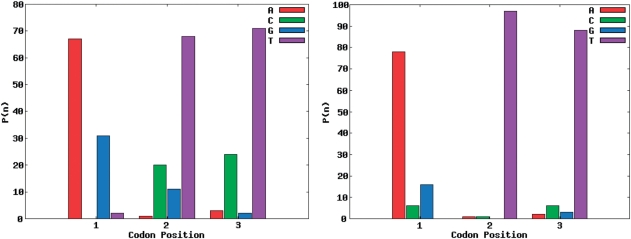
On the other hand, some amino acid probability distributions do not require additional codon nucleotide probability distributions. Site 54 (Figure 6) is easily matched with one codon distribution (Figure 7) and adding more codon distributions (Figure 8) does not improve the R-value score appreciably. The reason for the good match of the site 54 distribution is the abundance of isoleucine, valine and leucine (∼90% of the target distribution), which fall in the same ‘harmony’ group. All three of these amino acids can be encoded by the degenerate codon NUN, and consequently in the nucleotide probability distribution for the matching codon distributions, we see a spike in the amount of uracil/thymine present in the middle codon position.
Figure 6.
Site 54 of SH3 domain with one and two codon distributions using the RE + LS objective function.
Figure 7.
Single codon nucleotide probability distribution for site 54 of SH3 domain using the RE + LS objective function.
Figure 8.
Nucleotide probability distributions for two weighted codons for site 54 of SH3 domain generated using the RE + LS objective function. The first and second codon nucleotide distributions are weighted 0.25 and 0.75, respectively.
For the two codon distribution case, we can see that the production of alanine and threonine has been shifted to the first of the two codons. The relatively large amount of C present in the second position of the first codon, which weighs 0.25, coupled with the A and G in the first position help encode for the threonine (ACN) and alanine (GCN), respectively. Notice that virtually all of the C in the second codon position of the second codon distribution has been minimized and has been moved into the second codon position of the first codon distribution.
CONCLUSIONS
In this work, we have proved that for any given target distribution of amino acids, an exact match in nucleotide distributions may not exist at all. In fact, it is estimated that when the distributions are discretized to 1% resolution, only 1 out of 5.3 millions amino acid distributions can be exactly matched with proper nucleotide distributions. By adopting the objective functions in Wang and Saven (5), we formulated the task of designing nucleotide distributions to match any given target distribution as a constrained optimization problem. We then developed a genetic algorithm-based approach to search for codon nucleotide distributions that match as closely as possible to the target amino acid distribution. As compared with the previous gradient descent method (5) on various objective functions, the new method consistently gave more optimized distributions as measured by the relative entropy between the calculated and the target distributions. We further modified the objective functions to allow for matching a target distribution with more than one set of nucleotides, alleviating the constraints imposed by the genetic code on certain amino acids. Test results show that this multi-test tube approach consistently generates a better match to the target amino acid distribution than the single-test tube method.
FUNDING
Centocor Research and Development, Inc. Funding for open access charge: Centocor Research and Development, inc.
Conflict of interest statement. None declared.
ACKNOWLEDGEMENTS
The authors would like to thank Juan Carlos Almagro, Ping Tsui, Ray Sweet and Gary Gilliland for constructive discussions. The authors also thank the anonymous reviewers for their useful comments.
REFERENCES
- 1.Boder ET, Wittrup KD. Yeast surface display for screening combinatorial polypeptide libraries. Nat. Biotechnol. 1997;15:553–557. doi: 10.1038/nbt0697-553. [DOI] [PubMed] [Google Scholar]
- 2.Hoess RH. Protein design and phage display. Chem. Rev. 2001;101:3205–3218. doi: 10.1021/cr000056b. [DOI] [PubMed] [Google Scholar]
- 3.Kamtekar S, Schiffer JM, Xiong H, Babik JM, Hecht M. Protein design by binary patterning of polar and nonpolar amino acids. Science. 1993;262:1680–1684. doi: 10.1126/science.8259512. [DOI] [PubMed] [Google Scholar]
- 4.Balint RF, Larrick JW. Antibody engineering by parsimonious mutagenesis. Gene. 1993;137:109–118. doi: 10.1016/0378-1119(93)90258-5. [DOI] [PubMed] [Google Scholar]
- 5.Wang W, Saven JG. Designing gene libraries from protein profiles for combinatorial protein experiments. Nucleic Acids Res. 2002;30:e120. doi: 10.1093/nar/gnf119. [DOI] [PMC free article] [PubMed] [Google Scholar]
- 6.Park S, Kono H, Wang W, Boder ET, Saven JG. Progress in the development and application of computational methods for probabilistic protein design. Comput. Chem. Eng. 2005;29:407–421. [Google Scholar]
- 7.LaBean TH, Kauffman SA. Design of synthetic gene libraries encoding random sequence proteins with desired ensemble characteristics. Protein Sci. 1993;2:1249–1254. doi: 10.1002/pro.5560020807. [DOI] [PMC free article] [PubMed] [Google Scholar]
- 8.Wolf E, Kim PS. Combinatorial codons: a computer program to approximate amino acid probabilities with biased nucleotide usage. Protein Sci. 1999;8:680–688. doi: 10.1110/ps.8.3.680. [DOI] [PMC free article] [PubMed] [Google Scholar]
- 9.Mena MA, Daugherty PS. Automated design of degenerate codon libraries. Protein Eng. Des. Sel. 2005;18:559–561. doi: 10.1093/protein/gzi061. [DOI] [PubMed] [Google Scholar]
- 10.Jensen LJ, Andersen KV, Svendsen A, Kretzschmar T. Scoring functions for computational algorithms applicable to the design of spiked oligonucleotides. Nucleic Acids Res. 1998;26:697–702. doi: 10.1093/nar/26.3.697. [DOI] [PMC free article] [PubMed] [Google Scholar]
- 11.Mitchell M. An Introduction to Genetic Algorithms. Cambridge, MA: MIT Press; 1996. [Google Scholar]
- 12.Cornish-Bowden A. Nomenclature for incompletely specified bases in nucleic acid sequences: recommendations 1984. Nucleic Acids Res. 1985;13:3021–3030. doi: 10.1093/nar/13.9.3021. [DOI] [PMC free article] [PubMed] [Google Scholar]
- 13.Levenshtein VI. Binary codes capable of correcting deletions, insertions, and reversals. Sov. Phys. Doklady. 1966;10:707–710. [Google Scholar]
- 14.Kono H, Saven JG. Statistical theory for protein combinatorial libraries. Packing interactions, backbone flexibility, and the sequence variability of a main-chain structure. J. Mol. Biol. 2001;306:607–628. doi: 10.1006/jmbi.2000.4422. [DOI] [PubMed] [Google Scholar]


