


Abstract
We present a high-resolution nuclear magnetic resonance (NMR) solution structure of a 14-mer RNA hairpin capped by cUUCGg tetraloop. This short and very stable RNA presents an important model system for the study of RNA structure and dynamics using NMR spectroscopy, molecular dynamics (MD) simulations and RNA force-field development. The extraordinary high precision of the structure (root mean square deviation of 0.3 Å) could be achieved by measuring and incorporating all currently accessible NMR parameters, including distances derived from nuclear Overhauser effect (NOE) intensities, torsion-angle dependent homonuclear and heteronuclear scalar coupling constants, projection-angle-dependent cross-correlated relaxation rates and residual dipolar couplings. The structure calculations were performed with the program CNS using the ARIA setup and protocols. The structure quality was further improved by a final refinement in explicit water using OPLS force field parameters for non-bonded interactions and charges. In addition, the 2′-hydroxyl groups have been assigned and their conformation has been analyzed based on NOE contacts. The structure currently defines a benchmark for the precision and accuracy amenable to RNA structure determination by NMR spectroscopy. Here, we discuss the impact of various NMR restraints on structure quality and discuss in detail the dynamics of this system as previously determined.
INTRODUCTION
The availability of isotope-labelled oligonucleotides (1–4) has turned nuclear magnetic resonance (NMR) spectroscopy to be an invaluable tool for RNA structure determination. A variety of NMR parameters reflect on the dynamic structure of RNA oligonucleotides in solution, and direct monitoring of persistent hydrogen-bonding interactions in RNA and DNA is a particular strength of NMR spectroscopy. However, there are a number of difficulties for RNA structure determination that make the determination of a high-resolution structure a formidable task by NMR spectroscopy. In general, the number of hydrogen atoms is low compared to proteins leading to a considerably reduced proton spin density for RNAs. Therefore, in most cases, a purely nuclear Overhauser effect (NOE)-based structure determination approach is insufficient to obtain a high-resolution NMR structure. In addition, the number of free torsion angles is higher than for proteins. The conformation of the phosphodiester backbone is defined by six freely rotatable bonds compared to the two free rotations in proteins, although there are correlations also in RNA and DNA between the various backbone angles. In addition, there are free torsion angles that allow variation in the conformation of the ribose and its connection to the nucleobase. Furthermore, RNA structures are often elongated and the detailed shape of such an elongated biomolecule is difficult to obtain using traditional, mainly local, NMR parameters only.
Here, we discuss the structure determination of a 14-mer hairpin RNA consisting of a 5-bp helix capped by the highly stable cUUCGg tetraloop (Figure 1) with a CG closing base pair and the four loop nucleotides L1–L4. The 14-mer tetraloop RNA has served as a model for the investigation of RNA dynamics and development of new NMR experiments (5–14). NMR assignment for 1H, 13C, 15N and 31P resonances has been published (11). The chosen sequence is particularly stable with a high melting temperature of 74°C due to the implemented cUUCGg–tetraloop, which is the most stable hairpin motif in RNA (15). The 14-mer RNA thus adopts a well-defined structure compromising of two conformational domains: the stem with a canonical helix conformation and the loop with a very unusual non-canonical conformation including the trans-wobble base pair.
Figure 1.

Schematic illustration of the secondary structure of the 14-mer cUUCGg–tetraloop RNA with C5-G10 closing base pair. The tetraloop is additionally labelled L1-4 and the trans-wobble base pair U6-G9 is indicated by dashed line.
The cUUCGg-tetraloop has already been extensively studied by different biophysical methods in order to understand the unusual thermal stability at the molecular level. From melting temperature studies by Sakata et al. (16) it could be concluded that both the presence of the 2′-OH moiety in the loop and the amino group at L4 are responsible for the unusually high stability of the cUUCGg hairpin structure. The first NMR structure for a cUUCGg tetraloop in the sequence context of the P1 helix of the group intron was published by Varani and Allain (17) in 1995. Examination of the structure revealed the main characteristics of the loop structure which is the U-G trans-wobble base pair that contains the unusual sugar to base hydrogen bond via the 2′-OH group and two hydrogen bonds between L1 (O2) and both N1 and N3 of L4. Those interactions are regarded as the main determinants for the thermal stability (17). Further stabilizing effects arise from extensive base stacking interactions and a base-to-backbone hydrogen bond between L3 (N1) and L1 (O2P). Subsequent unrestrained molecular dynamics (MD) simulation studies performed for the cUUCGg tetraloop further confirmed the accuracy and stability of the structure, even when starting from an incorrect structure (18). Extensive thermodynamic studies by Williams and Hall (19) revealed a prominent position dependence of the 2′-OH groups in contribution to thermal stability even for the hydroxyl groups at L3 and L4, although they have not been seen to form any hydrogen bond in the solution structure.
When the first X-ray structure of the cUUCGg tetraloop was elucidated at 2.8 Å resolution in 2000, Ennifar et al. (20) could observe additional 2′-OH hydrogen bonds between L2 (2′-OH) and L4 (O6), L3 (2′-OH) and L3 (O2) which were not observed in the solution structure. In general, the solution and crystal structures agree well in their global conformation (17,20). However, local differences in the backbone conformation could be observed between different X-ray structures and even within the same crystal (20).
In our work, we utilized all established and currently developed NMR techniques using a uniformly 13C/15N-labeled sample to collect a wealth of independent experimental restraints such as NOE intensities, scalar coupling constants (J), cross-correlated relaxation rates (Γ) and residual dipolar couplings (RDCs) in order to determine the vast majority of backbone dihedral angles, sugar conformation and the base orientation in a quantitative manner. In addition, according to recent efforts (24–26), we carried out a qualitative conformational analysis of the 2′-OH group by comparing NOE contacts to the adjacent protons of the sugar and base (H1′–H3′, H6/8i+1) and included those into the structure calculation. Using this high number of experimental restraints, we were able to arrive at a high-resolution structure of the 14-mer RNA and cross-validate the different experimental restraints. The elucidated structure shows a root mean square deviation (RMSD) of 0.25 Å for the loop and 0.30 Å for the stem region after energy refinement in water and defines the current resolution limit and accuracy for NMR-based structure determination of RNA oligonucleotides.
MATERIALS AND METHODS
Sample and NMR spectroscopy
A 14-mer-cUUCGg-tetraloop-RNA sample with the sequence 5′- –
– –
– –GGCAC(UUCG)GUGCC-3′ was purchased from Silantes GmbH (Munich, Germany). Samples for NMR-spectroscopy contained ∼0.7 mM RNA in 20 mM KHPO4, pH 6.4, 0.4 mM EDTA and 10% D2O. 1H chemical shifts are referenced directly to TSP as an external reference. The resonances have been fully assigned and published earlier (11). Spectra were acquired at 25°C, 10°C and 5°C on Bruker DRX600, AV600, AV700 and AV800 spectrometers equipped with 5-mm x,y,z-axis gradient TXI-HCN probe. The 31P-NMR spectra were recorded on an AV600MHz Bruker spectrometer with 5-mm z-axis gradient TCI-HCP cryogenic probe. Homonuclear 3J(H,H)-coupling constants were measured with 3D forward directed HCC-TOCSY-CCH-E.COSY (27). Heteronuclear 3J(H,P) and 3J(C,P) coupling constants were obtained from quantitative HCP experiments (28–35) and α/β selective HC(C)H-TOCSY (36).
  and
and  cross-correlated relaxation rates were measured using the quantitative 2D Γ-HCCH experiment.
  cross-correlated relaxation rates were measured using the CT-TROSY experiment as described by Boisbouvier et al. (37).
  and
and  have been measured with quantitative Γ-HCP-experiments (38).
Structure calculation
All calculations were performed with CNS 1.1 (39) using the ARIA 1.2 (40) setup and protocols with the dna_rna_allatom force field. The standard annealing protocols were used, including NOE distance calibration and spin-diffusion correction. Fifty starting structures were generated based on a linear template molecule with randomly associated velocities for all atoms. For each iteration (0–7), for which 50 structures were calculated, the NOE distance restraints were recalibrated by ARIA based on the 10 lowest energy structures. The violation tolerance was progressively reduced to 0.1 Å in the last iteration (8) in which 200 structures were calculated. For the structure calculations, a four-stage simulated annealing (SA) protocol was used using torsion-angle dynamics (TAD). The high-temperature stage consisted of 10 000 steps at 10 000 K, which was followed by three cooling stages: 8000 steps to 2000 K, 20 000 steps to 1000 K and 15 000 steps to 50 K. During the SA protocol the force constant for the NOE restraints was set to 0, 10, 10 and 50 kcal mol−1 Å−2. The final 20 lowest energy structures were further refined in explicit water (41). For that, we modified the nucleic acid force field to include optimized potentials for liquid simulation (OPLS) charges and non-bonded parameters (42,43). Furthermore, we added weak base-planarity restraints and included the possibility for H5′ ambiguous assignment and swapping.
Hydrogen bonds were introduced as distance restraints of ∼3 Å between donor and acceptor heavy atoms and ∼2 Å between acceptor and hydrogen atoms.
RESULTS
NMR data and structural restraints
The assignment strategy for RNA, including full-resonance assignment of the cUUCGg–tetraloop RNA, has been introduced earlier (11). NMR experiments used to collect structural restraints for the calculation of the solution structure of cUUCGg–tetraloop 14-mer RNA are summarized in Table 1. Experimental data and structural restraints can be found in Table S1 (Supplementary Data) as well as in the PDB (2koc) and BMRB database.
Table 1.
Experimental restraints used for calculation of the 14-mer cUUCGg tetraloop RNA structure
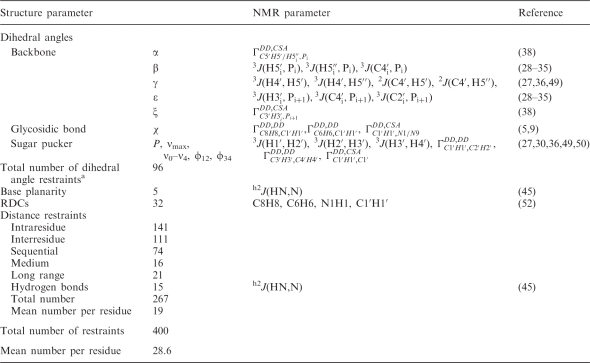 |
aDihedral angles (ν0–ν4, ϕ12, ϕ34) are counted as two dihedral angle restraints for the sugar conformation.
Distance restraints
The great majority of restraints for structure calculation consist of interproton distance restraints that are derived from the analysis of nuclear Overhauser enhancement spectroscopy (NOESY) spectra. Two 2D 1H1H-NOESY spectra with different mixing times (50 and 250 ms) have been recorded and provided on average 19 distance restraints per residue. The NOE cross peaks from the 2′-OH protons were also included into the structure calculation. The NOE intensities were automatically calibrated to distances using ARIA with spin-diffusion correction. The NOE-based distance restraints were supplemented by hydrogen bonds and weak planarity restraints of the base pairs, which have been deduced from the HNN-COSY experiment (44,45).
Dihedral angle restraints and RDCs
The interproton distance restraints alone were found to be not sufficient to define a high-resolution RNA structure because they lack information about the global conformation and their total number is rather low due to the limited proton density in RNA. Hence, it is crucial to measure additional NMR parameters to restrain the torsion angles and to add RDCs in order to generate a more precise NMR solution structure. Nevertheless, for our 14-mer RNA model system, the structure bundle calculated with only NOE-distance restraints tends to be well defined with local resolution of 0.45 Å for the loop region. Most torsion angles, except for  –
– and
and  , agree well with the final high-resolution structure that is calculated with all NMR restraints, including NOEs, dihedral angles and RDCs. Such high resolution can also be obtained locally for the non-canonical region within the loop. In retrospect, we can show that the structure delivered by NOE distance restraints only is very useful as an initial estimate for the local geometry, i.e. of single distinct dihedral angles. The initial structure therefore provides a helpful starting structure to differentiate between ambiguous dihedral angle values occurring from analysis of the degenerate scalar coupling constants and cross-correlated relaxation rates, as we have noticed during structure calculation for some of the backbone torsion angles.
To define backbone angles  and
and  , 3J heteronuclear coupling constants have been measured from 31P to the sugar protons H5′/H5′′, H3′ and to the sugar carbons C4′ and C2′ based on quantitative heteronuclear HCP-experiments and J-modulated HP-HSQC which yielded 54 J-coupling constants (28–34). On average, each torsion angle was specified by two heteronuclear coupling constants. In most cases, it was possible to fit the data to one single conformation, which agreed well with the NOE prediction. For angles and residues that could not be fit to a single conformation we further analysed the coupling constants assuming that multiple conformations might be present. Our analysing approach included both, a equilibrium between two structures state with continues dihedral angle ranges and a three conformation-state model with distinctive dihedral angles correlating to trans (180°) and gauche (60°, −60°) conformations. In this way, it could be concluded that coupling constants for the angle β for the residue G1, G2 and U7 can be better described by a conformational distribution. However, the main fraction, ∼70%, was found in trans conformation which led us to define the trans conformation as the main one. For the angle β for the residues G9 and G10 it was not possible to find satisfying solution with none of the methods. This observation might indicate that conformational transitions and dynamics occur which cannot be described by the NMR parameters. In line with this observation, order parameters S2 of the phosphorous atom show highest flexibility within the loop backbone (13). Another reason for unexpected coupling constants could be that the currently used Karplus parameterization is not appropriate for unusual RNA conformation, which is mostly observed for nucleotides within the loop region. The dihedral angle ε was mostly fitting to a single conformation in agreement with the NOE structure except for the residue U7 and C8. Those were fitting to a broad conformational range fluctuating around a main conformation. In total, 10 and 12 out of 14 torsion angles for β and ε have been obtained, respectively. For loop residue U7 and C8, those angles have been restrained only loosely because J-coupling constants result in a broad conformational range, while the J torsion angle restraints for the angle β for the residue G9 and G10 were left out.
The backbone angles  and
and  –
– show the highest conformational diversity in RNA (46). Qualitative estimation of these two angles is usually derived from analysis of 31P chemical shifts but such analysis should only be used to exclude the trans conformation (47,48). In order to obtain quantitative data for these two torsions, we have determined CH–dipole, 31P-CSA cross-correlated (
 and
and  ) relaxation rates that were obtained from the new quantitative Γ-HCP experiment developed in our group (38). In total, 22 dihedral angles for α and ξ could be included into the structure calculation. Determination of the sugar conformation described by the amplitude vmax and the phase angle of the pseudo-rotation (P) of the sugar ring is based on measurement of homonuclear coupling constants 3J(H,H) for all sugar protons and dipolar cross-correlated relaxation rates
  ,
,  and
and  (27,30,36,37,49,50). Due to favourable spectral resolution of the 14-mer RNA, 52 out of 70 possible 3J(H,H) coupling constants in the sugar moieties could be determined applying the forward-directed HCC-TOCSY-CCH-E.COSY experiment (27) and further 32 cross-correlated relaxation rates. Based on analysis of these coupling constants and cross-correlated relaxation rates, we broadly defined the sugar conformations by its endocyclic torsion angles v0–v4. In addition, the cross-correlated relaxation rates were used to accurately define 13 sugar conformations by the
  and
and  torsion angles. For this, the pseudo-rotation angle P is estimated by the ratio of / while the amplitude vmax is determined by analysing single cross-correlated rates (50,51). The reason for the high
  rate of G10 is currently unknown. Whether very slow chemical exchange observed on the times scales (1–10 Hz) of the cross-correlated relaxation rates is the reason cannot be ascertained. In line with this, we also lack the data for the
  for G10. As expected, data indicate that the sugar from residues U7 and C8 adopt south-type conformations while all other residues adopt north-type conformation including C2′-exo and C3′-endo conformation as discussed below (Figure 2).
Figure 2.

The calculated cross-correlated relaxation rates  (red),
  (blue) and the ratio
  (green) reported in solid lines as a function of the pseudo-rotation pucker P for τc = 2.3 ns and for four values of the pucker amplitude vmax (35°, 40°, 45°). The experimental data are overlaid on the graph with circles with the same colour code as the function.
  of G10 has been set to P = 34° where the graph has its maximum.
The exocyclic torsion angle  is determined from 3J(H3′, H4′), 3J(H4′, H5′), 2J(H5′, C4′) and 2J(H5′′, C4′) coupling constants that yield the stereospecific assignment of the diastereotopic H5′/H5′′ protons (11,49). From qualitative analysis of those coupling constants, the torsion angle γ has been restrained to the gauche (60°) conformation except for the residue G9 which was set to trans conformation.
The orientation of the nucleobase, characterized by the glycosidic torsion angle  , was obtained from cross-correlated relaxation rates derived from the quantitative Γ-HCNCH experiment as reported earlier (5,9).
As a result, 96 out of 112 possible degrees of freedom in the 14-mer RNA could be determined in quantitative manner giving hint to the presence of A-form conformation of the stem and non-canonical conformation for the loop. In addition, 32 RDCs from sugar (C1′H1′), base (C6H6, C8H8) and imino (N1H8, N3H3) bond vectors have been measured to determine the overall orientation of the RNA (52).
NMR solution structure of the 14-mer-cUUCGg–tetraloop RNA
The structure of the 14-mer hairpin RNA has been calculated using four combinations of three subsets of restraints: (i) NOEs, (ii) NOEs + RDCs, (iii) NOEs + dihedrals and (iv) NOEs + dihedrals + RDCs. The RMSD is calculated from 20 structures with the lowest overall energy after water refinement for all atoms in three different regions: overall (residues 2–13, thus without the terminal nucleotides), the stem (residues 2–5, 10–13) and the loop region (residues 6–9). The standard parameters for the dna_rna_allatom force field in ARIA/CNS do not allow for a proper water refinement. Therefore, we have included OPLS non-bonded Lennard–Jones parameters and charges (42,43,53) which considerably improved the structure calculation.
Structure calculation based on the NOE distance restraints, base-pairing hydrogen bonds and planarity restraints resulted in an already well-defined bundle with an overall RMSD of 0.85 Å and a local convergence of 0.45 Å for the loop region (Figure 3A). However, the overall structure tends to be bent. Addition of either the RDCs (Figure 3B) or all available dihedral angle restraints (Figure 3C) increases the convergence and the accuracy of the structure resulting in an overall RMSD of 0.69 Å and 0.41 Å, respectively. Particularly the loop region is well defined in both calculations with an RMSD of 0.33 Å and 0.27 Å, respectively. The final structure calculation with the entire set of structure parameters, including RDCs and the 2′-OH hydrogen bond restraints for the trans-wobble base pair, results in a tight bundle with an overall RMSD of 0.37 Å (Figure 3D). The structure has been analysed with the software w3DNA (54) which confirms the A-form conformation of the stem helix (residues 1–5, 10–14). As expected, all residues except U7 and C8 show north-type conformation adopting exclusively C3′-endo conformation such that the C2′-exo conformation derived from analysis of  and
and  for G2, A4, G9 and U11 is not reflected in the structure calculation (Figure 4A). The reason for that could be that the other experimental restraints (NOEs, RDCs) in combination with the force field drive the sugar to the more stable C3′-endo conformation. The 2′-OH group adopts two out of three possible conformations, namely mainly either the O3′ or base orientation in agreement with NOE data (Figure 4A–C). Comparison of the final structure bundle and the NMR input (Figure 5A–C) for dihedral angle restraints reveals a very good agreement. The only exception is seen within the loop region for the angles ε of C8 with a deviation between input and output at about 50°. This deviation corresponds to the precision of the experimental restraint that described this angle only as a broad conformational region according to analysis of the coupling constants. However, the resulting conformation is similar to X-ray structure with a deviation <25° (Figure S2, Supplementary Data). Higher angle deviation at residues G1 and G2 indicates that this region is less defined and, in line with previous relaxation analysis, more flexible.
Figure 3.

Superposition of 20 structures with the lowest overall energy after refinement in explicit water as calculated with different NMR data sets (A–D). The RMSD is related to overall (residues 2–13), stem (residues 2–6, 10–13) and loop (residues 6–9). (A) Only NOE distance restraints (orange). (B) NOEs + RDCs (blue). (C) NOEs + dihedrals (green). (D) NOEs + dihedrals + RDCs (red). The RDCs were backcalculated using the software PALES (66) and the correlation coefficients are only mentioned for those structures that are calculated without this restraint data set.
Figure 4.

(A) Conformational analysis of the final structure with resonance assignment of the 2′-OH protons. Orientation of the 2′-OH group is given according to the analysis of NOE contacts and according to the final structure bundle (θ(OH2′–O2′–C2′–H2′)). (B) Structure bundle of final 20 structures with the lowest energy including all NMR data. 2′-OH groups are highlighted in red. (C) Expansion of the 2′-OH–H1′ and 2′-OH–H6/H8 region of the 2D NOESY experiment with mixing time of 250 ms and temperature of 5°C, recorded at a AV900 MHz spectrometer.
Figure 5.


Structural analysis. (A) Structural statistics from the final structure calculated with NOE distance restraints, dihedral angles and RDCs. (B) Correlation of experimental dihedral angles derived from NMR data and dihedral angles in the final structure bundle averaged over 20 structures. Error bars indicate the experimental precision of the input data. (C) Correlation of experimental dihedral angles derived from NMR data and dihedral angles in the final structure bundle averaged over 20 structures and plotted to the sequence. Error bars indicate the angle deviation within the calculated structure bundle. Comparison of dihedral angles from the new solution structure and X-ray data for the cUUCGg tetraloop see Supplementary data (Figure S2).
Assignment and conformational analysis of 2′-OH group
The resonance assignment of the 14-mer RNA hairpin has been published earlier (11) and is now completed with the 2′-OH resonances which are found between 6.7 and 7.1 ppm (Figure 4B). We have deposited this update resonance assignment in the BMRB database. In 2D 1H1H-NOESY spectra at long mixing time (250 ms) and a temperature of 5°C, NOE cross peaks between the 2′-OH protons and the protons of the sugar  and the base (H6/H8i+1) of the adjacent nucleotide can be detected. These signals resonate far from the water signal. Their cross peaks to the same 2′-OH proton give information about the interresidual linkage between the own sugar
  and the next nucleobase (H6i+1/H8i+1) and can therefore be valuable for assignment (Figure 4C). For the 14-mer RNA, the resonances for nine 2′-OH groups could be assigned. The missing 2′-OH protons are located in the loop region (U7-G9) and at terminal nucleotides (G1, C14) where the signal is lost due to exchange with water. Conformational analysis based on 2D 1H1H-NOESY spectrum at short mixing time (50 ms) at low temperature (5°C) has been carried out as introduced earlier (24,55). The results indicate that the 2′-OH group mainly adopts orientation toward the O3′ domain as discussed in previous studies (24–26). This observation is supported by the presence of cross peaks between the 2′-OH and the H1′ atoms. These cross peaks are more intense than the 2′-OH cross peaks to the H6/8i+1 but weaker than to the H2′ protons. Presence of cross peaks to H5′ protons of the following nucleotide (A4, C5, G12) and to H6/8 of the next base at longer mixing time support the concept that the orientation toward O3′ domain is populated to some higher extent which is consistent with findings by others (24–26). The only exception is found for the residue G10 where the 2′-OH NOE contacts indicate an orientation toward O4′. The final structure bundle agrees well with these findings, indicating that the 2′-hydroxyl groups mainly adopt the O3′ domain orientation (Figure 4A and B) for the stem and an orientation towards the base domain for U6 in the loop.
DISCUSSION
Conformational analysis of the 14-mer-cUUCGg–tetraloop RNA
The loop region is the appropriate site to probe the accuracy of the present structure since the cUUCGg–tetraloop has been extensively investigated by both NMR and X-ray revealing specific structural features that are responsible for its extraordinary stability. The trans-wobble U6-G9 base pair, including the unusual 2′-OH hydrogen bond is also present in the new structure (Figure 6A). The ribose moieties of the loop residues U7 and C8 which adopt the unusual south-type conformation are identical to the X-ray structures (Figure 4A). The amino group at N4 of C8 forms a hydrogen bond to the O1P of U7 and is therefore protected from solvent exchange which is indicated by the presence of strong NOE peaks (Figure S1, Supplementary Data). The network of base stacking is observed for loop nucleobases except for the residue U7 which is flipped out and thus exposed to the solvent as also seen in all the other crystal and solution structures of the tetraloop (10).
Figure 6.

(A) Top: solution structure of the cUUCGg-tetraloop. Bottom: Residues G1-G2 with bound water molecules found in 20 structures after water refinement. (B) Dynamics. Structure is coloured by the order parameter (S2) determined for the sugar (C1′H1′) and base (C6H6, C8H8) at 317 K and backbone (31P) at 310 K as published earlier (6,10,13), no data for the base and backbone of G1 (grey). Hydrogen bonds are indicated by solid lines. Dashed line indicates a potential hydrogen bond between the 2′-OH of U7 and N7 of G9 that is found in a third of calculated structures.
Further inspection of the trans-wobble base pair reveals a small difference to the X-ray structure which is seen in a conformation such that L1(O2) is the acceptor group for both N1 and N2 of L4 (20). The N2 amino group of G9 (L4) in our structure is more exposed to the solvent and does not show any cross peaks in NOESY spectra. The distance between U6(O2) and G9(N2) is on average >3.5 Å and the hydrogen bond angle is about 130°, indicating that a hydrogen bond might potentially be formed, but since it is still highly solvent accessible it will be susceptible to fast exchange with water (Figure 6A). The same is observed for the imino proton at N1 of the U6 that can be regarded as free of hydrogen bonding. Both findings indicate that the U6-G9 base pair is not persistent and to some degree exposed into solution.
For the residue U7, we find a possible hydrogen bond between the 2′-OH group and the G9 base (N7) in about one-third of the calculated structures (Figure 6A), which at first sight seems to be surprising since the 2′-OH proton could not be detected. However, this might not be contradictory when we consider that the residue U7 is most exposed to the solvent and therefore exchange with water can reduce the signal despite the hydrogen bond. The presence of the hydrogen bond agrees with findings in X-ray structure which shows a hydrogen bond between the 2′-OH and the O6 of G9 (L4) (20).
The residue U7 is of key importance to address the question whether the solution structure can provide an insight into the associated dynamics. In our previous studies, employing relaxation analysis, it has been shown that the loop residue U7 and the loop backbone region reveal considerable dynamics on the nanosecond timescale (Figure 6B) (6,10,13). Further, analysis of coupling constants for the angles β and ε indicated higher flexibility since they could be better fit to a conformational distribution rather than to a single conformation as mentioned above. However, this is not reflected by the RMSD of the calculated structure bundle which shows higher precision for the loop region then for the stem. A slightly higher degree of conformational diversity of the residue U7 and the loop is recovered after water refinement. The higher precision of the loop region can be regarded as a direct result of the larger number of NOE distance restraints due to its superior spectral dispersion. The presented structure therefore will underestimate the conformational dynamics of the U7 residue. On the other hand, all data are consistent with an averaged structure and confirm a uniform distribution of conformers around the mean structure. This statement holds true for the two timescales sampled by NOE data and by J- and RDC data.
Comparison of available cUUCGg–tetraloop structures
We further analysed other available structures and selected four X-ray and five NMR solution structures containing the cUUCGg–tetraloop (Figure 7A and B) (17,20,56–64). The comparison of the new NMR solution structure of the cUUCGg–tetraloop with the X-ray crystal structure (20) confirms close similarity (Figure 7C, Figure S2, Supplementary Data). All analysed structures are in good overall agreement showing the characteristic trans-wobble U-G base pair and the flipped out L2 nucleobase. Closer inspection reveals more subtle differences between the available structures but also between the two methods (X-ray and NMR). At first sight, differences are apparent, especially in the backbone. While the X-ray structures differ in backbone conformation, they agree well in local position and orientation of respective bases. The NMR solution structures show more variations involving both backbone conformation and position which may be ascribed to real conformational diversity found for this loop.
Figure 7.

Comparison of previously available solution and X-ray structures of the cUUCGg tetraloop with a CG closing base pair. (A) Superposition of seven solution structures in yellow (pdb code: 1byj, 1ikd, 1hlx, 1fyo, 1c0o, 1m5l, 1jo7). Represented structure is selected to be the structure with the smallest RMSD value within the respective bundle. (B) Superposition of four X-ray structures in grey (pdb code: 1f7y (tetraloop (TL) 1 and 2), 1i6u, 1fjg). (C) New solution structure in red aligned with X-ray structure [1f7y (TL1)].
Proton exchange with water
The NOESY spectra show four cross peaks between RNA and water and two of them at 5.04 ppm can be assigned to the imino protons of the terminal G1 and loop residue U6 which are not completely protected from water exchange. Cross peaks that arise at 4.77 ppm can be assigned to the nucleobase proton H8 of G1 (8.17 ppm) and G2 (7.70 ppm) but no other sugar protons in near distance. C8H8 protons of purines can exchange with water (65) and indeed a spectrum that we recorded of an aged 14-mer sample in D2O solution lacks the H8 protons of G1 and G9, showing that those base protons are more accessible to exchange with water then the ones in the other purine residues (G2, A4, G10 and G12). Analysis of the 20 structures after water refinement reveals a high amount of bound water molecules nearby the protons H8 of G1 that are being coordinated by N7, O1P and O5′ atoms of G1 and G2 and most probably accelerates the proton exchange (Figure 6A). For the residue G9, the number of bound molecules is the same as for other purines (A4, G10 and G12). A possible explanation for exchange of H8 at G9 is the presence of a potential hydrogen bond between U7 (2′-OH) and G9 (N7) as we see in about one-third of calculated structures.
CONCLUSION
A high-resolution solution structure of the stable 14-mer cUUCGg–tetraloop model system RNA has been derived based on a wealth of NMR data such as NOEs, J-coupling constants, cross-correlated relaxation rates and RDCs. Conformation of the cUUCGg–tetraloop is in agreement with earlier published structures and reveals hydrogen bonding and base-stacking interactions as expected from NMR and X-ray data. We have demonstrated that each torsion angle in RNA can be determined by NMR with high accuracy and precision, which is proved by the comparison of NMR data and X-Ray data for the cUUCGg-loop region. Furthermore, we improved the force-field parameters for the water refinement stage in ARIA/CNS by including OPLS non-bonded parameters and charges (53). From the analysis of NOE contacts and the structure calculation, including 2′-OH NOE distance restraints it can be concluded that the ribose moiety mainly adopts an O3′-orientation domain. We have deposited all available NMR data in the BMRB database; such complete NMR restraints will allow further improvements in force fields and parametrizations to be carried. Therefore, our report of a high-precision model RNA NMR structure will likely provide valuable insight for further NMR investigations and development on RNA structure and dynamics.
SUPPLEMENTARY DATA
Supplementary Data are available at NAR Online.
FUNDING
Funding for open access charge: DFG. Accession Number Coordinates for the structure of the 14-mer cUUCGg-tetraloop RNA have been deposited in the RCSB Protein Data Bank (PDB ID code: 2koc).
Conflict of interest statement. None declared.
Supplementary Material
REFERENCES
- 1.Batey RT, Inada M, Kujawinski E, Puglisi JD, Williamson JR. Preparation of isotopically labeled ribonucleotides for multidimensional NMR spectroscopy of RNA. Nucleic Acids Res. 1992;20:4515–4523. doi: 10.1093/nar/20.17.4515. [DOI] [PMC free article] [PubMed] [Google Scholar]
- 2.Nikonowicz EP, Sirr A, Legault P, Jucker FM, Baer LM, Pardi A. Preparation of 13C and 15N labelled RNAs for heteronuclear multi-dimensional NMR studies. Nucleic Acids Res. 1992;20:4507–4513. doi: 10.1093/nar/20.17.4507. [DOI] [PMC free article] [PubMed] [Google Scholar]
- 3.Quant S, Wechselberger RW, Wolter MA, Wörner KH, Schell P, Engels JW, Griesinger C, Schwalbe H. Chemical synthesis of 13C-labelled monomers for the solid-phase and template controlled enzymatic synthesis of DNA and RNA oligomers. Tetrahedr. Lett. 1994;35:6649–6651. [Google Scholar]
- 4.Batey RT, Battiste JL, Williamson JR. Preparation of isotopically enriched RNAs for heteronuclear NMR. Methods Enzymol. 1995;261:300–322. doi: 10.1016/s0076-6879(95)61015-4. [DOI] [PubMed] [Google Scholar]
- 5.Duchardt E, Richter C, Ohlenschläger O, Görlach M, Wöhnert J, Schwalbe H. Determination of the glycosidic bond angle chi in RNA from cross-correlated relaxation of CH dipolar coupling and N chemical shift anisotropy. J. Am. Chem. Soc. 2004;126:1962–1970. doi: 10.1021/ja0367041. [DOI] [PubMed] [Google Scholar]
- 6.Duchardt E, Schwalbe H. Residue specific ribose and nucleobase dynamics of the cUUCGg RNA tetraloop motif by NMR 13C relaxation. J. Biomol. NMR. 2005;32:295–308. doi: 10.1007/s10858-005-0659-x. [DOI] [PubMed] [Google Scholar]
- 7.Vallurupalli P, Kay LE. A suite of 2H NMR spin relaxation experiments for the measurement of RNA dynamics. J. Am. Chem. Soc. 2005;127:6893–6901. doi: 10.1021/ja0427799. [DOI] [PubMed] [Google Scholar]
- 8.Fiala R, Sklenar V. 13C-detected NMR experiments for measuring chemical shifts and coupling constants in nucleic acid bases. J. Biomol. NMR. 2007;39:153–163. doi: 10.1007/s10858-007-9184-4. [DOI] [PubMed] [Google Scholar]
- 9.Rinnenthal J, Richter C, Ferner J, Duchardt E, Schwalbe H. Quantitative gamma-HCNCH: determination of the glycosidic torsion angle chi in RNA oligonucleotides from the analysis of CH dipolar cross-correlated relaxation by solution NMR spectroscopy. J. Biomol. NMR. 2007;39:17–29. doi: 10.1007/s10858-007-9167-5. [DOI] [PubMed] [Google Scholar]
- 10.Ferner J, Villa A, Duchardt E, Widjajakusuma E, Wöhnert J, Stock G, Schwalbe H. NMR and MD studies of the temperature-dependent dynamics of RNA YNMG-tetraloops. Nucleic Acids Res. 2008;36:1928–1940. doi: 10.1093/nar/gkm1183. [DOI] [PMC free article] [PubMed] [Google Scholar]
- 11.Fürtig B, Richter C, Bermel W, Schwalbe H. New NMR experiments for RNA nucleobase resonance assignment and chemical shift analysis of an RNA UUCG tetraloop. J. Biomol. NMR. 2004;28:69–79. doi: 10.1023/B:JNMR.0000012863.63522.1f. [DOI] [PubMed] [Google Scholar]
- 12.Fiala R, Jiang F, Patel DJ. Direct correlation of exchangeable and nonexchangeable protons on purine bases in 13C,15N-labeled RNA using a HCCNH-TOCSY experiment. J. Am. Chem. Soc. 1996;118:689–690. [Google Scholar]
- 13.Rinnenthal J, Richter C, Nozinovic S, Fürtig B, Lopez J, Glaubitz C, Schwalbe H. RNA phosphodiester backbone dynamics of a perdeuterated cUUCGg tetraloop RNA from phosphorus-31 NMR relaxation analysis. J. Biomol. NMR. 2009;45:143–155. doi: 10.1007/s10858-009-9343-x. [DOI] [PubMed] [Google Scholar]
- 14.Blose JM, Proctor DJ, Veeraraghavan N, Misra VK, Bevilacqua PC. Contribution of the closing base pair to exceptional stability in RNA tetraloops: roles for molecular mimicry and electrostatic factors. J. Am. Chem. Soc. 2009;131:8474–8484. doi: 10.1021/ja900065e. [DOI] [PubMed] [Google Scholar]
- 15.Tuerk C, Gauss P, Thermes C, Groebe DR, Gayle M, Guild N, Stormo G, d'A;ubenton-Carafa Y, Uhlenbeck OC, Tinoco I, et al. CUUCGG hairpins: extraordinarily stable RNA secondary structures associated with various biochemical processes. Proc. Natl Acad. Sci. USA. 1988;85:1364–1368. doi: 10.1073/pnas.85.5.1364. [DOI] [PMC free article] [PubMed] [Google Scholar]
- 16.Sakata T, Hiroaki H, Oda Y, Tanaka T, Ikehara M, Uesugi S. Studies on the structure and stabilizing factor of the CUUCGG hairpin RNA using chemically synthesized oligonucleotides. Nucleic Acids Res. 1990;18:3831–3839. doi: 10.1093/nar/18.13.3831. [DOI] [PMC free article] [PubMed] [Google Scholar]
- 17.Allain FHT, Varani G. Structure of the P1 helix from group I self-splicing introns. J. Mol. Biol. 1995;250:333–353. doi: 10.1006/jmbi.1995.0381. [DOI] [PubMed] [Google Scholar]
- 18.Miller JL, Kollman PA. Theoretical studies of an exceptionally stable RNA tetraloop: observation of convergence from an incorrect NMR structure to the correct one using unrestrained molecular dynamics. J. Mol. Biol. 1997;270:436–450. doi: 10.1006/jmbi.1997.1113. [DOI] [PubMed] [Google Scholar]
- 19.Williams DJ, Hall KB. Unrestrained stochastic dynamics simulations of the UUCG tetraloop using an implicit solvation model. Biophys. J. 1999;76:3192–3205. doi: 10.1016/S0006-3495(99)77471-0. [DOI] [PMC free article] [PubMed] [Google Scholar]
- 20.Ennifar E, Nikulin A, Tishchenko S, Serganov A, Nevskaya N, Garber M, Ehresmann B, Ehresmann C, Nikonov S, Dumas P. The crystal structure of UUCG tetraloop. J. Mol. Biol. 2000;304:35–42. doi: 10.1006/jmbi.2000.4204. [DOI] [PubMed] [Google Scholar]
- 21.Cheong C, Varani G, Tinoco I. Solution structure of an unusually stable RNA hairpin, 5GGAC(UUCG)GUCC. Nature. 1990;346:680–682. doi: 10.1038/346680a0. [DOI] [PubMed] [Google Scholar]
- 22.Tuerk C, Gauss P, Thermes C, Groebe DR, Gayle M, Guild N, Stormo G, d'A;ubenton-Carafa Y, Uhlenbeck OC, Tinoco I., Jr CUUCGG hairpins: extraordinarily stable RNA secondary structures associated with various biochemical processes. Proc. Natl Acad. Sci. USA. 1988;85:1364–1368. doi: 10.1073/pnas.85.5.1364. [DOI] [PMC free article] [PubMed] [Google Scholar]
- 23.Williams DJ, Hall KB. Experimental and theoretical studies of the effects of deoxyribose substitutions on the stability of the UUCG tetraloop. J. Mol. Biol. 2000;297:251–265. doi: 10.1006/jmbi.2000.3547. [DOI] [PubMed] [Google Scholar]
- 24.Hennig M, Fohrer J, Carlomagno T. Assignment and NOE analysis of 2′-hydroxyl protons in RNA: implications for stabilization of RNA A-form duplexes. J. Am. Chem. Soc. 2005;127:2028–2029. doi: 10.1021/ja043390o. [DOI] [PubMed] [Google Scholar]
- 25.Fohrer J, Hennig M, Carlomagno T. Influence of the 2′-hydroxyl group conformation on the stability of A-form helices in RNA. J. Mol. Biol. 2006;356:280–287. doi: 10.1016/j.jmb.2005.11.043. [DOI] [PubMed] [Google Scholar]
- 26.Ying J, Bax A. 2′-hydroxyl proton positions in helical RNA from simultaneously measured heteronuclear scalar couplings and NOEs. J. Am. Chem. Soc. 2006;128:8372–8373. doi: 10.1021/ja0606226. [DOI] [PubMed] [Google Scholar]
- 27.Schwalbe H, Marino JP, Glaser SJ, Griesinger C. Measurement of H,H-coupling constants associated with v1, v2, and v3 in uniformly 13C-labeled RNA by HCC-TOCSY-CCH-E.COSY. J. Am. Chem.l Soc. 1995;117:7251–7252. [Google Scholar]
- 28.Legault P, Jucker FM, Pardi A. Improved measurement of 13C, 31P J coupling constants in isotopically labeled RNA. FEBS Lett. 1995;362:156–160. doi: 10.1016/0014-5793(95)00232-x. [DOI] [PubMed] [Google Scholar]
- 29.Marino JP, Schwalbe H, Anklin C, Bermel W, Crothers DM, Griesinger C. Three-dimensional triple-resonance 1H, 13C, 31P experiment: sequential through-bond correlation of ribose protons and intervening phosphorus along the RNA oligonucleotide backbone. J. Am. Chem. Soc. 1994;116:6472–6473. [Google Scholar]
- 30.Schwalbe H, Marino JP, King GC, Wechselberger R, Bermel W, Griesinger C. Determination of a complete set of coupling constants in 13C-labeled oligonucleotides. J. Biomol. NMR. 1994;4:631–644. doi: 10.1007/BF00404274. [DOI] [PubMed] [Google Scholar]
- 31.Schwalbe H, Samstag W, Engels JW, Bermel W, Griesinger C. 3J(C,P) and 3J(H,P) coupling constants in nucleotide oligomers with FIDS-HSQC. J. Biomol. NMR. 1993;3:479–486. [Google Scholar]
- 32.Richter C, Reif B, Wörner K, Quant S, Marino JP, Engels JW, Griesinger C, Schwalbe H. A new experiment for the measurement of nJ(C,P) coupling constants including 3J(C4′i,Pi) and 3J(C4′i,Pi + 1) in oligonucleotides. J. Biomol. NMR. 1998;12:223–230. doi: 10.1023/A:1008258226683. [DOI] [PubMed] [Google Scholar]
- 33.Hu W, Bouaziz S, Skripkin E, Kettani A. Determination of and coupling constants in 13C-labeled nucleic acids using constant-time HMQC. J. Magn. Reson. 1999;139:181–185. doi: 10.1006/jmre.1999.1785. [DOI] [PubMed] [Google Scholar]
- 34.Carlomagno T, Hennig M, Williamson JR. A novel PH-CT-COSY methodology for measuring JPH coupling constants in unlabeled nucleic acids. Application to HIV-2 TAR RNA. J. Biomol. NMR. 2002;22:65–81. doi: 10.1023/a:1013811631477. [DOI] [PubMed] [Google Scholar]
- 35.Clore GM, Murphy EC, Gronenborn AM, Bax A. Determination of three-bond1H3′-31P couplings in nucleic acids and protein–nucleic acid complexes by quantitative J correlation spectroscopy. J. Magn. Reson. 1998;134:164–167. doi: 10.1006/jmre.1998.1513. [DOI] [PubMed] [Google Scholar]
- 36.Duchardt E, Richter C, Reif B, Glaser SJ, Engels JW, Griesinger C, Schwalbe H. Measurement of 2J(H,C)- and 3J(H,C)-coupling constants by α/β selective HC(C)H-TOCSY. J. Biomol. NMR. 2001;21:117–126. doi: 10.1023/a:1012474811265. [DOI] [PubMed] [Google Scholar]
- 37.Boisbouvier J, Brutscher B, Pardi A, Marion D, Simorre J-P. NMR determination of sugar puckers in nucleic acids from CSA-dipolar cross-correlated relaxation. J. Am. Chem. Soc. 2000;122:6779–6780. [Google Scholar]
- 38.Nozinovic S, Richter C, Rinnenthal J, Fürtig B, Schwalbe H. Quantitative Γ-HCP experiment for the determination of the angles α and ξ in the phosphodiester backbone in oligonucleotides. 2009. in preparation. [DOI] [PubMed]
- 39.Brunger AT, Adams PD, Clore GM, DeLano WL, Gros P, Grosse-Kunstleve RW, Jiang JS, Kuszewski J, Nilges M, Pannu NS, et al. Crystallography & NMR system: a new software suite for macromolecular structure determination. Acta Crystallogr. D Biol. Crystallogr. 1998;54:905–921. doi: 10.1107/s0907444998003254. [DOI] [PubMed] [Google Scholar]
- 40.Linge JP, O'D;onoghue SI, Nilges M. Automated assignment of ambiguous nuclear overhauser effects with ARIA. Methods Enzymol. 2001;339:71–90. doi: 10.1016/s0076-6879(01)39310-2. [DOI] [PubMed] [Google Scholar]
- 41.Linge JP, Williams MA, Spronk CAEM, Bonvin AMJJ, Nilges M. Refinement of protein structures in explicit solvent. Proteins. 2003;50:496–506. doi: 10.1002/prot.10299. [DOI] [PubMed] [Google Scholar]
- 42.Pranata J, Wierschke SG, Jorgensen WL. OPLS potential functions for nucleotide bases. Relative association constants of hydrogen-bonded base pairs in chloroform. J. Am. Chem. Soc. 1991;113:2810–2819. [Google Scholar]
- 43.Jorgensen WL, Tirado-Rives J. The OPLS [optimized potentials for liquid simulations] potential functions for proteins, energy minimizations for crystals of cyclic peptides and crambin. J. Am. Chem. Soc. 2002;110:1657–1666. doi: 10.1021/ja00214a001. [DOI] [PubMed] [Google Scholar]
- 44.Kuszewski J, Schwieters C, Clore GM. Improving the accuracy of NMR structures of DNA by means of a database potential of mean force describing base:base positional interactions. J. Am. Chem. Soc. 2001;123:3903–3918. doi: 10.1021/ja010033u. [DOI] [PubMed] [Google Scholar]
- 45.Dingley AJ, Grzesiek S. Direct observation of hydrogen bonds in nucleic acid base pairs by internucleotide 2JNN couplings. J. Am. Chem. Soc. 1998;120:8293–8297. [Google Scholar]
- 46.Schneider B, Moravek Z, Berman HM. RNA conformational classes. Nucleic Acids Res. 2004;32:1666–1677. doi: 10.1093/nar/gkh333. [DOI] [PMC free article] [PubMed] [Google Scholar]
- 47.Gorenstein DG. Phosphorus-31 NMR: Principles and Applications. New York: Academic Press; 1984. [Google Scholar]
- 48.Varani G, Aboul-ela F, Allain FHT. NMR investigation of RNA structure. Prog. Nucl. Magn. Reson. Spectr. 1996;29:51–127. [Google Scholar]
- 49.Marino JP, Schwalbe H, Glaser SJ, Griesinger C. Determination of γ and stereospecific assignment of H5′ protons by measurement of 2J and 3J coupling constants in uniformly 13C labeled RNA. J. Am. Chem. Soc. 1996;118:4388–4395. [Google Scholar]
- 50.Richter C, Griesinger C, Felli I, Cole PT, Varani G, Schwalbe H. Determination of sugar conformation in large RNA oligonucleotides from analysis of dipole–dipole cross correlated relaxation by solution NMR spectroscopy. J. Biomol. NMR. 1999;15:241–250. doi: 10.1023/a:1008319130714. [DOI] [PubMed] [Google Scholar]
- 51.Felli IC, Richter C, Griesinger C, Schwalbe H. Determination of RNA sugar pucker mode from cross-correlated relaxation in solution NMR spectroscopy. J. Am. Chem. Soc. 1999;121:1956–1957. doi: 10.1023/a:1008319130714. [DOI] [PubMed] [Google Scholar]
- 52.Hansen MR, Mueller L, Pardi A. Tunable alignment of macromolecules by filamentous phage yields dipolar coupling interactions. Nat. Struct. Mol. Biol. 1998;5:1065–1074. doi: 10.1038/4176. [DOI] [PubMed] [Google Scholar]
- 53.Jorgensen WL, Tirado-Rives J. The OPLS [optimized potentials for liquid simulations] potential functions for proteins, energy minimizations for crystals of cyclic peptides and crambin. J. Am. Chem. Soc. 1988;110:1657–1666. doi: 10.1021/ja00214a001. [DOI] [PubMed] [Google Scholar]
- 54.Lu X-J, Olson WK. 3DNA: a versatile, integrated software system for the analysis, rebuilding and visualization of three-dimensional nucleic-acid structures. Nat. Protoc. 2008;3:1213–1227. doi: 10.1038/nprot.2008.104. [DOI] [PMC free article] [PubMed] [Google Scholar]
- 55.Gyi JI, Lane AN, Conn GL, Brown T. The orientation and dynamics of the C24-OH and hydration of RNA and DNA·RNA hybrids. Nucleic Acids Res. 1998;26:3104–3110. doi: 10.1093/nar/26.13.3104. [DOI] [PMC free article] [PubMed] [Google Scholar]
- 56.Greatorex J, Gallego J, Varani G, Lever A. Structure and stability of wild-type and mutant RNA internal loops from the SL-1 domain of the HIV-1 packaging signal. J. Mol. Biol. 2002;322:543–557. doi: 10.1016/s0022-2836(02)00776-3. [DOI] [PubMed] [Google Scholar]
- 57.Ramos A, Varani G. Structure of the acceptor stem of Escherichia coli tRNA Ala: role of the G3.U70 base pair in synthetase recognition. Nucleic Acids Res. 1997;25:2083–2090. doi: 10.1093/nar/25.11.2083. [DOI] [PMC free article] [PubMed] [Google Scholar]
- 58.Yoshizawa S, Fourmy D, Puglisi JD. Structural origins of gentamicin antibiotic action. EMBO J. 1998;17:6437–6448. doi: 10.1093/emboj/17.22.6437. [DOI] [PMC free article] [PubMed] [Google Scholar]
- 59.Carter AP, Clemons WM, Brodersen DE, Morgan-Warren RJ, Wimberly BT, Ramakrishnan V. Functional insights from the structure of the 30S ribosomal subunit and its interactions with antibiotics. Nature. 2000;407:340–348. doi: 10.1038/35030019. [DOI] [PubMed] [Google Scholar]
- 60.Tishchenko S, Nikulin A, Fomenkova N, Nevskaya N, Nikonov O, Dumas P, Moine H, Ehresmann B, Ehresmann C, Piendl W, et al. Detailed analysis of RNA-protein interactions within the ribosomal protein S8-rRNA complex from the archaeon Methanococcus jannaschii. J. Mol. Biol. 2001;311:311–324. doi: 10.1006/jmbi.2001.4877. [DOI] [PubMed] [Google Scholar]
- 61.Lynch SR, Puglisi JD. Structure of a eukaryotic decoding region A-site RNA. J. Mol. Biol. 2001;306:1023–1035. doi: 10.1006/jmbi.2000.4419. [DOI] [PubMed] [Google Scholar]
- 62.Colmenarejo G, Tinoco I., Jr Structure and thermodynamics of metal binding in the P5 helix of a group I intron ribozyme. J. Mol. Biol. 1999;290:119–135. doi: 10.1006/jmbi.1999.2867. [DOI] [PubMed] [Google Scholar]
- 63.Bae SH, Cheonq HK, Lee JH, Cheong C, Kainosho M, Choi BS. Structural features of an influenza virus promoter and their implications for viral RNA synthesis. Proc. Natl Acad. Sci. USA. 2001;98:10602–10607. doi: 10.1073/pnas.191268798. [DOI] [PMC free article] [PubMed] [Google Scholar]
- 64.Nikulin A, Serganov A, Ennifar E, Tishchenko S, Nevskaya N, Shepard W, Portier C, Garber M, Ehresmann B, Ehresmann C, et al. Crystal structure of the S15−rRNA complex. Nat. Struct. Mol. Biol. 2000;7:273–277. doi: 10.1038/74028. [DOI] [PubMed] [Google Scholar]
- 65.Walters KJ, Russu IM. Sequence dependence of purine C8H exchange kinetics in the dodecamer 5′-d(CGCGAATTCGCG)-3′. Biopolymers. 1992;33:943–951. doi: 10.1002/bip.360330610. [DOI] [PubMed] [Google Scholar]
- 66.Zweckstetter M, Bax A. Prediction of sterically induced alignment in a dilute liquid crystalline phase: aid to protein structure determination by NMR. J. Am. Chem. Soc. 2000;122:3791–3792. [Google Scholar]
Associated Data
This section collects any data citations, data availability statements, or supplementary materials included in this article.