

Abstract
The effects of lifelong, moderate excess release of glutamate (Glu) in the CNS have not been previously characterized. We created a transgenic (Tg) mouse model of lifelong excess synaptic Glu release in the CNS by introducing the gene for glutamate dehydrogenase 1 (Glud1) under the control of the neuron-specific enolase promoter. Glud1 is, potentially, an important enzyme in the pathway of Glu synthesis in nerve terminals. Increased levels of GLUD protein and activity in CNS neurons of hemizygous Tg mice were associated with increases in the in vivo release of Glu after neuronal depolarization in striatum and in the frequency and amplitude of miniature EPSCs in the CA1 region of the hippocampus. Despite overexpression of Glud1 in all neurons of the CNS, the Tg mice suffered neuronal losses in select brain regions (e.g., the CA1 but not the CA3 region). In vulnerable regions, Tg mice had decreases in MAP2A labeling of dendrites and in synaptophysin labeling of presynaptic terminals; the decreases in neuronal numbers and dendrite and presynaptic terminal labeling increased with advancing age. In addition, the Tg mice exhibited decreases in long-term potentiation of synaptic activity and in spine density in dendrites of CA1 neurons. Behaviorally, the Tg mice were significantly more resistant than wild-type mice to induction and duration of anesthesia produced by anesthetics that suppress Glu neurotransmission. The Glud1 mouse might be a useful model for the effects of lifelong excess synaptic Glu release on CNS neurons and for age-associated neurodegenerative processes.
Introduction
Glutamate (Glu) is both a rapidly acting transmitter and a signaling molecule with long-lasting effects on neuronal structure and function (Cotman et al., 1988; Komuro and Rakic, 1993). Excessive excitation of neurons by Glu causes neurotoxicity (Choi, 1992), a process linked to several pathologic states in the CNS (Schwarcz and Meldrum, 1985). The molecular and cellular mechanisms of neurodegeneration caused by acute exposure of neurons to excess Glu have been studied extensively (Aarts et al., 2003). However, acute treatments with Glu analogs may not fully replicate the effects of chronic, localized, moderate excess release of Glu at synapses occurring throughout the life span of an organism. Such release may be an important parameter in the control of synapse structure and function, dendrite and nerve terminal integrity, or neuronal injury. Changes in synaptic function and loss of select glutamatergic neurons or their synapses occur during aging or in age-associated neurodegenerative diseases (Masliah et al., 1993; Morrison and Hof, 1997; Francis, 2003), and changes in Glu release or reuptake are considered important for the observed synaptic and neuronal losses. However, the effect of chronic, moderate, transient increases in extracellular Glu in brain on synaptic morphology and function or neuronal loss has been difficult to produce in experimental animals in vivo.
Two animal models of excess extracellular Glu accumulation and the resultant effects on neuronal structure and function are the null mutant mice for the Glu transporter Slc1a2 (Eaat2) and the tuberous sclerosis complex-1 (Tsc1) genes. These mice suffer extensive brain damage and marked reduction in life span as a result of loss of function of Glu transporters and high levels of tonic Glu accumulation (1.5- to 32-fold normal levels) in the extracellular medium (Rothstein et al., 1996; Tanaka et al., 1997; Zeng et al., 2007). Neither of these two mutant mice would be a good model for probing the effects on neurons of moderate increases in depolarization-induced Glu release from nerve terminals across the life span of an organism. To achieve moderate increases in Glu release by CNS neurons and study the effects of excess synaptic Glu release on neuronal and synaptic structure and function, we created transgenic (Tg) mice with extra copies of the gene for Glud1. The protein GLUD1 is a mitochondrial enzyme that converts Glu to 2-oxoglutarate (2-OG); the 2-OG generated in mitochondria is carried to the cytosol of nerve terminals, converted back to Glu, and stored in synaptic vesicles (i.e., feeds into the pool of releasable Glu) (Palaiologos et al., 1988). Thus, GLUD activity may regulate Glu transmitter formation at nerve endings and, generally, Glu homeostasis.
We describe below the generation and characterization of Tg mice that overexpress the Glud1 transgene in CNS neurons. These mice exhibited increased Glu release after depolarization, increased frequency and amplitude of miniature EPSCs (mEPSCs) in hippocampus, relative resistance to anesthetic agents known to suppress Glu neurotransmission, age-associated neuronal losses in select brain regions, age-related alterations in dendrite and synaptic structures, altered dendrite spine density, and diminished long-term potentiation (LTP) of synaptic activity.
Materials and Methods
Generation of Glud1 and Egfp Tg mice.
Experimental procedures related to animals followed the procedures of the Institutional Animal Care and Use Committee of the University of Kansas and those of the National Institutes of Health. Tg mice were generated by microinjecting fertilized oocytes from super-ovulating C57BL6/SJL hybrid mice with linearized DNA containing the cDNA of mouse Glud1 (Tzimagiorgis and Moschonas, 1991). The cDNA was placed under the control of the Nse promoter. This promoter was excised from pNSE-LacZ vector (Forss-Petter et al., 1990) by digesting the SV40 polyA tail (BamHI and EcoRI), blunting and cloning it into pGEM-7Z between SmaI and BamHI. Then the Nse promoter was excised from pNSE-LacZ (BamHI and SphI digestion) and cloned into the modified pGEM-7Z. A linker containing multiple restriction sites (BglII/EcoRV/HindIII/MluI/XbaI/KpnI; sense sequence, 5′-AGATCTGATATCAAGCTTACGCGTCTAGAGGTAC-3′) was cloned between SphI (blunted) and KpnI of pGEM-7Z, which contained the Nse promoter and SV40 polyA tail (pNSE-GEM-7Z). The open reading frame (ORF) of Glud1 cDNA was excised from pUC19 [by SacI 5′-untranslated region (UTR)/HpaI 3′-UTR] and subcloned into the Eco72I site of a reconstructed pSindRep5 Sindbis virus vector, into which a polylinker (BclI/XhoI/SacI/NotI/PvuI) was introduced. The orientation of the Glud1 ORF insert was confirmed by sequencing; the insert was digested (XbaI/XhoI) and cloned into pNSE-GEM-7Z to create the pNSE-GLUD1 vector. This vector was digested with EcoRI, and the DNA was microinjected into the pronuclei of 215 fertilized mouse oocytes and transferred to the oviducts of pseudopregnant mice. Very similar procedures to those for Glud1 vector construction were used to generate the vector for microinjection of pNSE-EGFP. A total of 80 oocytes were injected with the linearized NSE-EGFP vector to generate the Egfp Tg mice.
Forty-eight pups were born after transfer of oocytes microinjected with the pNSE-GLUD1 construct. Of these pups, four had the transgene for Glud1. Genotyping was performed on genomic DNA extracted from tail biopsies obtained from 3- to 4-week-old pups. The DNA was subjected to Southern blot and PCR analysis. For the identification of the Glud1 transgene by PCR, the primers used were as follows: F1, 5′-GATATCGGGTGCATCTGAG-3′; and R1, 5′-GGTTTATGAGGACACAGAGG-3′ (900 bp product). PCR amplification was performed using pfu polymerase and either 100 ng of genomic DNA or 1 ng of DNA from the pNSE-GLUD1 vector (reaction conditions: 32 cycles of 95°C for 30 s, 53°C for 30 s, 72°C for 1 min). Southern blot analyses were used to confirm the PCR results. pNSE-GLUD1 and genomic DNA from tail clippings were digested with EcoRV. A 790 bp fragment from the Glud1 ORF was used as a probe for hybridization with genomic DNA.
Estimation of Glud1 gene copy number.
Genomic DNA from founder Tg and wild-type (wt) mice was extracted (DNeasy tissue kit; Qiagen), and the DNA concentration was determined (A260/A280 nm; Bioanalyzer). Quantitative PCR (qPCR) was used to measure the amount of Glud1 and Grin1 DNA. The values for Grin1 in each sample were used to standardize the DNA measurements for the estimation of Glud1 gene copy numbers in all samples. For measurements of Grin1 DNA, the primers used were F1, 5′-CCAGGCACTACC-3′, and R1, 5′-GGCTGCAGATGGAATGATTA-3′; and the qPCR probe for binding to the amplicons was 5′-6-FAM-GTGGTTGGGCTGGGCTTTAGATGT-BHQ-1-3′ (Biosearch Technologies). For the Glud1 transgene, primers and probe were designed according to the sequence of exon 1 of Glud1: F1, 5′-GGTGCGCGGCATCCT-3′; R1, 5′-AACCATGTGTTGAGCCTCTCCT-3′; and probe 5′-6-FAM-AGGATCATCAAGCCCTG-NFQ-MGB-3′ (Applied Biosystems). The polymerase was ExTaq (Takara), and gene copy numbers were calculated based on ratios of Glud1 to wt Ct values.
Immunoblot estimates of GLUD1 and NMDA receptor subunit levels.
To measure the levels of GLUD1 protein in wt and Tg mouse brains, whole brains from 6- to 8-month-old mice were excised and homogenized, and 35 μg of protein from each homogenate was analyzed by SDS-PAGE and immunoblotting (Pal et al., 2003). Anti-GLUD1 antibodies (polyclonal; Novus Biologicals) were used at 1:1000 dilution. Relative levels of expression were estimated by densitometry. Homogenates were obtained from sex-matched littermate pairs of wt and Tg, and the samples processed at the same time. To measure the levels of NMDA receptor subunits NR1 and NR2A, the hippocampus, striatum, and fronto-parietal cortex were dissected from three male 6-month-old wt and Tg mice. The P2 fraction was isolated from homogenates from these three regions as described below. Equal amounts of P2 protein (50 μg) were analyzed by immunoblot assays as described above for GLUD1. Immune labeling with NR1 and NR2A (both polyclonal; Millipore) and actin (monoclonal; Millipore) antibodies (1:1000 dilution for all) was performed. Actin was used as a loading control, and the levels of each receptor subunit in the samples were estimated as the ratio of immune reaction over that of the respective actin control (Pal et al., 2003).
Mitochondria and synaptosome preparation and measurement of GLUD activity in vitro and in situ.
Brain tissue from wt and Tg mice was excised and placed in sucrose buffer containing (in mm) 320 sucrose, 0.5 MgSO4, 10 KCl, 1 dithiothreitol, 1 4-(2-aminoethyl)benzenesulfonyl fluoride hydrochloride, 1 sodium orthovanadate, 10 HEPES, pH 7.4 and a mixture of protease inhibitors (1:100 dilution; Sigma). Both a crude mitochondrial (P2) and a purified synaptosome fraction were isolated (Michaelis et al., 1983). The pelleted organelles were resuspended in 1–2 ml of buffer (0.32 m sucrose, 10 mm α-aminocaproic acid, 0.1 mm EGTA, 1:100 diluted protease inhibitor mixture, pH 7.5), aliquoted in small volumes, and stored at −70°C.
GLUD activity in P2 fractions (50–100 μl samples) was measured after thawing the samples in 1 ml (final volume) of 50 mm Na-phosphate buffer, pH 7.4, containing 1 mm potassium cyanide and 0.4% Triton X-100. The suspension was incubated for 5 min at 37°C and centrifuged at 16,000 × g for 20 min, and the clear supernatant containing extracted mitochondrial GLUD was used for measurements of enzyme activity. Protein content was measured (Michaelis et al., 1983), and GLUD enzyme assays were performed in either the direction of Glu deamination (Plaitakis et al., 2000) or the direction of 2-OG amination (Mazon, 1978). The deamination of Glu was measured at 37°C as follows: 30 μg sample protein was added to the reaction buffer (in mm: 50 Na-phosphate buffer, pH 7.4, 1 ADP, and 0.2 NAD+) and preincubated for 2 min at 37°C, and the reaction was initiated by adding l-Glu. The NADH produced was monitored at 340 nm from 0 to 10 min, and the initial velocity was calculated. Enzyme activities were measured by varying the concentrations of either Glu (0.05–20 mm) or NAD+ (0–200 μm), while keeping the concentration of the allosteric activator ADP constant. The KM and Vmax values ± SEM were calculated using SigmaPlot (Zaidi et al., 1998). The measurement of time-dependent kinetics of amination of 2-OG in freshly prepared synaptosomes was performed using similar methods to those for the P2 fraction and a reaction mixture containing (in mm) 100 potassium phosphate, pH 7.8, 50 NH4Cl, 0.2 NADH, and 2.5 potassium 2-OG. The NADH conversion to NAD+ was determined based on the decrease in absorbance at 340 nm. The integrated Michaelis equation Vapp · t = ([S0] − [S]) + (KM · ln([S0]/[S])) (Wharton and Szawelski, 1982) was used to estimate Vapp and KM.
GLUD activity in brain cells in situ was measured in tissue sections as described previously (Kugler and Baier, 1992). In brief, 20-μm-thick cryotome sections from Glud1 and wt brains were rapidly frozen in liquid N2, mounted on slides, air dried at 23°C, and incubated for 20 min in a medium containing 50 mm Na-Glu, 5 mm NAD+, 10 mm NaN3, 5 mm ADP, 20 mm NaCl, 0.15 mm phenazine methosulfate, 5 mm nitroblue tetrazolium chloride, 0.05 mm MgSO4, and 0.1 × 10⁻³ zinc acetate, in 50 mm HEPES buffer, pH 7.5, plus 22% polyvinyl alcohol. Background staining was obtained in parallel sections incubated in the absence of Glu. After rinsing the sections in ice-cold water, they were air dried, and microscopic images were obtained within 12 h of the end of the reaction.
Magnetic resonance spetroscopy measurements of brain amino acids.
1H magnetic resonance spetroscopy (MRS) data were acquired from the hippocampus and striatum of 28 Glud1 Tg and 13 wt mice (age, 9 months) using a Varian 9.4 T system. During the experiments, the animals were anesthetized (1:1 air:oxygen plus 1–2% isoflurane), and their core temperature maintained at 37°C. Magnetic field homogeneity was adjusted using a fast, automatic shimming technique by mapping along projections (Gruetter, 1993). Spin echo, full-intensity acquired localized spectroscopy (echo time, 3 ms; repetition time, 4 s) (Mlynarik et al., 2006) was used to acquire 1H MRS data from voxels (∼5 μl) in hippocampus and striatum. The number of transients for MR spectra was 320–480 for the hippocampus and 480–640 for the striatum. The concentrations of the neurochemicals alanine, GABA, glutamine, and Glu were quantified using the LCModel (Linear Combination of Model spectra) analysis (Provencher, 1993).
Histology, immunohistochemistry, and labeling with 1,1′-dioctadecyl-3,3,3′,3′-tetramethylindocarbocyanine.
Mouse brains were immersion fixed in 4% paraformaldehyde in PBS for 72 h at 4°C, cryoprotected (incubation in 30% sucrose–PBS), and frozen by exposure for 30 s to 2-methyl-butane at liquid N2 temperatures. Coronal sections (24 μm thickness) were cut in a cryotome and transferred to gelatin-coated glass slides. For staining with methylene blue, the sections were air dried, stained with 0.5% (w/v) dye solution (5 min at 23°C), rinsed in distilled H2O, dehydrated through graded ethanol, cleared with xylene, and mounted with permount. For immunofluorescence staining, sections were blocked with 3% (w/v) gelatin in PBS (1 h at 37°C), treated with 0.1% Triton X-100 in PBS (15 min at 23°C), and reacted (overnight at 4°C, then for 1 h at 23°C) with the following primary antibodies: anti-GLUD1 (1:2000), anti-microtubule-associated protein 2A (MAP2A; monoclonal; 1:500 or 1:1000; Millipore), anti-synaptophysin (polyclonal; 1:1000; Millipore), anti-neuron-specific enolase (NSE; monoclonal; 1:250; Millipore), anti-ubiquitin (monoclonal; 1:500; Millipore), and anti-vimentin (polyclonal; 1:400; Millipore). After rinsing in PBS, the sections were incubated (2 h at 37°C) with fluorescent dye-labeled secondary antibodies (Alexa 568 goat anti-rabbit or Alexa 488 goat anti-mouse; 1:1000 dilution in PBS; Invitrogen) and processed (Pal et al., 2003). Some sections were double labeled with SYTOX blue (Invitrogen) plus one of the antibodies. SYTOX labeling was performed after the reaction with the secondary antibody. The sections were rinsed first in PBS (5 min at 23°C) and then with Tris-EDTA (TE) buffer (10 mm Tris and 1 mm EDTA, pH 7.5; 5 min), incubated with dye (1:1000 dilution in TE; 30 min at 23°C), mounted, and viewed using either a Zeiss LSM 510 Meta confocal (Pal et al., 2003) or a spinning disc Olympus 1X81 microscope. Images were processed using Slidebook 4.1, Image J, and Photoshop for quantification of pixel density, dendrite length determination, spine characterization and density, and three-dimensional reconstruction of images.
The methods used to stain neurons with both 1,1′-dioctadecyl-3,3,3′,3′-tetramethylindocarbocyanine (DiI) dye (Invitrogen) and anti-MAP2A antibodies were those described previously (Kim et al., 2007; Matsubayashi et al., 2008), with some modifications. The sections were obtained from mice perfused with 2% paraformaldehyde–PBS. After additional fixation of the brain in the same fixative (4 h at 23°C), vibratome sections (100 μm) were cut, DiI crystals were delivered, and the sections were incubated in PBS for 14 h at 23°C to allow dye diffusion to occur. DiI crystals were applied to brain sections using micropipettes (Kim et al., 2007). To prepare the DiI micropipettes, a droplet of DiI dissolved in N,N-dimethylformamide (0.5% w/v) was placed on the tip of each glass pipette and dried (3–12 h, 60°C), and the crystals were delivered by touching the brain sections. After DiI diffusion, the sections were briefly incubated in 3% gelatin–PBS, followed by incubation for 30 min with digitonin (0.5 mg/ml in PBS). Labeling with anti-MAP2A antibodies and imaging by confocal microscopy followed as described above.
Microelectrode measurements of depolarization-induced Glu release and reuptake in striatum.
Glud1 Tg (10–12 months; n = 4) and wt (7–12 months; n = 9) male and female mice were group housed in a 12 h light/dark cycle with food and water ad libitum. Enzyme-based microelectrode arrays (MEAs) with platinum (Pt) recording surfaces were fabricated, assembled, and calibrated for in vivo mouse recordings according to published literature (Burmeister et al., 2000). The MEA assemblies for in vivo recordings consisted of an enzyme-based working electrode and a single-barrel glass micropipette (internal tip diameter, 12–15 μm) positioned at an equal distance from the four recording electrode sites (Burmeister and Gerhardt, 2001; Burmeister et al., 2002). Either an isotonic solution of 70 mm KCl (70 mm KCl, 79 mm NaCl, and 2.5 mm CaCl2, pH 7.4) or a 5 mm l-Glu solution (in physiological saline, pH 7.4) was loaded into the single-barrel glass micropipette. Glud1 and wt mice were anesthetized (1.25 g/kg urethane, i.p.) and placed in a stereotaxic frame fitted with a mouse adaptor in a manner similar to that described recently (Burmeister et al., 2002). A 200-μm-diameter Ag/AgCl reference electrode was implanted into the frontal cortex at a site remote from the recording areas. The MEA assemblies were lowered into the striatum in steps of 500 μm (Friedemann and Gerhardt, 1992) using the coordinates for mouse brain [from bregma: anteroposterior, +1.3; mediolateral, ±1.5; dorsoventral (DV), −2.25 to −3.75] (Franklin and Paxinos, 1997). Solutions were ejected from the glass micropipette using a Picospritzer II (Parker Hannifin). The volume ejected was monitored using a stereomicroscope fitted with a reticule (Friedemann and Gerhardt, 1992). Constant voltage amperometry was performed using a Fast Analytical Sensing Technology (FAST)-16 electrochemistry instrument (Quanteon, L.L.C.) and FAST software for four-channel simultaneous recordings (Burmeister and Gerhardt, 2001). All mice were killed at the end of a recording session by an overdose of anesthetic.
Dose–response studies were performed in each striatal recording site to determine the maximum K+-evoked responses in wt and Glud1 mice. Amperometric data, time, and pressure ejection marks for each individual Pt recording site were saved in the recording system. A modified Excel spreadsheet, in conjunction with individual electrode calibration constants, was used to analyze the l-Glu curves. The maximum signal amplitude (peak Glu concentration in micromolars) was determined for each signal and averaged across each mouse type. Approximately 10 signals per recording site were obtained from each DV position of the MEA in the striatum. These signals were averaged into a single data point, thus generating one data point for each DV position and a maximum of four data points per pass in the striatum of either hemisphere. Determination of the average amplitude of Glu released required that the volume of KCl ejected be carefully matched across experiments. Signals obtained from 70 mm KCl (100–200 nl) ejections in wt and Glud1 mice were used for analysis.
For the calculation of uptake rate kinetics (micromolars per second), only amplitudes of l-Glu released ranging between 3 and 13 μm were used in the analyses, regardless of the amount of stimulus needed to evoke the release. l-Glu uptake followed first-order-rate kinetics. Therefore, the uptake rate constant (k−1) was the logarithmic slope of l-Glu concentration versus time (sec−1) estimated by use of regression analyses (R2 ≥ 0.9). Multiplication of k−1 with the maximum amplitude of Glu signal yielded the uptake rate (micromolars per second).
Slice preparation and electrophysiological recordings.
Acute brain slices were prepared from 2.5- to 3-month-old wt and Tg mice as described previously (Belousov and van den Pol, 1997). Briefly, animals were anesthetized with isoflurane and decapitated. The hippocampi from both hemispheres were removed, and coronal hippocampal slices (400 μm thick) were prepared (at 2–4°C) and kept (at 20–22°C) in artificial CSF (ACSF) that contained (in mm) 124 NaCl, 3.0 KCl, 2.0 CaCl2, 2.0 MgCl2, 1.23 NaH2PO4, 26 NaHCO3, and 10 d-glucose (aerated, pH 7.3). A flow pipe perfusion system was used for slice perfusion at 4–5 ml/min (Belousov and van den Pol, 1997).
Measurements of mEPSCs were performed in CA1 pyramidal neurons using whole-cell voltage-clamp recording in the presence of 1 μm tetrodotoxin (a voltage-gated sodium channel blocker) in ACSF. A glass recording electrode was filled with an internal solution that included (in mm) 145 KMeSO4, 10 HEPES, 2 MgCl2, 0.1 CaCl2, 1.1 EGTA, 2 Na-ATP, 0.3 Na-GTP, and 5 QX 314 bromide (a blocker of voltage-activated sodium channels; pH 7.2, 3–7MΩ). mEPSCs were recorded in a gap-free mode at a holding membrane potential of −65 mV using the Multiclamp amplifier and Clampex software. The frequency and amplitude of mEPSCs were analyzed during 10 min recordings using Mini Analysis 5.0 software (Synaptosoft). An mEPSC event was considered if its amplitude was >5 pA.
Evoked field EPSPs (fEPSPs) were measured using extracellular recordings. A glass recording electrode filled with 3 m NaCl (2–3 MΩ) was placed in the stratum radiatum (SR) of the CA1 hippocampal region. A stimulating electrode made from a pair of Teflon-coated, 90% platinum/10% iridium wires (50 μm inner diameter) was used to evoke fEPSPs by stimulating the Schaffer collaterals (S48 stimulator; Grass Technologies). Evoked fEPSPs were recorded as described above for mEPSCs. For the analysis of fEPSPs, a 30 min baseline recording was established using low-frequency stimulation (0.033 Hz; 0.05 ms impulse duration) and the adjusted intensity that induced fEPSPs with ∼40% of the maximal fEPSP amplitude. LTP was induced using high-frequency stimulation (HFS) consisting of 0.05 ms impulse duration, 100 impulses, 100 Hz, with the same stimulation intensity as that used for baseline recordings. After HFS, the background electrical stimulation was continued using the stimulus parameters that were used for the baseline stimulation. The slope of fEPSPs was determined from the rise time period between the initial 10% and the final 90% of increase in fEPSP amplitude and was normalized relative to the average fEPSP slope obtained during baseline recording. Statistical analysis of fEPSP slopes was done using the data from a 10 min baseline recording (conducted immediately before HFS) and a 10 min post-HFS recording (conducted between 50 and 60 min after HFS). Signals were digitized at 20 kHz, filtered at 5 kHz, and stored on a personal computer. The tests were conducted blindly to the genotype of the experimental animal.
Measurement of loss of righting reflex and recovery from anesthesia.
A group of wt and Tg mice (8–10 months old) were used to determine sensitivity to the combination of anesthetics ketamine plus xylazine. The mice were tested using two different doses of the anesthetics administered 7 d apart. In the first study, 200 mg/kg ketamine and 13.3 mg/kg xylazine were administered intraperitoneally, and in the second study, 132 mg/kg ketamine and 8.8 mg/kg xylazine were injected. Immediately after the injections, each animal was placed on a heating pad, and the time to onset of loss of righting reflex (LORR) after the injection and the duration of LORR were recorded. LORR was defined as the time after the injection of anesthetics when each mouse lost its ability to right itself from a supine position to standing on all four paws. Duration of LORR was defined as the time between loss and recovery of the righting reflex.
Statistical analyses.
Student's t test (two-tailed) statistics were used to compare protein levels and enzyme activities involving a single measure of such levels or activities. All comparisons were between littermate male or female wt and Tg mice. The smallest samples were between groups of three littermates. Kinetic data points of enzyme activity or Glu release and reuptake, as well as multiple comparisons across brain regions, strata of regions, and ages of wt and Tg mice, were analyzed by ANOVA. Post hoc analyses between groups were performed using either Bonferroni's or Tukey's post hoc test. Statistical significance was defined as p ≤ 0.05. Statistical analysis of the sensitivity to anesthetic agents was by means of the t test. fEPSP data were performed using ANOVA followed by the post hoc Tukey's test and the two-tailed Student's t test (paired, when possible) with InStat software (GraphPad Software) and Clampfit 10 software (Molecular Devices). All data are presented as means ± SEM.
Results
Development of Glud1 Tg mice
The Tg mice were generated by pronuclear microinjections of mouse oocytes (C57BL6/SJL hybrid) with a construct containing the cDNA for mouse Glud1 under the control of the Nse promoter. The Nse gene is expressed only in neurons of brain and spinal cord (Peel et al., 1997). In preliminary studies, primary neuronal cultures transfected with either pNSE-lacZ or pNSE-EGFP vector exhibited expression of β-galactosidase (lacZ) or enhanced green fluorescent protein (EGFP) in neuronal cells but not in glia present in these cultures (data not shown). In addition, in Tg mice that had the transgene for Egfp under the control of the Nse promoter, we observed high EGFP fluorescence in regions enriched in neuronal cell bodies, not in myelinated axonal tracks (data not shown).
Four founder Tg mice were identified by genotyping as having the Glud1 transgene. The Glud1 gene-copy number in the founder mice was estimated by qPCR to be either six or eight copies (8.1 ± 2.1, 8.5 ± 2.2, 5.7 ± 2.3, and 6.4 ± 2.4 in founders 1–4, respectively). The founder mice were mated with C57BL/6, and genotyping revealed a normal Mendelian transmission pattern of the transgene (supplemental Fig. 1, available at www.jneurosci. org as supplemental material). All mice used in the present studies were hemizygous for the transgene, were from the third to 10th generation of crossbreeding, and were derived from all four founders. No consistent differences were seen in physiological and biochemical measures between mice derived from founders with eight and those with six extra Glud1 genes; therefore, the data from the Tg mice were not segregated on the basis of the founder mice from which the offspring were derived.
Total brain homogenate from mice (6–8 months of age) was subjected to immunoblot studies to determine GLUD1 levels in brain. GLUD1 levels in three Tg mice were 28.5 ± 2.6% higher than in three littermate wt mice (p = 0.01; df = 4; t test; n = 3 pairs). Biochemical measurements of GLUD enzyme activity in whole-brain homogenates at a single substrate (5 mm Glu) and cofactor (200 μm NAD+) concentration paralleled the protein immune reactivity measures. The enzyme activity was 35–40% higher in Tg compared with wt littermates (data not shown). The increases in GLUD1 levels and GLUD activity in brain homogenates were likely an underestimate of the increases in this enzyme in neurons because homogenates contain both glial and neuronal GLUD, whereas the Glud1 transgene under the Nse promoter would be expressed in neurons. Because of this consideration, additional analyses of enzyme activity were performed on the P2 fraction isolated from brain homogenates. This fraction contains mitochondria derived from neuronal and glial cell bodies, as well as those from nerve endings (synaptosomes). Substrate-dependent kinetics of GLUD activity in P2 revealed that the Vmax for Glu deamination in Tg mouse P2 was significantly (65%) higher than in the wt (Tg, 2.25 ± 0.26 μmol · mg−1 vs. wt, 1.36 ± 0.2 μmol · mg−1; p = 0.04, t test; n = 3). In contrast, the KM values did not differ significantly between Tg and wt mice for either the substrate Glu (Tg, 6.0 ± 0.9 mm vs. wt, 4.0 ± 1.1 mm; n = 3 pairs; p = 0.1) or the cofactor NAD+ (wt, 124.4 ± 11.1 μm vs. Tg, 86.5 ± 3.5 μm; p = 0.06, t test; n = 4). The observed KM values were in the range of those reported previously (Shashidharan et al., 1994; Plaitakis et al., 2000; Zhang et al., 2004). The greater difference between wt and Tg in the Vmax for GLUD in the P2 fraction vs. that in whole-brain homogenate was most likely attributable to the relative enrichment of P2 with synaptosomes and associated intraneuronal mitochondria. This assumption was confirmed by estimates of the Vmax for 2-OG amination to Glu in isolated synaptosome preparations. Based on kinetic analyses of enzyme activity using the integrated Michaelis equation (Wharton and Szawelski, 1982), the Vmax was 153% higher in Tg than wt brain synaptosomes (Tg, 21.7 μm · min−1vs. wt, 8.58 μm · min−1). Thus, intraneuronal mitochondria of Tg mice appeared to be substantially enriched in GLUD activity.
The results of in vitro biochemical assays were confirmed by in situ histochemical detection of GLUD activity in brain (Kugler and Baier, 1992). The deposition of tetrazolium dye in the pyramidal cell layer and dendritic fields of the stratum oriens (SO) and SR of the hippocampus CA1 and CA3 (supplemental Fig. 2, available at www.jneurosci.org as supplemental material) regions, and in the molecular layer of the dentate gyrus, was greater in Tg than wt mouse. Under high magnification, the increased GLUD activity in SO and SR appeared as labeling within nerve terminal fields. Marked differences between Tg and wt mice in the in situ GLUD activity were also detected in the striatum and cortex (data not shown).
Immunohistochemical studies also showed higher labeling by anti-GLUD1 antibodies in neurons of all brain regions of Tg compared with wt mice (e.g., in hippocampal pyramidal neurons of both CA1 and CA3) (Fig. 1). Densitometric measurements of GLUD1 immunoreactivity over equal-sized areas (3128 μm2) of each hippocampal region and each stratum of CA1 and CA3 from five to seven pairs of 6-month-old wt and Tg mice were used to quantify the differential levels of GLUD labeling in Tg versus wt mice. GLUD1 immunoreactivity was 53 ± 7.1% higher in Tg than wt mice across the three strata of CA1 and 52.9 ± 1.6% higher in Tg than wt across all strata of CA3. Statistical comparison of overall Tg versus wt levels of GLUD1 immunoreactivity in CA1 and CA3 indicated significant differences between Tg and wt mice in both regions (ANOVA; CA1: df = 1, 40; F = 10.1; p = 0.003; CA3: df = 1, 28; F = 25.4; p < 0.0005). There was no significant effect of region (CA1 or CA3) on GLUD1 immunoreactivity (ANOVA with Bonferroni post hoc comparisons; df = 1, 60; F = 2.3; p = 0.14) nor of the three strata, SO, stratum pyramidale (SP), and SR (p = 0.5–0.9). In other words, GLUD1 immunoreactivity was higher in Tg compared with wt mouse hippocampus in all strata and all regions of the hippocampus. Significantly increased levels of GLUD1 immunoreactivity in Tg versus wt mice (51.8% higher in Tg) were also detected in neurons of the cerebral cortex, of layers IV and V (ANOVA; df = 1, 10; F = 6.0; p = 0.034), and of other brain regions (data not shown). The biochemical and immunocytochemical data were indicative of overall increases in GLUD1 levels and activity in the brains of Tg mice, and the increases were not localized to select groups of cells.
Figure 1.
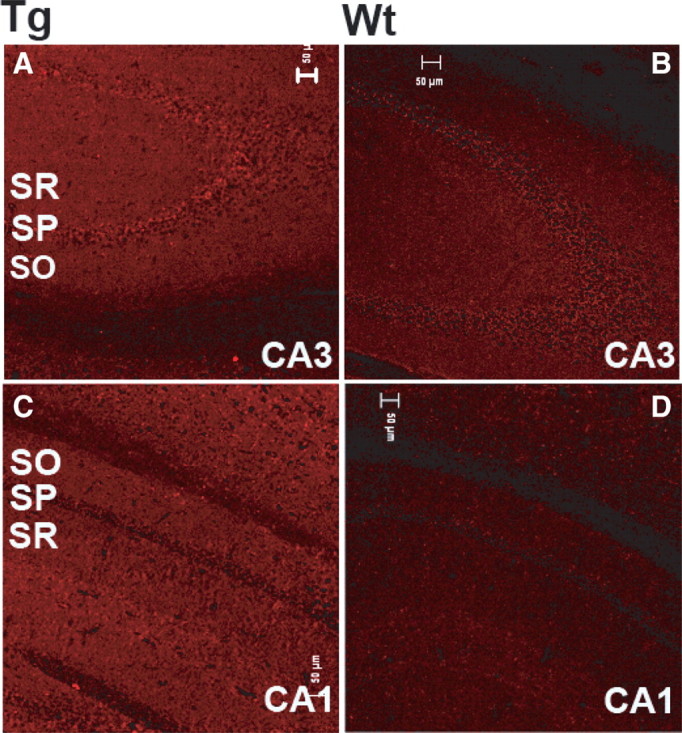
Immune labeling of GLUD-immunoreactive sites in CA3 (A, B) and CA1 (C, D) of the hippocampus of 12-month-old Tg and wt mice. Sections were immunolabeled with anti-GLUD polyclonal antibodies.Scale bars, 50 μm.
Amino acid concentrations in Tg and wt hippocampus and striatum in vivo
Glud1 expression in neurons of the brain may lead to increases in Glu formation (Yudkoff et al., 1991) and possibly detectable changes in whole-tissue concentrations of Glu in the CNS. Also, because Glu in the cytoplasm of neurons may function as the precursor for the synthesis of GABA, it is possible that some change in the concentration of GABA might occur in inhibitory neurons. In addition, the uptake of released Glu into glia could produce increases in glutamine levels in Tg mouse brain (Yudkoff et al., 1989), whereas the excess 2-OG formed in neuronal mitochondria and transported into the cytoplasm might lead to decreases in alanine as a result of transamination reactions in mice that overexpress Glud1 (Peng et al., 1991; Erecinska et al., 1994). To obtain simultaneous measurements of the concentration of several amino acids in the brains of living mice, we used the MRS approach for neurochemical measurements in ∼5 μl volume voxels of hippocampus and striatum. As can be seen in Table 1, in both hippocampus and striatum, the concentration of Glu was significantly increased, whereas the levels of GABA and glutamine in the same brain regions were not significantly different between wt and Tg mice. In contrast, the levels of alanine were significantly decreased in both regions. The concentrations of all four amino acids measured by MRS in wt mouse hippocampus and striatum were close to those previously determined in whole mouse brain using standard biochemical measurements (Levi et al., 1967; Agrawal et al., 1968). Based on the MRS measurements, the expression of Glud1 in neurons brought about moderate increases in Glu concentration in brain without increasing GABA levels in inhibitory neurons. The lack of changes in glutamine levels might indicate a relatively small contribution to the pool of mostly glial glutamine by the extra Glu formed, possibly in combination with a greater rate of conversion of neuronal glutamine to Glu in Tg mice. Finally, the decreased alanine levels might have been the result of increases in the transamination reaction between alanine and excess 2-OG in Tg mice, a reaction that leads to the formation of Glu.
Table 1.
Amino acid levels in adult (9-month-old) mouse hippocampus and striatum of wt and Tg mice measured by MRS
| Brain region/genotype | Amino acid concentration (μmol/g) |
|||
|---|---|---|---|---|
| Alanine | GABA | Glutamine | Glutamate | |
| Hippocampusa | ||||
| wt | 0.79 ± 039 | 1.85 ± 0.25 | 3.02 ± 0.46 | 8.99 ± 1.19 |
| Tg | 0.56 ± 0.14 | 1.85 ± 0.30 | 3.08 ± 0.42 | 9.76 ± 0.93 |
| (p = 0.02)b | (p = 0.99) | (p = 0.65) | (p = 0.03) | |
| Striatuma | ||||
| wt | 1.40 ± 0.84 | 2.81 ± 0.54 | 3.83 ± 0.73 | 8.01 ± 1.46 |
| Tg | 1.01 ± 0.33 | 2.45 ± 0.61 | 4.17 ± 0.42 | 8.87 ± 0.79 |
| (p = 0.04) | (p = 0.11) | (p = 0.08) | (p = 0.03) | |
aA total of 13 wt and 28 Tg mice were used to measure amino acid concentrations in the hippocampus. Amino acid concentrations in the striatum were measured in 10 of the 13 wt mice and in all 28 of the Tg mice. Data from 20 Tg mice were included in the calculation of alanine concentration in the hippocampus based on meeting the criteria of the LCModel for consistency and clarity. The values for the concentration of each amino acid are presented as the mean ± SD.
bStatistical significance of differences between wt and Tg mouse brain measurements is indicated by the p value (unpaired Student's t test).
Increases in stimulus-evoked Glu release from striatal neurons in vivo
To determine whether Glud1 overexpression leads to not only excess Glu formation but also increased l-Glu release dynamics in vivo, a self-referencing MEA for the measurement of Glu release and reuptake in vivo was used (Burmeister and Gerhardt, 2001; Burmeister et al., 2002; Thomas et al., 2009). Measurements were obtained from the striatum of anesthetized wt and Tg mice. Glu release was evoked by an isotonic solution of 70 mm KCl to simulate burst firing of Glu projections. The recorded signals were analyzed for maximum l-Glu amplitude and rate of uptake of released Glu. Local application of 70 mm KCl for 1–2 s in the striatum of Tg and wt mice produced robust, reproducible changes in extracellular l-Glu (Fig. 2); Glu release elicited by KCl applications was consistently higher in Tg mice (Fig. 2). For consistency in data analysis, only Glu signals elicited by ejections of 100–200 nl of 70 mm KCl were analyzed to obtain the average maximum amplitudes in wt (n = 35 signals) and Tg (n = 18 signals) mice. Ejection volumes of KCl eliciting these signals were, on average, nearly identical in wt and Tg mice (wt, 140 ± 6 nl; Tg, 134 ± 8 nl; p = 0.57; df = 50), yet the average maximum amplitude for Glu release was significantly greater in Tg than wt mice (wt, 6.3 ± 0.7 μm; Tg, 9.9 ± 1.4 μm; p = 0.016; df = 50).
Figure 2.

Depolarization-induced Glu release in the striatum of Tg and wt mice. Stimulus-evoked Glu release in Tg and wt mice was measured using MEAs after pressure ejection of 100–200 nl of 70 mm KCl at the times shown. Reproducible signals of Glu release were obtained from both Tg and wt mice. Conc., Concentration.
The kinetics of Glu reuptake were determined on the basis of the temporal dynamics of changes in KCl-evoked Glu release. Since neurotransmitter uptake follows Michaelis–Menten kinetics (Nicholson, 1995) and is affected by the amount of available substrate, Glu uptake was analyzed by selecting a subset of signals with maximum release values in the range of 3–13 μm. This range was chosen because peak Glu values in this range were easily obtained in both wt and Tg mice. Within this subset of signals (n = 35 signals for wt and n = 20 signals for Tg), reuptake rates of stimulus-evoked Glu release were essentially equal for Tg (1.9 ± 0.3 μm/s) and wt (1.8 ± 0.2 μm/s) mice (df = 53; p = 0.66).
Glu transport into neurons or glia in the vicinity of the MEAs was also estimated by measuring Glu clearance after local application of nanoliter volumes of 5 mm l-Glu. Pressure ejections of 5 mm l-Glu into the striatum of Tg and wt mice produced reproducible Glu responses similar to those seen with 70 mm KCl depolarization. Maximum amplitudes ranged, once again, between 3 and 13 μm for wt (n = 29 signals) and Tg (n = 13 signals) mice. Clearance of exogenously applied l-Glu did not differ significantly between Tg (2.5 ± 0.5 μm/s) and wt (2.9 ± 0.2 μm/s) mice (df = 40; p = 0.40). The estimated rates of Glu uptake of endogenously released Glu were lower than those for the uptake of exogenously introduced Glu. The differential rates of Glu uptake were probably attributable to the electrogenic nature of Glu transporters as Glu uptake is driven by electrochemical gradients across the cell membrane (Takahashi et al., 1997; Doble, 1999). Under the conditions of stimulus-evoked Glu release by the local application of 70 mm KCl, glial and neuronal membranes would be depolarized, and thus the rate of Glu uptake decreased compared with the clearance rate of exogenously applied Glu. Nevertheless, the key observation was that both endogenously released and exogenously introduced Glu had very similar rates of clearance in Tg as they did in wt mice. Therefore, the excess Glu release after KCl-induced depolarization was not likely the result of diminished Glu transport in Tg compared with wt mice.
Anesthetics, such as the urethane that was used in the present studies, exert their effects by enhancing inhibitory synaptic neurotransmission as well as by inhibiting excitatory neurotransmission (Hara and Harris, 2002). Resting Glu levels are significantly attenuated in urethane-anesthetized rats (Rutherford et al., 2007) and, although both wt and Tg mice received the same dose of urethane (final dose of 1.25 g/kg), the urethane anesthesia might have had differential effects on neuronal release of Glu in Tg compared with wt mice. For this reason, another approach was pursued to assess possible differential rates of Glu release by CNS neurons in wt versus Tg mice: recording mEPSCs in vitro from known excitatory, glutamatergic synapses in the hippocampus.
Increases in synaptic release of Glu at glutamatergic synapses of the hippocampus
If the enhanced release of Glu after neuronal depolarization described above represented synaptic Glu release, then this might be reflected in increases in the amplitude of mEPSCs or both the amplitude and frequency of mEPSCs in glutamatergic synapses. In Drosophila, elevated content of Glu in synaptic vesicles after overexpression of a vesicular Glu transporter led to increases in both amplitude and frequency of mEPSCs at glutamatergic synapses (Daniels et al., 2004). Thus, if synaptic vesicle filling is increased in Glud1 mice as a result of increased cytoplasmic levels of l-Glu, then both mEPSC frequency and amplitude might be increased in glutamatergic synapses of Glud1 mice. Patch-clamp measurements of mEPSCs in CA1 neurons of the hippocampus of Glud1 and wt mice indicated highly significant increases in both frequency and amplitude of mEPSCs in Glud1 versus wt mice (Fig. 3). A fivefold increase in mEPSC frequency (wt: 0.012 ± 0.004, n = 3; Tg: 0.059 ± 0.011, n = 4; p = 0.017) and a twofold increase in amplitude of mEPSCs (wt: 6.319 ± 0.19, n = 3; Tg: 11.776 ± 1.51, n = 4; p = 0.029) were observed, thus supporting the idea that the increases in Glu release after neuronal depolarization (Fig. 2) occurred at excitatory synapses in the CNS.
Figure 3.

Expression of mEPSCs in CA1 pyramidal neurons. Representative recordings of mEPSCs in neurons from wt (a) and Tg (b) mice are shown. The bottom trace is an expanded fragment of the recording that is indicated in the top trace. Calibration: ordinate, 10 pA; abscissa, 1 min (top trace) and 60 ms (bottom trace).
Sensitivity to anesthetic agents and neurological manifestations in Glud1 mice
Induction of anesthesia by both intravenous and volatile anesthetic agents, such as thiopental, propofol, ketamine, ketamine–xylazine, and enflurane, involves suppression of Glu release and of postsynaptic Glu receptor activation (Orser et al., 1995; Buggy et al., 2000; Rozza et al., 2000; Cheng and Kendig, 2003). It was reasoned that if the Glud1 mice produced and released excess Glu in glutamatergic synapses, then they might exhibit differential sensitivity to anesthetic agents such as ketamine or the combination of ketamine–xylazine. An assessment of anesthetic sensitivity was undertaken using male and female wt and Tg mice. Two measures were obtained, time to LORR and duration of LORR. These measures were obtained using two different doses of the combination of ketamine and xylazine, 200 and 13.3 mg/kg ketamine and xylazine, respectively, and 130 and 8.8 mg/kg. Glud1 mice exhibited significant differences from wt mice in both time to LORR (longer in Glud1 mice) (Fig. 4A) and total time before recovery of righting reflex (shorter in Glud1 mice) (Fig. 4B). These differences between Tg and wt mice were significant under both dose combinations of ketamine and xylazine. The differential sensitivity to anesthetic agents could not be ascribed to increased fatty tissue in Tg mice, which might have functioned as a depot for anesthetic agents thus altering pharmacokinetic properties in Glud1 mice, because the Tg mice used in these studies weighed a little less than wt mice (wt, 29.5 ± 0.6 g; Tg, 26.2 ± 0.6 g; p = 0.02; df = 11).
Figure 1.

Time to LORR and duration of LORR in wt and Tg mice. The mean (±SEM) time period to LORR after injection with the combination of ketamine plus xylazine (A) and the mean (±SEM) duration of LORR before recovery (B) are shown. Two different dose combinations of ketamine plus xylazine were used as shown. Statistically significant differences determined by unpaired Student's t test are shown (n = 5 wt and n = 6 Tg; *p = 0.05; **p = 0.005).
Neuronal structure in the brains of Tg mice
Initial examination of neuronal structure in the brains of Tg and wt mice was performed by staining neurons with methylene blue. Various regions of the brains from five pairs of Tg and wt mice (12–20 months of age) were examined. Sections from the hippocampus revealed some thinning of the pyramidal cell layer in the CA1 field of the hippocampus (Fig. 5A,B) and the ventral granule cell layer of the dentate gyrus (Fig. 5C,D). Counts of stained neurons revealed significant decreases in the numbers of neurons in the CA1 region of the hippocampus of Glud1 mice compared with wt mice (cells per 1100 μ2; wt: 194.7 ± 2.3, n = 4; Glud1: 167.3 ± 1.5, n = 4; p = 0.005) as well as in the granule cell layer of the dentate gyrus (cells per 6162 μ2; wt: 406.7 ± 20.3, n = 4; Glud1: 321.3 ± 16.6, n = 4; p = 0. 05). In addition, neurons in both the CA1 field and the dentate gyrus appeared shrunken and darkly stained (pyknotic). The pyknotic appearance of pyramidal neurons in CA1 and granule neurons in the dentate gyrus of Glud1 mice was similar to that observed after the injection into the hippocampus of an inhibitor of brain Glu transporters (Arias et al., 1997). The similarities in morphological changes observed in Glud1 mice and those produced by the acute injections of a Glu transporter inhibitor might be viewed as indirect evidence that enhanced expression of Glud1 altered neuronal structure in hippocampus and dentate gyrus as a result of increases in extracellular Glu levels.
Figure 5.
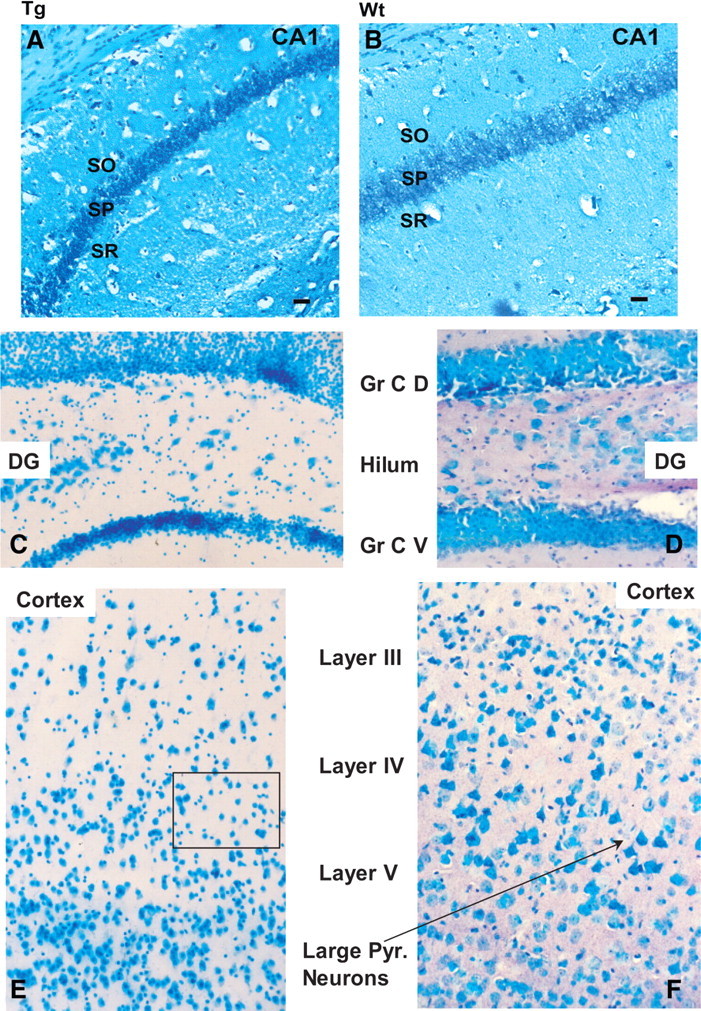
Histological sections through the hippocampus CA1 (A, B), dentate gyrus (C, D), and cerebral cortex (E, F) of 16-month-old Tg (A, C, E) and wt (B, D, F) mice. Sections were stained with methylene blue, and all images were obtained at the same magnification. Scale bars, 10 μm. Gr C D, Granule cell layer, dorsal; Gr C V, granule cell layer, ventral; DG, dentate gyrus. Large pyramidal (Pyr.) neurons in layers IV–V of cerebral cortex in wt (F, arrow) and the absence of such neurons in Glud1 (E, square) are pointed out.
Besides the neuronal changes in hippocampus, loss of large pyramidal cells was apparent in layers III–V of the primary motor/somatosensory cortex of Tg mice (Fig. 5E,F). The numbers of neurons in layers III–V were indicative of a significant decrease in the total population of stained neurons in somatosensory cortex layers III–V of Glud1 mice compared with wt mice (Fig. 6). Unlike cortical and hippocampal neurons, other large neurons, such as the Purkinje neurons of the cerebellar cortex, did not appear to be affected by the overexpression of Glud1 in the Tg mice (data not shown).
Figure 6.

Neuron cell counts in sensorimotor cortex of wt and Tg mice. Methylene blue-stained sections similar to those in Figure 5 were analyzed to estimate the total number of neurons in a set area (7225 μ2) of layers III–IV of sensorimotor cortex. Neurons were counted as the total number of neurons and as large pyramidal cells. The counts shown represent the mean (±SEM) for each cell population and were obtained from four wt and four Tg age-matched mice. Statistically significant differences (paired Student's t test) are also shown; *p = 0.05. Large Pyr. Neur., Large pyramidal neurons.
Beyond the apparent neuronal losses described above, there were marked decreases in dendrite labeling by anti-MAP2A antibodies in Glud1 mouse neurons; these decreases were most apparent in the SR of the CA1 (Fig. 7). Sections from pairs of Glud1 and wt mouse brains were processed in parallel and fluorescence microscopy using identical laser intensity and signal amplification for Tg and wt mice. The differences in pixel density between Tg and wt MAP2A labeling in the SR of CA1 (density per 3128 μm2) were significant (ANOVA; df 3, 8; F = 11.6; p = 0.003). However, unlike the differences in MAP2A labeling of CA1 neurons, those for CA3 neurons were not statistically significant (ANOVA; F = 3.4; p = 0.24). Double immune labeling of CA1 neurons with anti-MAP2A and anti-synaptophysin antibodies revealed marked decreases in labeling of nerve terminals in Glud1 mouse hippocampus by the anti-synaptophysin antibody compared with that in wt hippocampus (Fig. 7B,D,F,H) (i.e., there were concurrent decreases in nerve terminal and dendrite labeling in Tg versus wt mouse hippocampus).
Figure 7.
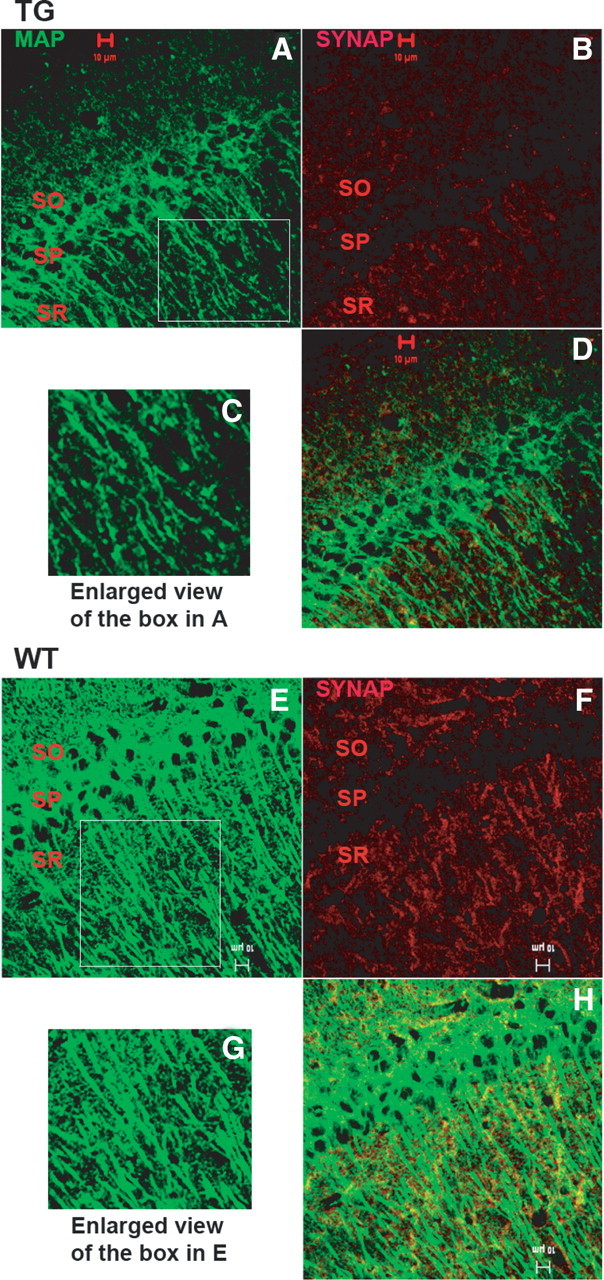
Immune labeling of MAP2A (green) and synaptophysin (red) reactive sites in CA1 of hippocampus of 12-month-old wt (A–D) and Tg (E–H) mice. C, G, Enlarged views of dendrite labeling by anti-MAP2A antibodies in the SO of CA1 pyramidal neurons. D, H, Superimposed images of MAP2A- and synaptophysin-immunoreactive sites. Scale bars, 10 μm.
The decreases in anti-MAP2A labeling in dendrites of CA1 pyramidal neurons of Glud1 mice were similar to decreases in MAP2A labeling in hippocampus observed after chemical inhibition of Glu transporters and elevations of extracellular Glu (Arias et al., 1997). Thus, the decreases in MAP2A labeling in the Glud1 mouse hippocampus might have been the result of excess release of Glu into the extracellular space of the brain. Because increases in Glu concentration and in depolarization-induced Glu release in Glud1 mice were measured in the striatum (Fig. 2), that region of the brain was also examined for possible changes in MAP2A labeling (Fig. 8). The overall labeling of MAP2A in both dendrites and cell bodies of striatal neurons of Glud1 mice was decreased, despite the fact that in this brain region the nerve terminal labeling by anti-synaptophysin antibodies showed little change from that observed in wt mice (Fig. 8). Because the microanatomical structure of the striatum is more complex than the layered structure of the hippocampus, z-plane stacked views of the striatum were obtained, and three-dimensional reconstruction was used to allow for a more clear visualization of the anti-MAP2A and anti-synaptophysin labeling to be studied (Fig. 8). Also, because of the complex architecture of the striatum, pixel density measurements over a predominantly dendritic field could not be obtained. Therefore, measurements of MAP2A pixel density were based on the overall labeling of neurons and neuronal processes in the striatum. Areas representing large corticospinal tracts through the striatum were avoided in the quantification of MAP2A pixel density (no immune staining in these tracts). The measurements obtained revealed significant decreases in MAP2A labeling in Glud1 mice (pixel density per 9930 μ2; wt, 37.7 ± 2.1; Glud1, 21.9 ± 1.6; p = 0. 005).
Figure 8.

Three-dimensional reconstruction of immune labeling of MAP2A (green) and synaptophysin (red) reactive sites in the striatum of 12-month-old Tg (A) and wt (B) mice. z-plane stacked images (0.1 μm thickness) obtained by spinning disc microscopy were used for three-dimensional reconstruction and quantification of MAP2A- and synaptophysin-immunoreactive sites. The arrow in B points to green fluorescence (Green Fluoresc.) of MAP2A in dendrites of striatal neurons. Scale bars, 10 μm.
Despite the significant loss of immune labeling in dendrites of pyramidal cells in the hippocampus of Tg mice, it was noted that the cell bodies of these neurons were generally well labeled by MAP2A antibodies (Fig. 7) (i.e., there was continued synthesis of MAP2A in neuronal cells of Glud1 mice). The pattern of MAP2A labeling observed in Glud1 mice showed some similarities to that seen after transient, excessive stimulation of NMDA receptors in brain slices ex vivo (Hoskison et al., 2007), namely decreases in labeling of dendrites and concurrent increases in labeling of neuronal cell bodies in CA1 pyramidal neurons. However, the appearance of the dendrites in the CA1 region of Glud1 mice differed from that of hippocampus slices acutely treated with a large dose of NMDA, as MAP2A labeling in Glud1 mice was less suppressed than that in slices treated for a short period of time with high concentrations of NMDA (Hoskison and Shuttleworth, 2006; Hoskison et al., 2007). Furthermore, the dendrites of CA1 neurons in Glud1 mice did not exhibit the varicosities observed in neurons treated acutely with NMDA.
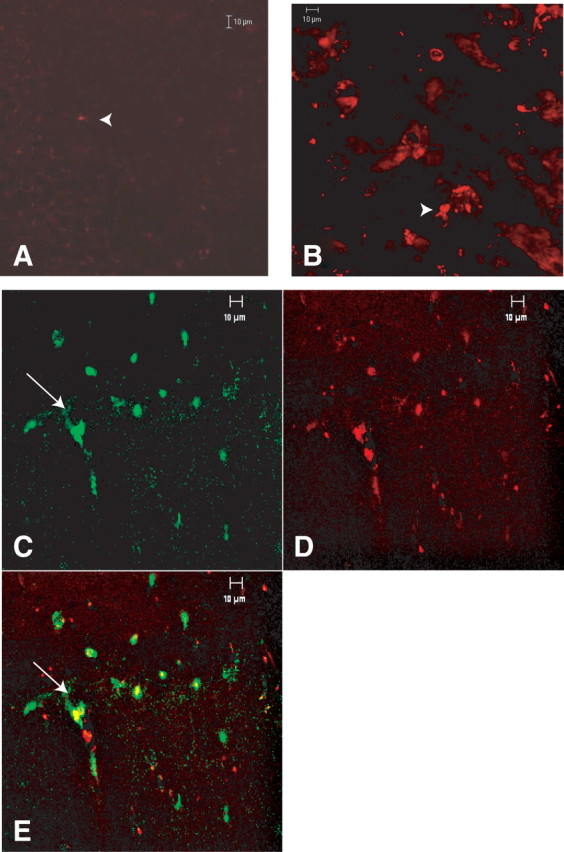
To determine the overall structure of dendrites of CA1 and cortical neurons, brain sections were double labeled by the carbocyanine dye DiI and by anti-MAP2A antibodies. Both DiI and anti-MAP2A labeling in neurons from wt mice was continuous throughout the length of primary dendrites (Fig. 9). For the Glud1 mouse CA1 region, labeling by DiI indicated that the primary dendrite shafts in Tg mice were as intact and continuous in their structure as those in wt mice (Fig. 9) (i.e., no clear indications of dendrite varicosities or disruption of structure). However, MAP2A labeling within the shafts of these dendrites showed decreased immune reactivity and a pattern of discontinuities in labeling described above. It was unlikely that the discontinuities in MAP2A labeling resulted from the handling of the tissue sections, such as differential temperatures during tissue preparation and fixation (Zhang et al., 2007), because the hippocampi from a wt and a Tg mouse brain were always processed in parallel and under identical conditions. Nevertheless, the wt hippocampus did not exhibit discontinuities in or “beading” of MAP2A labeling.
Figure 9.
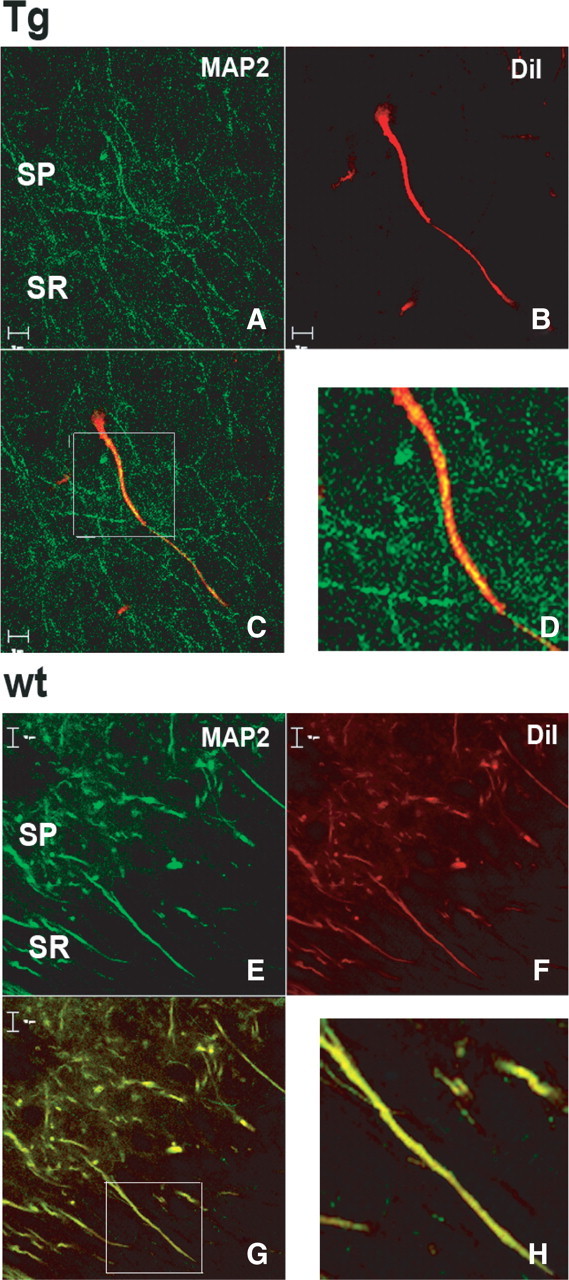
Dual labeling of pyramidal neuron dendrites in the CA1 region of hippocampus by DiI and MAP2A antibodies. Hippocampus sections from 12-month-old Tg (A–D) and wt (E–H) mice were fixed and labeled by DiI (red) and anti-MAP2A antibodies (green) as described in Materials and Methods. A, E, MAP2A-immunoreactive sites. B, F, DiI labeling of neurons. C, G, Superimposed MAP2A and DiI labeling. D, H, Enlarged images of C and G. Scale bars, 10 μm.
Effects of age on dendrite structure and neuronal numbers in brains of Tg mice
If synaptic and neuronal losses during the aging process are the result of abnormal levels or activity of Glu in brain, we wondered whether the decreases in MAP2A labeling in dendrites of Tg mice would become more pronounced with advancing age. To address this question, the loss of MAP2A labeling in dendrites was monitored across age in Tg and wt mice (Fig. 10A). MAP2A immune labeling in CA1 dendrites of wt and Tg mouse littermates (age, 6–20 months) indicated a significant decline in labeling in Tg mice across age (ANOVA; df = 1, 25; F = 5.3; p = 0.03), but not in wt mice (df = 1, 25; F = 1.63; p = 0.21). Although there was a trend toward decreased MAP2A labeling in the oldest group of wt mice (20 months), ANOVA did not reveal a significant age effect nor was the decrease in MAP2A immune labeling at 20 months significantly different from that at 11 months in wt mice (Bonferroni post hoc analysis). Comparisons between Tg and wt mice at each age (6, 11, and 20 months) revealed significant differences for each age group comparison (Bonferroni post hoc analysis, p = 0.0005). Thus, significantly lower levels of MAP2A labeling were already present in Tg mice at 6 months of age, and MAP2A levels decreased significantly with advancing age in Tg mice. It should be noted, though, that from 11 to 20 months, the rates of decrease in both wt and Tg mouse CA1 were nearly parallel, an indication that the effect of Glud1 overexpression on dendrite labeling was superimposed on a trend of an age-dependent decrease in labeling in wt mouse CA1.
Figure 10.

Age-associated changes in MAP2A labeling in dendrites and cell bodies of the CA1 of hippocampus of wt and Tg mice. A, MAP2A labeling in SR dendrites of the CA1 measured across age for wt and Glud1 mice. The data shown are means (±SEM) of pixel density measurements from equal areas (3128 μm2) from 6–14 pairs of wt and Tg mice of the indicated ages. Statistically significant differences among the various groups are presented in Results. B, Cell counts of neurons obtained from a 3128 μm2 area of SP in CA1 and CA3 of wt and Tg hippocampus. Cell bodies labeled with anti-MAP2A antibodies were counted. Statistically significant differences among the various groups are presented in Results.
The preservation of MAP2A labeling in hippocampus neuronal cell bodies of both Tg and wt mice afforded the opportunity to use images similar to those in Figure 7, to count cell numbers within equal-sized areas of CA1 and CA3. Some sections were double stained with SYTOX nuclear stain to confirm the accuracy of the cell counts. The counts were obtained from the mid-hippocampus CA1 and CA3 regions (Fig. 10B). There was a highly significant effect of Glud1 overexpression on cell numbers in CA1 (ANOVA; df = 3, 8; F = 12.1; p = 0.002). Post hoc analyses indicated significant differences between Tg and wt cell numbers in CA1 at every age tested (p = 0.001–0.028). A statistically significant effect of age on CA1 cell numbers was obtained for Tg (df = 2, 23; F = 9.1; p = 0.001) but not for wt (p = 0.057) mice. However, there was a trend toward decreased cell numbers with advancing age in wt mice, and these decreases approximated significant levels for an age effect on neuronal numbers in wt CA1. Furthermore, the nearly parallel decrease in neuronal numbers between 11- and 20-month-old wt and Tg mice might indicate again that the effect of overexpression of Glud1 in Tg mice was an added effect on a background trend of age-associated, but not yet significant, neuronal loss in wt mice.
No significant differences between Tg and wt mice were detected for neurons of the CA3 region, nor was there a significant effect of age on either wt or Tg mouse CA3 neuronal numbers (Fig. 10B). Since the levels of GLUD immunoreactivity in CA3 neurons were as high as those in CA1 (see above), these observations were suggestive of selective vulnerability of CA1 neurons in Glud1 Tg mice. Very similar results in terms of estimates of cell numbers were obtained when anti-NSE antibodies were used to label neurons in the brains of wt and Tg mice (data not shown).
Other signs of cell injury in the hippocampi of Glud1 mice
In neurons in culture, Glu-induced cell injury is associated with intracellular accumulations of ubiquitin-immunoreactive proteins (Mattson et al., 1992). Examination of the hippocampi of Tg and wt mice at 16–20 months of age revealed intense immune staining with anti-ubiquitin antibodies in the SP of Glud1 mouse CA1 but virtually no ubiquitin staining in littermate wt CA1 (Fig. 11A,B). Extensive ubiquitin immunoreactivity (large aggregates) was seen in both dentate gyrus and CA1 of 16- to 20-month-old Glud1 mice. The intermediate filament protein vimentin often encircles ubiquitin aggresomes in the perinuclear area of non-neuronal cells (Johnston et al., 1998). In 20-month-old Glud1 mice, ubiquitin aggregates in the hippocampus were colocalized with vimentin, especially in the perinuclear area of CA1 cells (Fig. 11C–E). Twenty-month-old wt mouse brain had few, dispersed, and barely detectable ubiquitin- and vimentin-immunoreactive sites in cells (data not shown). The accumulation of ubiquitin-containing bodies in hippocampal neurons appeared to be an age-associated process as neurons in the CA1 region of 9-month-old Glud1 mice had only marginally higher levels of ubiquitin labeling than the corresponding neurons of age-matched wt mice (data not shown). Also lacking in neurons of the 9-month-old Tg mice were the large ubiquitin-containing aggregates observed in CA1 neurons of Glud1 mice at 16–20 months of age.
Figure 11.
Immune labeling of ubiquitin- and vimentin-like reactive sites in cells of the CA1 region of the hippocampus. A, B, Comparative ubiquitin-like immune reactivity in a 16-month-old wt (A) and a Tg (B) mouse. An anti-ubiquitin antibody revealed large deposits of ubiquitinylated proteins in the Tg mouse hippocampus. C–E, Immune labeling of ubiquitin-like (green) and vimentin-like (red) reactive sites in CA1 cells of the hippocampus of a 20-month-old Glud1 mouse. E, Superimposed image of C and D. Arrows point to the nuclei of CA1 pyramidal cells.
Functional changes in neurons of Glud1 mice: LTP in Glud1 hippocampus
LTP is known to be diminished during aging and in animal models of neurodegenerative diseases (Barnes and McNaughton, 1985; Rosenzweig et al., 1997; Lynch et al., 2006; Wang et al., 2006; Dewachter et al., 2008). We tested the possibility that LTP in the CA1 region of the hippocampus was differentially affected by overexpression of the Glud1 gene in neurons, and that such differential activities in LTP between wt and Tg mice might appear even in young (2–3 months) animals. The slopes of fEPSPs measured at baseline were not significantly different between wt and Tg mice (wt: 0.091 ± 0.007 mV/ms, n = 7; Tg, 0.098 ± 0.002 mV/ms in Tg mice, n = 8; p £ 0.348, two-tailed unpaired Student's t test). Fast increases in the slope of fEPSPs were induced by HFS in slices from both wt and Tg animals (Fig. 12). Analysis of the normalized slopes of fEPSPs using ANOVA indicated statistically significant differences between baseline and post-HFS conditions for the wt slices (Fig. 12B). For the Tg slices, there were no statistically significant differences between baseline and post-HFS in terms of the slope of fEPSPs (Fig. 12B). Although ANOVA did not detect differences in fEPSP slopes between baseline and post-HFS in slices from Glud1 mice, analysis of the data using two-tailed paired Student's t test revealed statistically significant differences between baseline and post-HFS fEPSPs. The normalized slope of fEPSPs recorded from Tg mouse hippocampus slices was 99.6 ± 0.9% at baseline and 114.5 ± 3.9% after HFS (n = 8; p = 0.006). Overall, though, the slope of fEPSPs in the post-HFS period was consistently and significantly lower in Glud1 mice compared with that measured in wt mice (Fig. 12B).
Figure 12.
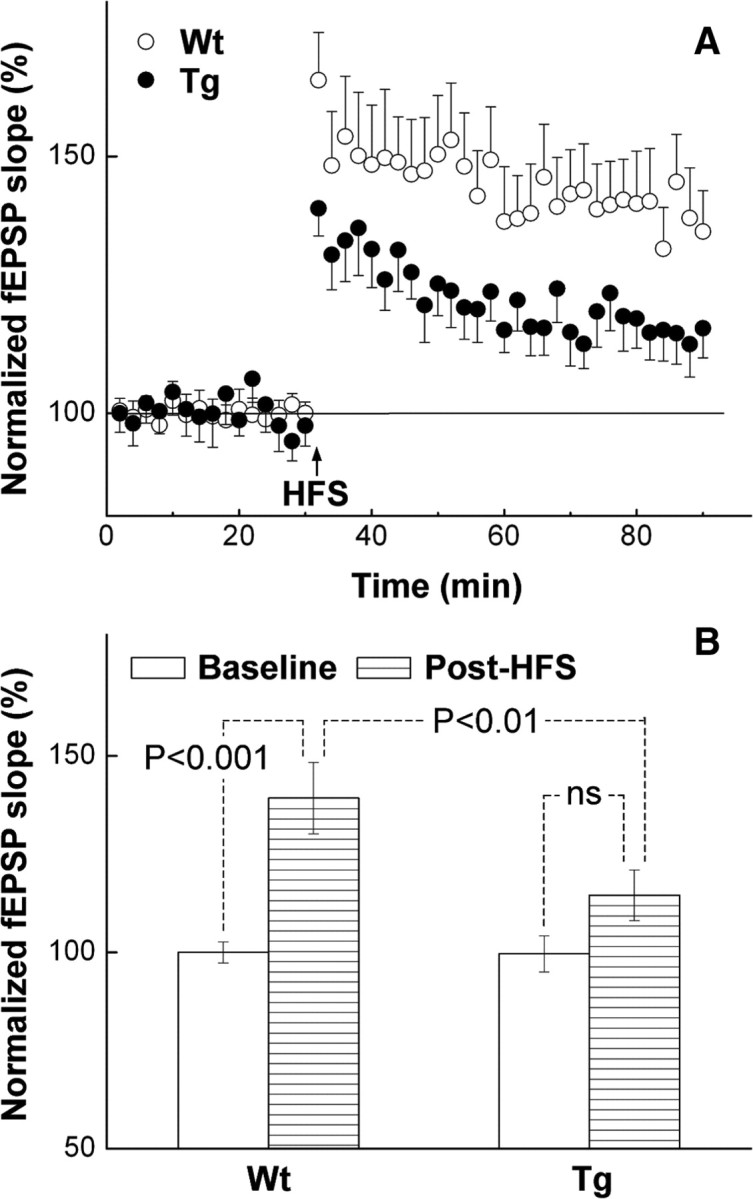
LTP in hippocampal CA1 region of wt and Tg mice. Averaged traces of normalized (relative to baseline) fEPSP slopes (A) and statistical analyses of data (B) are shown. A, HFS (0.05 ms impulse duration; 100 impulses; 100 Hz) is indicated by a vertical arrow. B, Baseline data are from 10-min-long background recordings obtained immediately before HFS, and the post-HFS data are from recordings obtained between 50 and 60 min after HFS. In both panels, data are shown as means ± SEM. The number of recordings from three pairs of mice is shown in Results. Statistical analysis in B was conducted using ANOVA with post hoc Tukey.
Alterations in spine density and morphology of hippocampal and cortical neurons
Possible causes for diminished LTP in Tg mice, even at an early age, might have been the following: (1) a “prepotentiation effect” caused by increased extracellular Glu (Coan et al., 1989; Rioult-Pedotti et al., 2000; Zeng et al., 2007); (2) decreased expression of postsynaptic Glu receptors, such as the NR2 subunits of NMDA receptors (Yashiro and Philpot, 2008); (3) cell degeneration or reduced numbers of dendritic spines caused by chronic Glu overactivity; and (4) enhanced behavioral stress (e.g., social defeat) (Kole et al., 2004). A prepotentiation effect attributable to excess extracellular Glu as a cause of diminished LTP formation in Tg mice would fit with the observation of increased Glu release from neurons in Tg mice. With regard to NR2 subunit expression, in separate studies comparing whole genome transcriptome expression in wt and Tg mice, the mRNA levels for the NR2 subunits of NMDA receptors in Tg mouse hippocampus were found to be increased above those in wt (X. Wang, X. Bao, R. Pal, and E. K. Michaelis, unpublished observations). In addition, immunoblot analyses of the P2 fractions from hippocampus, striatum, and cortex were found to have significant elevations of NR1 and NR2A protein levels in Glud1 compared with wt mice (supplemental Fig. 3, available at www.jneurosci.org as supplemental material). The increased levels of NMDA receptor subunit mRNAs and proteins in Tg compared with wt mice might reflect increases in gene expression and protein synthesis in neurons as an adaptive response to the loss of synapses brought about by excess Glu release. Excess Glu release has been shown to induce shortening or disappearance of dendrite spines (Harris, 1999). Thus, despite increased expression of NMDA receptor proteins in Tg mouse brains, there may be an overall loss of dendritic spines and synapses and of functional NMDA receptors at synapses. Such losses could have a significant effect on LTP induction.
To address the possibility of reduced spines in dendrites of Tg mice, we counted spines on dendrites in the somatosensory cortex and CA1 region of hippocampus after labeling with DiI (supplemental Fig. 4, available at www.jneurosci.org as supplemental material). Spine density per 5 μm length of dendrites was significantly reduced in both cerebral cortex and hippocampus neurons of Glud1 mice compared with those of wt mouse (Fig. 13A) (cortex, p < 0.005; hippocampus, p < 0.005; t test). The overall decrease in spine density in either hippocampus or cortex of Tg versus wt mice was of the order of 30–40%. Different morphological types of spines, such as mushroom-shaped spines, are known to be preferentially involved in the induction and establishment of LTP (Matsuzaki et al., 2004). Therefore, spines on apical and oblique dendrites of cortical (layers III–V) and hippocampal (CA1 SR) neurons were classified into five morphological categories (Tarelo-Acuna et al., 2000), and the numbers of spines under each category were determined. Because the density of the wide and ramified spines was very low in both wt and Tg mice, measurements of those spine forms were not included in the data shown (Fig. 13B,C). There was a significantly lower density of both the stubby and mushroom spines in both hippocampus and cortex of Tg compared with wt mice (stubby: hippocampus, p < 0.001; cortex, p < 0.001; mushroom: hippocampus, p = 0.009; cortex: p < 0.001; paired t test). The lower density of these two types of spines in Glud1 neurons ranged between 52 and 59% of that in wt mouse neurons (Fig. 13B,C). The density of thin spines in dendrites of hippocampus and cerebral cortex neurons from Glud1 mice was slightly lower than in dendrites from wt mice, but the differences were significant only for cortical neurons (p = 0.02, paired t test).
Figure 13.
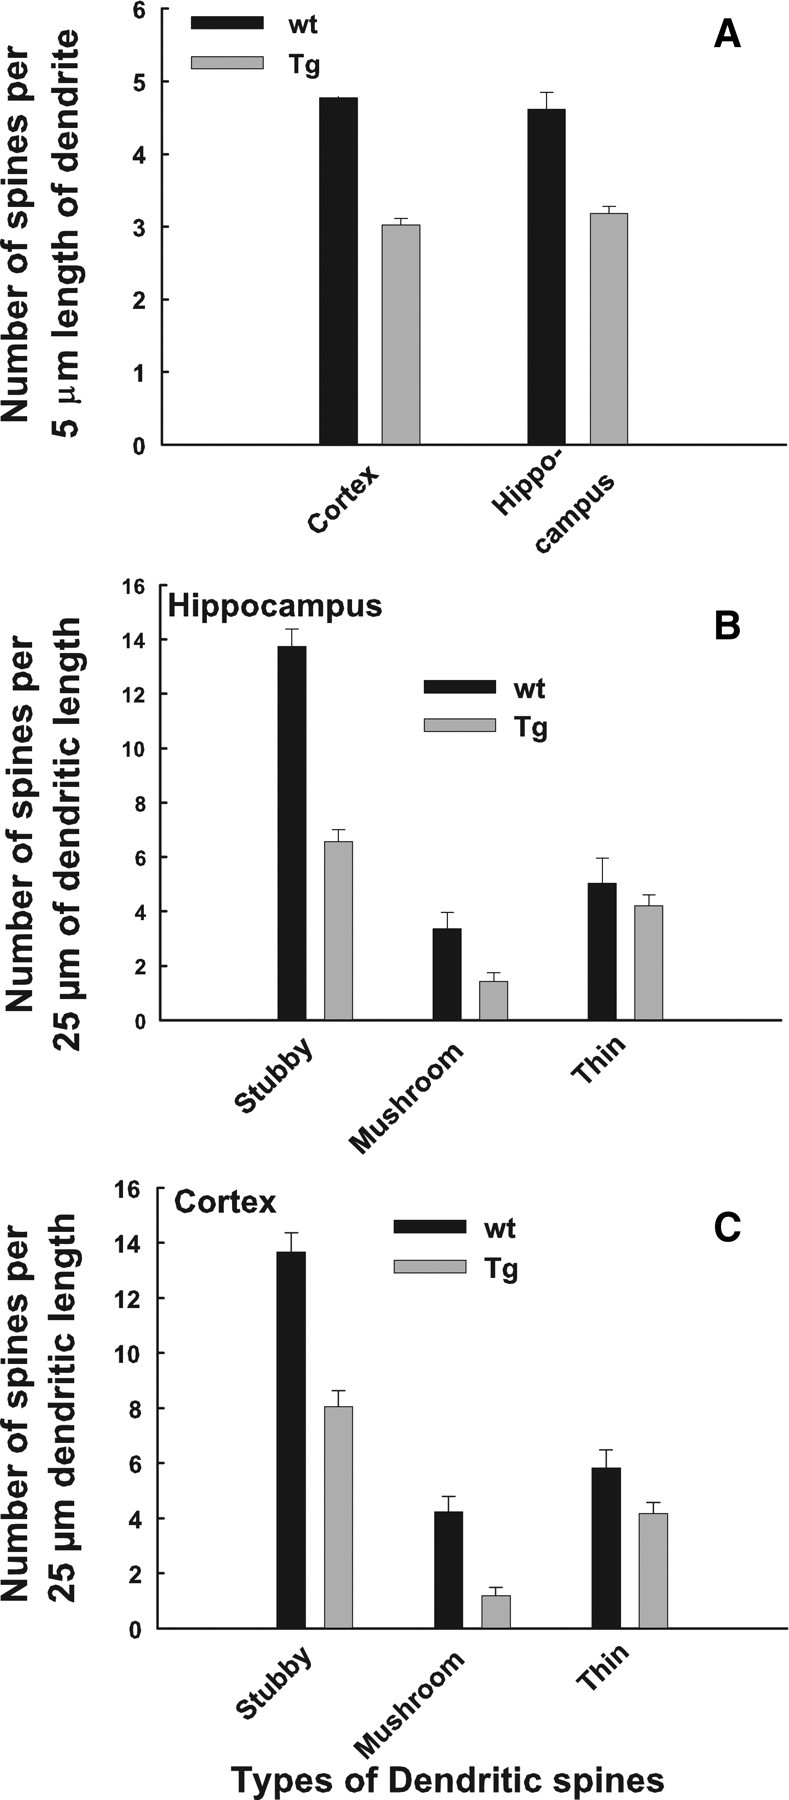
Spine density and spine morphology distribution in primary and oblique dendrites of Tg and wt mice. A, The number of spines per 5 μm length of dendrites was determined in 45–75 dendrite segments from three Tg and wt mice. The differences in spine density were statistically significant as indicated in Results. B, C, The number of stubby, mushroom, and thin spines per 25 μm dendrite length was determined from 30 such segments in hippocampal (B) and cortical (C) neurons of three Tg and wt mice. The results of statistical analyses are presented in Results.
Discussion
The overexpression of Glud1 in neurons led to enhanced protein levels and enzyme activity of neuronal GLUD throughout the brain, to increases in the levels of Glu in hippocampus and striatum, to increased Glu release into the extracellular environment after depolarization of neurons in striatum, and to increased spontaneous Glu release (mEPSCs) in synapses of the hippocampus. Fitting with the pattern of enhanced Glu levels and synaptic Glu release, the Tg mice exhibited relative resistance to anesthetic agents that suppress glutamatergic synapses. Overexpression of Glud1 and the resultant moderate excess Glu formation and release were correlated with neuronal, dendritic spine, and nerve ending losses in select regions of the brains of Tg mice, particularly the CA1 region of the hippocampus. And both the excess Glu release and the loss of dendritic spines may have contributed to the marked suppression of LTP formation in Tg mice. The selective nature of neuronal damage in Glud1 mice probably contributed to their survival into early aging, and this afforded the opportunity to examine the effects of GLUD overexpression and excess Glu formation and release on neuronal structure and neuronal losses with increasing age.
The in vivo effects of lifelong increases in depolarization-induced release of Glu on neuronal structure and function have not been characterized previously. Dendrite varicosities and altered structure, spine shrinking, and cell death result from acute exposure of CNS neurons to excess Glu or NMDA (Buddle et al., 2003; Hoskison et al., 2007). However, short exposure to either Glu or NMDA does not allow for full expression of either adaptive responses or repair processes within neurons. Rapid (2 h) recovery of dendrite integrity can occur after acute exposure to NMDA (Ikegaya et al., 2001), and dissociation of such recovery from neuronal cell death (≥24 h after exposure) has been reported (Hasbani et al., 1998). However, the complexity of the process of injury within subcellular domains after acute exposure to Glu, and of the recovery or progression toward death, makes it difficult to predict, a priori, what the effect of exposure to chronic, moderate increases in synaptic extracellular Glu might be on the structure and function of neurons.
Excess expression of GLUD was linked in the Tg mice to selective neuronal losses among pyramidal neurons of the CA1 region of the hippocampus, granule cells of the dentate gyrus, and large pyramidal neurons of the somatosensory cortex. But, despite the increased expression of Glud1 in all neurons of the CNS, only select populations suffered losses, whereas other neurons, either glutamatergic or not, such as CA3 region pyramidal cells and Purkinje cerebellar neurons, did not suffer as a result of GLUD overexpression. This finding indicates that a process other than the overexpression of Glud1 in neurons might be the determinant of neuronal injury or survival. Furthermore, selective neuronal damage in the brain of Glud1 mice and the survival of these mice to an age >21 months distinguished these mice from null mutant mice for the Glu transporter Slc1a2 or for the Tsc-1 gene.
Suppression of the activity of Glu transporters, especially glial transporters, leads to chronically elevated levels of extracellular Glu that are nearly 30-fold higher than those in wt animals (Rothstein et al., 1996). These increases represent tonic rather than transient elevations of extracellular Glu in Slc1a2 and Tsc-1 null mutant mice, and the sustained increases in extracellular Glu have been invoked as the cause of seizures, extensive neuronal degeneration in the CNS, and early demise of these mutant mice (Rothstein et al., 1996; Tanaka et al., 1997; Zeng et al., 2007).
Differential neuronal vulnerability to Glud1 overexpression was not only apparent in selective loss of neurons but also in selective changes in MAP2A labeling in dendrites. Beyond the differential rates of neuronal losses during aging in CA1 versus CA3, the CA1 neurons exhibited marked suppression of MAP2A levels and the appearance of discontinuities in MAP2A labeling, whereas MAP2A levels in dendrites of CA3 neurons in Tg mouse brains were as high as those of wt mice and without discontinuities. The selective morphological changes and neuronal losses in only CA1 neurons of Glud1 mouse hippocampus also differed from the changes in dendrite structure observed after acute exposure of neurons in organotypic cultures to NMDA. In cultures, structural changes in dendrites occur in both CA1 and CA3 neurons (Ikegaya et al., 2001).
The presence of dendrite varicosities was an important difference between the effects of acute exposure of neurons to NMDA and those observed in Glud1 mouse hippocampus. Dendrite varicosities are a consistent finding after acute NMDA treatment, glucose deprivation, or hypoxia (Park et al., 1996; Hasbani et al., 1998; Ikegaya et al., 2001; Hoskison et al., 2007). However, in the Tg mouse hippocampus, DiI labeling revealed that primary and oblique dendrite shafts exhibited a continuous structure that was similar to the structure of dendrites in neurons from wt hippocampus, and despite the discontinuities in MAP2A labeling in Tg mice, there was no evidence of varicosities.
What accounted for the suppressed MAP2A labeling in the hippocampus, striatum, and cerebral cortex of Glud1 mice is not known. MAP2A is synthesized in dendrites after transport of its mRNA into dendrites (Rehbein et al., 2000). It is possible that the changes in MAP2A immunoreactivity in dendrites of Tg mice were the result of Glu-induced suppression of local protein synthesis (Marin et al., 1997) or alterations in mRNA trafficking. MAP2A is also distributed within some dendritic spines and postsynaptic densities (Caceres et al., 1983; Langnaese et al., 1996). In postsynaptic membranes, MAP2A is associated with NMDA receptors and undergoes redistribution after excess Glu release (Buddle et al., 2003).
Significant reductions in synaptophysin labeling of presynaptic nerve terminals were also observed in the CA1 of Glud1 mice. This led us to consider the possibility of changes in synaptic density (i.e., spine density) in primary and oblique dendrites. Both hippocampus and cerebral cortex neurons exhibited significant decreases in spine density in Tg versus wt mice. The greatest decreases occurred in mushroom and stubby spines, an important change as the remodeling of mushroom spines is closely linked to LTP induction and maintenance (Matsuzaki et al., 2004).
With respect to LTP, we observed that although LTP could be induced in CA1 neurons of the hippocampus from both Glud1 and wt mice, the increases in fEPSPs were significantly suppressed in the Tg mice. Reduction of LTP in the Tg mouse hippocampus might not have been solely the result of decreases in dendrite spine density, since low-level activation of NMDA receptors by extracellular Glu preceding the induction of LTP (Coan et al., 1989), or sustained increases in extracellular Glu (Zeng et al., 2007), can lead to decreases in LTP.
The morphological changes of brain neurons in Glud1 mice described above, the increases in Glu levels and in spontaneous and depolarization-induced Glu release, and the decreases in LTP induction constitute the endophenotype of the Glud1 Tg mice. In contrast, the differential sensitivity of Glud1 mice to the anesthetic combination of ketamine–xylazine constitutes a behavioral phenotypic characteristic revealed after drug administration. In terms of other behavioral phenotypic characteristics, studies of early generations of Glud1 and wt mice revealed no significant differences between them in either locomotor behavior or in a discrimination operant training paradigm (T. McKerchar, Bao, J. Pinkston, S. Fowler, and E. K. Michaelis, unpublished observations). Behavioral studies of memory formation in Tg versus wt mice will have to be performed to determine whether the decreases in LTP formation would correlate with loss of memory formation.
The observations made with Glud1 mice lend support to the idea that not all glutamatergic neurons suffer equally during aging as shown for the age-associated neuronal losses in the CA1 versus CA3 region. The neuronal populations in human brain that seem to be most susceptible to injury with aging (Terry et al., 1987; Masliah et al., 1993; Morrison and Hof, 1997) are some of the same populations that were most likely to die in increasing numbers with advancing age in Glud1 mice. The molecular determinants of selective neuronal vulnerability to age-associated excess Glu are not known. The development of the Glud1 mice may allow for the exploration of key molecular events produced by chronic exposure of neurons to moderate, transient increases in Glu release.
Aging is also associated with substantial loss of synapses on glutamatergic neurons (Terry et al., 1987; Masliah et al., 1993). Changes in Glu activity may explain both neuronal and synaptic atrophy associated with aging and neurodegeneration (Rothstein et al., 1990; Morrison and Hof, 1997; Francis, 2003). In Glud1 mice, aging was associated with the appearance of significant decreases in MAP2A and synaptophysin levels in a vulnerable region, the CA1 field. MAP2 is important in the maintenance of the structure of dendrites and the function of signal transduction complexes in synapses (Harada et al., 2002). Loss of synapses and altered localization of MAP2A in Glud1 mouse dendrites may be linked processes that can be studied in greater detail in the future using this mouse model.
Footnotes
This work was supported by grants from the National Institute on Aging (AG12993); National Institute on Deafness and Other Communication Disorders (HD02528); National Institute on Alcohol Abuse and Alcoholism (AA11419, AA04732, AA12276); National Science Foundation (DBI-9987807, DBI-0352848); National Institute on Drug Abuse (DA017186, DA015088, Training Grant DA022738); National Institute of Neurological Disorders and Stroke (NS39787); National Institute of Mental Health (MH58414); Kansas Technology Enterprise Corporation; Miller, Hedwig, and Wilbur Fund; and University of Kansas Research Development Fund. We thank Dr. N. Moschonas for providing the mouse Glud1 cDNA and Dr. J. Sutcliffe for the pNSE-LacZ vector. The support of the Higuchi Biosciences Center is acknowledged.
References
- Aarts M, Iihara K, Wei WL, Xiong ZG, Arundine M, Cerwinski W, MacDonald JF, Tymianski M. A key role for TRPM7 channels in anoxic neuronal death. Cell. 2003;115:863–877. doi: 10.1016/s0092-8674(03)01017-1. [DOI] [PubMed] [Google Scholar]
- Agrawal HC, Davis JM, Himwich WA. Developmental changes in mouse brain: weight, water content and free amino acids. J Neurochem. 1968;15:917–923. doi: 10.1111/j.1471-4159.1968.tb11633.x. [DOI] [PubMed] [Google Scholar]
- Arias C, Arrieta I, Massieu L, Tapia R. Neuronal damage and MAP2 changes induced by the glutamate transport inhibitor dihydrokainate and by kainate in rat hippocampus in vivo. Exp Brain Res. 1997;116:467–476. doi: 10.1007/pl00005774. [DOI] [PubMed] [Google Scholar]
- Barnes CA, McNaughton BL. An age comparison of the rates of acquisition and forgetting of spatial information in relation to long-term enhancement of hippocampal synapses. Behav Neurosci. 1985;99:1040–1048. doi: 10.1037//0735-7044.99.6.1040. [DOI] [PubMed] [Google Scholar]
- Belousov AB, van den Pol AN. Local synaptic release of glutamate from neurons in the rat hypothalamic arcuate nucleus. J Physiol. 1997;499:747–761. doi: 10.1113/jphysiol.1997.sp021966. [DOI] [PMC free article] [PubMed] [Google Scholar]
- Buddle M, Eberhardt E, Ciminello LH, Levin T, Wing R, DiPasquale K, Raley-Susman KM. Microtubule-associated protein 2 (MAP2) associates with the NMDA receptor and is spatially redistributed within rat hippocampal neurons after oxygen-glucose deprivation. Brain research. 2003;978:38–50. doi: 10.1016/s0006-8993(03)02758-6. [DOI] [PubMed] [Google Scholar]
- Buggy DJ, Nicol B, Rowbotham DJ, Lambert DG. Effects of intravenous anesthetic agents on glutamate release: a role for GABAA receptor-mediated inhibition. Anesthesiology. 2000;92:1067–1073. doi: 10.1097/00000542-200004000-00025. [DOI] [PubMed] [Google Scholar]
- Burmeister JJ, Gerhardt GA. Self-referencing ceramic-based multisite microelectrodes for the detection and elimination of interferences from the measurement of L-glutamate and other analytes. Anal Chem. 2001;73:1037–1042. doi: 10.1021/ac0010429. [DOI] [PubMed] [Google Scholar]
- Burmeister JJ, Moxon K, Gerhardt GA. Ceramic-based multisite microelectrodes for electrochemical recordings. Anal Chem. 2000;72:187–192. doi: 10.1021/ac9907991. [DOI] [PubMed] [Google Scholar]
- Burmeister JJ, Pomerleau F, Palmer M, Day BK, Huettl P, Gerhardt GA. Improved ceramic-based multisite microelectrode for rapid measurements of L-glutamate in the CNS. J Neurosci Methods. 2002;119:163–171. doi: 10.1016/s0165-0270(02)00172-3. [DOI] [PubMed] [Google Scholar]
- Caceres A, Payne MR, Binder LI, Steward O. Immunocytochemical localization of actin and microtubule-associated protein MAP2 in dendritic spines. Proc Natl Acad Sci U S A. 1983;80:1738–1742. doi: 10.1073/pnas.80.6.1738. [DOI] [PMC free article] [PubMed] [Google Scholar]
- Cheng G, Kendig JJ. Enflurane decreases glutamate neurotransmission to spinal cord motor neurons by both pre- and postsynaptic actions. Anesth Analg. 2003;96:1354–1359. doi: 10.1213/01.ANE.0000055649.06649.D2. table of contents. [DOI] [PubMed] [Google Scholar]
- Choi DW. Bench to bedside: the glutamate connection. Science. 1992;258:241–243. doi: 10.1126/science.1357748. [DOI] [PubMed] [Google Scholar]
- Coan EJ, Irving AJ, Collingridge GL. Low-frequency activation of the NMDA receptor system can prevent the induction of LTP. Neurosci Lett. 1989;105:205–210. doi: 10.1016/0304-3940(89)90038-4. [DOI] [PubMed] [Google Scholar]
- Cotman CW, Monaghan DT, Ganong AH. Excitatory amino acid neurotransmission: NMDA receptors and Hebb-type synaptic plasticity. Annu Rev Neurosci. 1988;11:61–80. doi: 10.1146/annurev.ne.11.030188.000425. [DOI] [PubMed] [Google Scholar]
- Daniels RW, Collins CA, Gelfand MV, Dant J, Brooks ES, Krantz DE, DiAntonio A. Increased expression of the Drosophila vesicular glutamate transporter leads to excess glutamate release and a compensatory decrease in quantal content. J Neurosci. 2004;24:10466–10474. doi: 10.1523/JNEUROSCI.3001-04.2004. [DOI] [PMC free article] [PubMed] [Google Scholar]
- Dewachter I, Ris L, Croes S, Borghgraef P, Devijver H, Voets T, Nilius B, Godaux E, Van Leuven F. Modulation of synaptic plasticity and Tau phosphorylation by wild-type and mutant presenilin1. Neurobiol Aging. 2008;29:639–652. doi: 10.1016/j.neurobiolaging.2006.11.019. [DOI] [PubMed] [Google Scholar]
- Doble A. The role of excitotoxicity in neurodegenerative disease: implications for therapy. Pharmacol Ther. 1999;81:163–221. doi: 10.1016/s0163-7258(98)00042-4. [DOI] [PubMed] [Google Scholar]
- Erecinska M, Nelson D, Nissim I, Daikhin Y, Yudkoff M. Cerebral alanine transport and alanine aminotransferase reaction: alanine as a source of neuronal glutamate. J Neurochem. 1994;62:1953–1964. doi: 10.1046/j.1471-4159.1994.62051953.x. [DOI] [PubMed] [Google Scholar]
- Forss-Petter S, Danielson PE, Catsicas S, Battenberg E, Price J, Nerenberg M, Sutcliffe JG. Transgenic mice expressing beta-galactosidase in mature neurons under neuron-specific enolase promoter control. Neuron. 1990;5:187–197. doi: 10.1016/0896-6273(90)90308-3. [DOI] [PubMed] [Google Scholar]
- Francis PT. Glutamatergic systems in Alzheimer's disease. Int J Geriatr Psychiatry. 2003;18:S15–S21. doi: 10.1002/gps.934. [DOI] [PubMed] [Google Scholar]
- Franklin KBJ, Paxinos GT. The mouse brain in sterotaxic coordinates. San Diego: Academic; 1997. [Google Scholar]
- Friedemann MN, Gerhardt GA. Regional effects of aging on dopaminergic function in the Fischer-344 rat. Neurobiol Aging. 1992;13:325–332. doi: 10.1016/0197-4580(92)90046-z. [DOI] [PubMed] [Google Scholar]
- Gruetter R. Automatic, localized in vivo adjustment of all first- and second-order shim coils. Magn Reson Med. 1993;29:804–811. doi: 10.1002/mrm.1910290613. [DOI] [PubMed] [Google Scholar]
- Hara K, Harris RA. The anesthetic mechanism of urethane: the effects on neurotransmitter-gated ion channels. Anesth Analg. 2002;94:313–318. doi: 10.1097/00000539-200202000-00015. table of contents. [DOI] [PubMed] [Google Scholar]
- Harada A, Teng J, Takei Y, Oguchi K, Hirokawa N. MAP2 is required for dendrite elongation, PKA anchoring in dendrites, and proper PKA signal transduction. J Cell Biol. 2002;158:541–549. doi: 10.1083/jcb.200110134. [DOI] [PMC free article] [PubMed] [Google Scholar]
- Harris KM. Calcium from internal stores modifies dendritic spine shape. Proc Natl Acad Sci U S A. 1999;96:12213–12215. doi: 10.1073/pnas.96.22.12213. [DOI] [PMC free article] [PubMed] [Google Scholar]
- Hasbani MJ, Hyrc KL, Faddis BT, Romano C, Goldberg MP. Distinct roles for sodium, chloride, and calcium in excitotoxic dendritic injury and recovery. Exp Neurol. 1998;154:241–258. doi: 10.1006/exnr.1998.6929. [DOI] [PubMed] [Google Scholar]
- Hoskison MM, Shuttleworth CW. Microtubule disruption, not calpain-dependent loss of MAP2, contributes to enduring NMDA-induced dendritic dysfunction in acute hippocampal slices. Exp Neurol. 2006;202:302–312. doi: 10.1016/j.expneurol.2006.06.010. [DOI] [PubMed] [Google Scholar]
- Hoskison MM, Yanagawa Y, Obata K, Shuttleworth CW. Calcium-dependent NMDA-induced dendritic injury and MAP2 loss in acute hippocampal slices. Neuroscience. 2007;145:66–79. doi: 10.1016/j.neuroscience.2006.11.034. [DOI] [PMC free article] [PubMed] [Google Scholar]
- Ikegaya Y, Kim JA, Baba M, Iwatsubo T, Nishiyama N, Matsuki N. Rapid and reversible changes in dendrite morphology and synaptic efficacy following NMDA receptor activation: implication for a cellular defense against excitotoxicity. J Cell Sci. 2001;114:4083–4093. doi: 10.1242/jcs.114.22.4083. [DOI] [PubMed] [Google Scholar]
- Johnston JA, Ward CL, Kopito RR. Aggresomes: a cellular response to misfolded proteins. J Cell Biol. 1998;143:1883–1898. doi: 10.1083/jcb.143.7.1883. [DOI] [PMC free article] [PubMed] [Google Scholar]
- Kim BG, Dai HN, McAtee M, Vicini S, Bregman BS. Labeling of dendritic spines with the carbocyanine dye DiI for confocal microscopic imaging in lightly fixed cortical slices. J Neurosci Methods. 2007;162:237–243. doi: 10.1016/j.jneumeth.2007.01.016. [DOI] [PMC free article] [PubMed] [Google Scholar]
- Kole MH, Costoli T, Koolhaas JM, Fuchs E. Bidirectional shift in the cornu ammonis 3 pyramidal dendritic organization following brief stress. Neuroscience. 2004;125:337–347. doi: 10.1016/j.neuroscience.2004.02.014. [DOI] [PubMed] [Google Scholar]
- Komuro H, Rakic P. Modulation of neuronal migration by NMDA receptors. Science. 1993;260:95–97. doi: 10.1126/science.8096653. [DOI] [PubMed] [Google Scholar]
- Kugler P, Baier G. Mitochondrial enzymes related to glutamate and GABA metabolism in the hippocampus of young and aged rats: a quantitative histochemical study. Neurochem Res. 1992;17:179–185. doi: 10.1007/BF00966797. [DOI] [PubMed] [Google Scholar]
- Langnaese K, Seidenbecher C, Wex H, Seidel B, Hartung K, Appeltauer U, Garner A, Voss B, Mueller B, Garner CC, Gundelfinger ED. Protein components of a rat brain synaptic junctional protein preparation. Brain Res Mol Brain Res. 1996;42:118–122. doi: 10.1016/s0169-328x(96)00147-7. [DOI] [PubMed] [Google Scholar]
- Levi G, Kandera J, Lajtha A. Control of cerebral metabolite levels. I. Amino acid uptake and levels in various species. Arch Biochem Biophys. 1967;119:303–311. doi: 10.1016/0003-9861(67)90460-2. [DOI] [PubMed] [Google Scholar]
- Lynch G, Rex CS, Gall CM. Synaptic plasticity in early aging. Ageing Res Rev. 2006;5:255–280. doi: 10.1016/j.arr.2006.03.008. [DOI] [PubMed] [Google Scholar]
- Marin P, Nastiuk KL, Daniel N, Girault JA, Czernik AJ, Glowinski J, Nairn AC, Premont J. Glutamate-dependent phosphorylation of elongation factor-2 and inhibition of protein synthesis in neurons. J Neurosci. 1997;17:3445–3454. doi: 10.1523/JNEUROSCI.17-10-03445.1997. [DOI] [PMC free article] [PubMed] [Google Scholar]
- Masliah E, Mallory M, Hansen L, DeTeresa R, Terry RD. Quantitative synaptic alterations in the human neocortex during normal aging. Neurology. 1993;43:192–197. doi: 10.1212/wnl.43.1_part_1.192. [DOI] [PubMed] [Google Scholar]
- Matsubayashi Y, Iwai L, Kawasaki H. Fluorescent double-labeling with carbocyanine neuronal tracing and immunohistochemistry using a cholesterol-specific detergent digitonin. J Neurosci Methods. 2008;174:71–81. doi: 10.1016/j.jneumeth.2008.07.003. [DOI] [PubMed] [Google Scholar]
- Matsuzaki M, Honkura N, Ellis-Davies GC, Kasai H. Structural basis of long-term potentiation in single dendritic spines. Nature. 2004;429:761–766. doi: 10.1038/nature02617. [DOI] [PMC free article] [PubMed] [Google Scholar]
- Mattson MP, Cheng B, Davis D, Bryant K, Lieberburg I, Rydel RE. β-Amyloid peptides destabilize calcium homeostasis and render human cortical neurons vulnerable to excitotoxicity. J Neurosci. 1992;12:376–389. doi: 10.1523/JNEUROSCI.12-02-00376.1992. [DOI] [PMC free article] [PubMed] [Google Scholar]
- Mazon MJ. Effect of glucose starvation on the nicotinamide adenine dinucleotide phosphate-dependent glutamate dehydrogenase of yeast. J Bacteriol. 1978;133:780–785. doi: 10.1128/jb.133.2.780-785.1978. [DOI] [PMC free article] [PubMed] [Google Scholar]
- Michaelis EK, Michaelis ML, Chang HH, Kitos TE. High affinity Ca2+-stimulated Mg2+-dependent ATPase in rat brain synaptosomes, synaptic membranes, and microsomes. J Biol Chem. 1983;258:6101–6108. [PubMed] [Google Scholar]
- Mlynarik V, Gambarota G, Frenkel H, Gruetter R. Localized short-echo-time proton MR spectroscopy with full signal-intensity acquisition. Magn Reson Med. 2006;56:965–970. doi: 10.1002/mrm.21043. [DOI] [PubMed] [Google Scholar]
- Morrison JH, Hof PR. Life and death of neurons in the aging brain. Science. 1997;278:412–419. doi: 10.1126/science.278.5337.412. [DOI] [PubMed] [Google Scholar]
- Nicholson C. Interaction between diffusion and Michaelis-Menten uptake of dopamine after iontophoresis in striatum. Biophys J. 1995;68:1699–1715. doi: 10.1016/S0006-3495(95)80348-6. [DOI] [PMC free article] [PubMed] [Google Scholar]
- Orser BA, Bertlik M, Wang LY, MacDonald JF. Inhibition by propofol (2,6 di-isopropylphenol) of the N-methyl-D-aspartate subtype of glutamate receptor in cultured hippocampal neurones. Br J Pharmacol. 1995;116:1761–1768. doi: 10.1111/j.1476-5381.1995.tb16660.x. [DOI] [PMC free article] [PubMed] [Google Scholar]
- Pal R, Agbas A, Bao X, Hui D, Leary C, Hunt J, Naniwadekar A, Michaelis ML, Kumar KN, Michaelis EK. Selective dendrite-targeting of mRNAs of NR1 splice variants without exon 5: identification of a cis-acting sequence and isolation of sequence-binding proteins. Brain Res. 2003;994:1–18. doi: 10.1016/j.brainres.2003.08.046. [DOI] [PubMed] [Google Scholar]
- Palaiologos G, Hertz L, Schousboe A. Evidence that aspartate aminotransferase activity and ketodicarboxylate carrier function are essential for biosynthesis of transmitter glutamate. J Neurochem. 1988;51:317–320. doi: 10.1111/j.1471-4159.1988.tb04872.x. [DOI] [PubMed] [Google Scholar]
- Park JS, Bateman MC, Goldberg MP. Rapid alterations in dendrite morphology during sublethal hypoxia or glutamate receptor activation. Neurobiol Dis. 1996;3:215–227. doi: 10.1006/nbdi.1996.0022. [DOI] [PubMed] [Google Scholar]
- Peel AL, Zolotukhin S, Schrimsher GW, Muzyczka N, Reier PJ. Efficient transduction of green fluorescent protein in spinal cord neurons using adeno-associated virus vectors containing cell type-specific promoters. Gene Ther. 1997;4:16–24. doi: 10.1038/sj.gt.3300358. [DOI] [PubMed] [Google Scholar]
- Peng LA, Schousboe A, Hertz L. Utilization of alpha-ketoglutarate as a precursor for transmitter glutamate in cultured cerebellar granule cells. Neurochem Res. 1991;16:29–34. doi: 10.1007/BF00965824. [DOI] [PubMed] [Google Scholar]
- Plaitakis A, Metaxari M, Shashidharan P. Nerve tissue-specific (GLUD2) and housekeeping (GLUD1) human glutamate dehydrogenases are regulated by distinct allosteric mechanisms: implications for biologic function. J Neurochem. 2000;75:1862–1869. doi: 10.1046/j.1471-4159.2000.0751862.x. [DOI] [PubMed] [Google Scholar]
- Provencher SW. Estimation of metabolite concentrations from localized in vivo proton NMR spectra. Magn Reson Med. 1993;30:672–679. doi: 10.1002/mrm.1910300604. [DOI] [PubMed] [Google Scholar]
- Rehbein M, Kindler S, Horke S, Richter D. Two trans-acting rat-brain proteins, MARTA1 and MARTA2, interact specifically with the dendritic targeting element in MAP2 mRNAs. Mol Brain Res. 2000;79:192–201. doi: 10.1016/s0169-328x(00)00114-5. [DOI] [PubMed] [Google Scholar]
- Rioult-Pedotti MS, Friedman D, Donoghue JP. Learning-induced LTP in neocortex. Science. 2000;290:533–536. doi: 10.1126/science.290.5491.533. [DOI] [PubMed] [Google Scholar]
- Rosenzweig ES, Rao G, McNaughton BL, Barnes CA. Role of temporal summation in age-related long-term potentiation-induction deficits. Hippocampus. 1997;7:549–558. doi: 10.1002/(SICI)1098-1063(1997)7:5<549::AID-HIPO10>3.0.CO;2-0. [DOI] [PubMed] [Google Scholar]
- Rothstein JD, Tsai G, Kuncl RW, Clawson L, Cornblath DR, Drachman DB, Pestronk A, Stauch BL, Coyle JT. Abnormal excitatory amino acid metabolism in amyotrophic lateral sclerosis. Ann Neurol. 1990;28:18–25. doi: 10.1002/ana.410280106. [DOI] [PubMed] [Google Scholar]
- Rothstein JD, Dykes-Hoberg M, Pardo CA, Bristol LA, Jin L, Kuncl RW, Kanai Y, Hediger MA, Wang Y, Schielke JP, Welty DF. Knockout of glutamate transporters reveals a major role for astroglial transport in excitotoxicity and clearance of glutamate. Neuron. 1996;16:675–686. doi: 10.1016/s0896-6273(00)80086-0. [DOI] [PubMed] [Google Scholar]
- Rozza A, Masoero E, Favalli L, Lanza E, Govoni S, Rizzo V, Montalbetti L. Influence of different anaesthetics on extracellular amino acids in rat brain. J Neurosci Methods. 2000;101:165–169. doi: 10.1016/s0165-0270(00)00266-1. [DOI] [PubMed] [Google Scholar]
- Rutherford EC, Pomerleau F, Huettl P, Stromberg I, Gerhardt GA. Chronic second-by-second measures of L-glutamate in the central nervous system of freely moving rats. J Neurochem. 2007;102:712–722. doi: 10.1111/j.1471-4159.2007.04596.x. [DOI] [PMC free article] [PubMed] [Google Scholar]
- Schwarcz R, Meldrum B. Excitatory amino acid antagonists provide a therapeutic approach to neurological disorders. Lancet. 1985;2:140–143. doi: 10.1016/s0140-6736(85)90238-7. [DOI] [PubMed] [Google Scholar]
- Shashidharan P, Michaelidis TM, Robakis NK, Kresovali A, Papamatheakis J, Plaitakis A. Novel human glutamate dehydrogenase expressed in neural and testicular tissues and encoded by an X-linked intronless gene. J Biol Chem. 1994;269:16971–16976. [PubMed] [Google Scholar]
- Takahashi M, Billups B, Rossi D, Sarantis M, Hamann M, Attwell D. The role of glutamate transporters in glutamate homeostasis in the brain. J Exp Biol. 1997;200:401–409. doi: 10.1242/jeb.200.2.401. [DOI] [PubMed] [Google Scholar]
- Tanaka K, Watase K, Manabe T, Yamada K, Watanabe M, Takahashi K, Iwama H, Nishikawa T, Ichihara N, Kikuchi T, Okuyama S, Kawashima N, Hori S, Takimoto M, Wada K. Epilepsy and exacerbation of brain injury in mice lacking the glutamate transporter GLT-1. Science. 1997;276:1699–1702. doi: 10.1126/science.276.5319.1699. [DOI] [PubMed] [Google Scholar]
- Tarelo-Acuna L, Olvera-Cortes E, Gonzalez-Burgos I. Prenatal and postnatal exposure to ethanol induces changes in the shape of the dendritic spines from hippocampal CA1 pyramidal neurons of the rat. Neurosci Lett. 2000;286:13–16. doi: 10.1016/s0304-3940(00)01075-2. [DOI] [PubMed] [Google Scholar]
- Terry RD, DeTeresa R, Hansen LA. Neocortical cell counts in normal human adult aging. Ann Neurol. 1987;21:530–539. doi: 10.1002/ana.410210603. [DOI] [PubMed] [Google Scholar]
- Thomas TC, Grandy DK, Gerhardt GA, Glaser PEA. Decreased dopamine D4 receptor expression increases extracellular glutamate and alters its regulation in mouse striatum. Neuropsychopharmacology. 2009;34:436–445. doi: 10.1038/npp.2008.74. [DOI] [PMC free article] [PubMed] [Google Scholar]
- Tzimagiorgis G, Moschonas NK. Molecular cloning, structure and expression analysis of a full-length mouse brain glutamate dehydrogenase cDNA. Biochim Biophys Acta. 1991;1089:250–253. doi: 10.1016/0167-4781(91)90017-g. [DOI] [PubMed] [Google Scholar]
- Wang Y, Wang L, Wu J, Cai J. The in vivo synaptic plasticity mechanism of EGb 761-induced enhancement of spatial learning and memory in aged rats. Br J Pharmacol. 2006;148:147–153. doi: 10.1038/sj.bjp.0706720. [DOI] [PMC free article] [PubMed] [Google Scholar]
- Wharton CW, Szawelski RJ. Half-time analysis of the integrated Michaelis equation. Simulation and use of the half-time plot and its direct linear variant in the analysis of some alpha-chymotrypsin, papain- and fumarase-catalysed reactions. Biochem J. 1982;203:351–360. doi: 10.1042/bj2030351. [DOI] [PMC free article] [PubMed] [Google Scholar]
- Yashiro K, Philpot BD. Regulation of NMDA receptor subunit expression and its implications for LTD, LTP, and metaplasticity. Neuropharmacology. 2008;55:1081–1094. doi: 10.1016/j.neuropharm.2008.07.046. [DOI] [PMC free article] [PubMed] [Google Scholar]
- Yudkoff M, Zaleska MM, Nissim I, Nelson D, Erecinska M. Neuronal glutamine utilization: pathways of nitrogen transfer studied with [15N]glutamine. J Neurochem. 1989;53:632–640. doi: 10.1111/j.1471-4159.1989.tb07380.x. [DOI] [PubMed] [Google Scholar]
- Yudkoff M, Nissim I, Nelson D, Lin ZP, Erecinska M. Glutamate dehydrogenase reaction as a source of glutamic acid in synaptosomes. J Neurochem. 1991;57:153–160. doi: 10.1111/j.1471-4159.1991.tb02110.x. [DOI] [PubMed] [Google Scholar]
- Zaidi A, Gao J, Squier TC, Michaelis ML. Age-related decrease in brain synaptic membrane Ca2+-ATPase in F344/BNF1 rats. Neurobiol Aging. 1998;19:487–495. doi: 10.1016/s0197-4580(98)00078-5. [DOI] [PubMed] [Google Scholar]
- Zeng LH, Ouyang Y, Gazit V, Cirrito JR, Jansen LA, Ess KC, Yamada KA, Wozniak DF, Holtzman DM, Gutmann DH, Wong M. Abnormal glutamate homeostasis and impaired synaptic plasticity and learning in a mouse model of tuberous sclerosis complex. Neurobiol Dis. 2007;28:184–196. doi: 10.1016/j.nbd.2007.07.015. [DOI] [PMC free article] [PubMed] [Google Scholar]
- Zhang SX, Holmberg EG, Geddes JW. Artifactual dendritic beading in rat spinal cord induced by perfusion with cold saline and paraformaldehyde. J Neurosci Methods. 2007;163:38–43. doi: 10.1016/j.jneumeth.2007.02.013. [DOI] [PubMed] [Google Scholar]
- Zhang X, Vincent AS, Halliwell B, Wong KP. A mechanism of sulfite neurotoxicity: direct inhibition of glutamate dehydrogenase. J Biol Chem. 2004;279:43035–43045. doi: 10.1074/jbc.M402759200. [DOI] [PubMed] [Google Scholar]