

Abstract
Context
The term temperament refers to a biologically based predilection for a distinctive pattern of emotions, cognitions, and behaviours first observed in infancy or early childhood. High reactive infants are characterized at 4 months by vigorous motor activity and crying in response to unfamiliar visual, auditory, and olfactory stimuli, whereas low reactive infants show low motor activity and low vocal distress to the same stimuli. High reactive infants are biased to become behaviorally inhibited in the second year of life, defined by timidity with unfamiliar people, objects and situations. In contrast, low reactive infants are biased to develop into uninhibited children who spontaneously approach novel situations.
Objective
To examine whether differences in the structure of ventromedial or orbitofrontal cerebral cortex at age 18 years are associated with high or low reactivity at 4 months of age.
Design
Structural MRI in a cohort of 18-year olds enrolled in a longitudinal study. Temperament was determined at 4 months of age by direct observation in the laboratory.
Setting
Athinoula A. Martinos Center for Biomedical Imaging, Massachusetts General Hospital
Participants
76 subjects who were high reactive or low reactive infants at 4 months of age.
Main Outcome Measures
Cortical thickness
Results
Adults with a low reactive infant temperament, compared with those categorized as high reactive, showed greater thickness in left orbitofrontal cortex. Subjects categorized as high reactive in infancy, compared with those previously categorized as low reactive, showed greater thickness in right ventromedial prefrontal cortex. This is the first demonstration that temperamental differences measured at 4 months of age have implications for the architecture of human cerebral cortex lasting into adulthood. Understanding the developmental mechanisms that shape these differences may offer new ways to understand mood and anxiety disorders as well as the formation of adult personality.
Temperament refers to a biologically based predilection for a distinctive pattern of emotions, cognitions, and behaviors first observed in infancy or early childhood. Approximately 20% of Caucasian four-month old infants demonstrate a high reactive (HR) temperament, which is defined by vigorous limb activity, arching of their back and crying to unfamiliar visual, olfactory, and auditory stimuli. In contrast, 40% of 4-month olds show both low motor activity and low vocal distress to the same stimuli, and are categorized as low reactive (LR)1–3. These profiles were based on direct observations in the laboratory. As the two groups mature they become toddlers who show distinctive responses to unfamiliar people, objects, and situations. High reactive infants are biased to be timid with unfamiliar people, objects and situations that are unfamiliar. In contrast, low reactive infants are biased to develop into uninhibited children who spontaneously approach unfamiliar situations1–4. This result is consistent with an account that emphasizes variation in the excitability of the amygdala and its projections to the ventral striatum, the periaqueductal gray (PAG), and anterior cingulate3, 5.
Longitudinal studies of inhibited and uninhibited children from age 2 to age 7 revealed that these two temperamental types showed distinctive physiological differences in heart rate and heart rate variability, pupillary dilation during cognitive tasks, and vocal cord tension when speaking under moderate stress4, 6. These physiological differences between the two temperamental groups were consistent with expected differences in activity in circuits that project from the amygdala to the sympathetic chain and suggest that the complex behavioral and physiological profiles of these two temperaments might reflect differential excitability of the amygdala.
The two infant temperaments are associated with distinct psychological features in adolescents. Fifteen year-olds who had been high reactive infants showed subdued social behavior, right frontal EEG activation, greater sympathetic over parasympathetic tone, and a shallower habituation of the event-related potential at 400 msec to discrepant visual events. Adolescents who had been low reactive infants showed spontaneous social behavior, left frontal activation, vagal dominance, and a steeper habituation of the event-related potential to discrepant visual events7. In addition, more high than low reactives reported serious worry over encounters with unfamiliar situations and more frequent melancholic moods7. More low than high reactive adolescents reported worrying only over realistic events, such as school grades and athletic peformance, and reported happier moods. Independent prospective studies from several laboratories have demonstrated that an inhibited temperament is a risk factor for the development of anxiety disorder in childhood8, 9 and adolescence10, particularly social anxiety disorder10, 11. Social anxiety disorder during adolescence in turn is an important predictor of subsequent depressive disorders12 and social phobia in young adults13.
A previous fMRI study from our laboratory supported the the hypothesis that the differences in physiology and behavior between inhibited and uninhibited temperaments might indeed reflect differential amygdalar reactivity to novelty14. There is rich bi-directional connectivity between the ventral prefrontal cortex and the amygdala15, 16. Ventral prefrontal cortex, including the orbitofrontal cortex (OFC) plays a pivotal role in emotional regulation, reward processing, and an ability to inhibit behaviors17–31. We therefore wondered if differences in the thickness of ventral prefrontal cortex in adults would differentiate high from low reactive infants. Using high resolution structural MRI, we tested this hypothesis in 76 subjects who were enrolled in an 18-year longitudinal study and had been characterized3, 7, 32 as high (n=34) or low (n=42) reactive infants at four months of age (see Table 1). Handedness, measured with the Edinburgh Inventory33, did not differ between the two temperament groups. Twenty-two of the high reactive infants in this sample were also categorized as highly fearful (i.e. inhibited) children in the second year of life, whereas just five children were classified as low fear (uninhibited). Similarly, twenty-six of the low reactive infants were also categorized as low fear in the second year, whereas just three were classified as highly fearful.
Table 1.
Demographics of the study population
| High Reactive | Low Reactive | Total | ||
|---|---|---|---|---|
| N | 34 | 42 | 76 | |
| Gender | ||||
| Male | 15 | 27 | 42 | |
| Female | 19 | 15 | 34 | |
| Age (yrs) | 18.25 ± 0.46 | 18.30 ± 0.49 | 18.28 ± 0.48 | |
| Handedness | 64.7 ± 9.5 | 61.6 ± 8.6 | 63.0 ± 6.3 | |
METHODS
Infant Assessment and Categorization
The details of the standard 45 minute battery are described elsewhere in detail3, 5. Initially, the mother looked down at her infant smiling, but not talking, for one minute. The parent then went to a chair behind the infant to be outside the child’s field of vision. The examiner then placed a speaker baffle to the right of the infant and turned on a tape recording that played 8 short sentences read by female voices. The speaker baffle was removed and the examiner, standing in back of the infant, presented a set of mobiles composed of one, three or seven colorful toys that moved back and forth in front of the infant's face for 9 twenty-second trials. The examiner then dipped a cotton swab into very dilute butyl alcohol and presented it close to the infant’s nostrils for 8 trials (the first and last trials were water rather than alcohol). The speaker baffle was replaced and the infant heard a female voice speaking three nonsense syllables (ma, pa, ga) at three different loudness levels. The examiner then popped a balloon in back of the infant; most were unperturbed by this event. Finally, the mother returned to gaze at her infant for the final minute. The decision to define discrete groups based on the combination of motor activity and crying, rather than a continuum of reactivity was supported by a taxonomic analysis of the four month data that implied that the combination of the two variables fit a categorical model better than a continuous one32, 34.
Neuroimaging
Each subject underwent two 3D MPRAGE structural scans on a 3T Siemens TrioTim scanner (128 sagital slices; 1.3×1.3×1 mm; TR=2530 ms; TE = 3.39 ms; flip angle 7°, bandwidth 190 Hz/Px). The two 3D MPRAGE structural scans from each subject were averaged, after motion correction, to create a single high signal-to-noise average volume. This volume was analyzed using Freesurfer (www.nmr.mgh.harvard.edu/martinos) both to create anatomical surface models and perform statistical analyses. The details of these methods have been reported elsewhere35–46. The average volume for each subject was used to create a finite-element surface mesh model of the cortical surface, both at the gray-white junction and pial surface35, 36. The gray-white boundry and pial surfaces of each subject were carefully examined and edited to ensure fidelity to each individual’s anatomy. Each element in this model is called a “vertex”. For each subject, thickness measures across the cortex were computed by finding the point on the gray-white boundary surface that was closest to a given point on the estimated pial surface (and vice versa) and averaging between these two values37. The accuracy of the thickness measures derived from this technique has been validated by direct comparisons with manual measures on post-mortem brains47.
To map each subject to a common space, the surface representing the gray-white border was registered to an average cortical surface atlas using a non-linear procedure that optimally aligned sulcal and gyral features across subjects36. Cortical parcellations were drawn on the anatomical atlas48; parcellations were mapped back onto each individual subject's surface by applying the subject-atlas registration described above36, 41. For the vertex-by-vertex cluster analysis, the thickness maps for all subjects in both groups were converted to the common atlas space36, 41. The data were smoothed on the surface using an iterative nearest-neighbor averaging procedure (74 iterations were applied, equivalent to applying a 2-dimensional gaussian smoothing kernel along the cortical surface with a full-width half-maximum of approximately 10 mm). A general linear model was used to test for cortical thickness differences between the two temperament groups, the two genders, and for any interaction between these two factors at each vertex. To correct for multiple comparisons, spatial clusters of thickness differences were defined as contingous patches of vertices with p-values less than 0.05 (two-tailed). The p-values for these clusters were determined by Monte Carlo simulation (10,000 iterations). Only clusters that survived this correction with p-values less than 0.05 (two-tailed) were deemed significant. For p=.05, the cluster size threshold in the combined search area of ventral prefrontal cortex (consisting of frontal pole, ventromedial and ventrolateral prefrontal cortex including the OFC, and the pars orbitalis) was 168 mm2. We also performed a vertex-wise whole-brain analysis to examine whether there were any additional areas of thickness differences between the two temperament groups that survived correction for multiple comparisons at the whole brain level. In addition, posterior visual cortex (cuneus, pericalcarine, and lingual gyrus) was selected a priori as a comparison region that we predicted would not show a significant difference in cortical thickness between groups. Finally, we examined whether whether there were spatially diffuse thickness differences between the two temperamental groups in ventral prefrontal cortex in addition to the confluent clusters of thickness differences. The mean thickness of ventral prefrontal cortex (frontal pole, ventromedial and ventrolateral prefrontal cortex including the OFC, and the pars orbitalis), but clipping out the territory of the clusters in figure 1 was computed for each individual. This computed thickness was the dependent variable in a general linear model, with temperament type (2 levels) and gender as a between-subject factor. To exclude a difference in the goodness-of-fit to the common atlas space as a potential source of bias in the comparison of the two temperament groups, we compared the curvature index in the two groups, since this index is used as the basis of surface registration; no difference was found. The spherical coordinate space in which each subject’s cortex is registered to the atlas after inflation in Freesurfer is particularly well suited to handling variability in sulcal and gyral anatomy amongst individuals. This has been cited as advantage of Freesurfer compared with other approaches to MRI image analysis49. Results were visualized on a group brain generated by the actual subjects in the study rather than an average atlas brain, thereby reflecting more accurately any distinctive anatomical variation. This enabled more accurate description of the spatial location of clusters with respect to gyral and sulcal features. Data analysts were blind during image processing to subjects identity and temperamental type in infancy.
Figure 1. Left Orbitofrontal Cortical Thickness Difference Map.
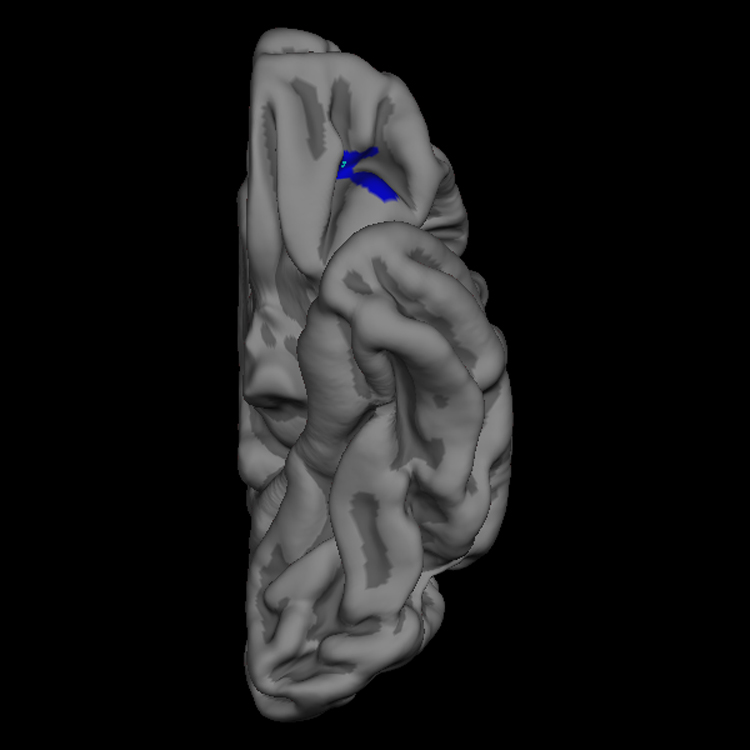
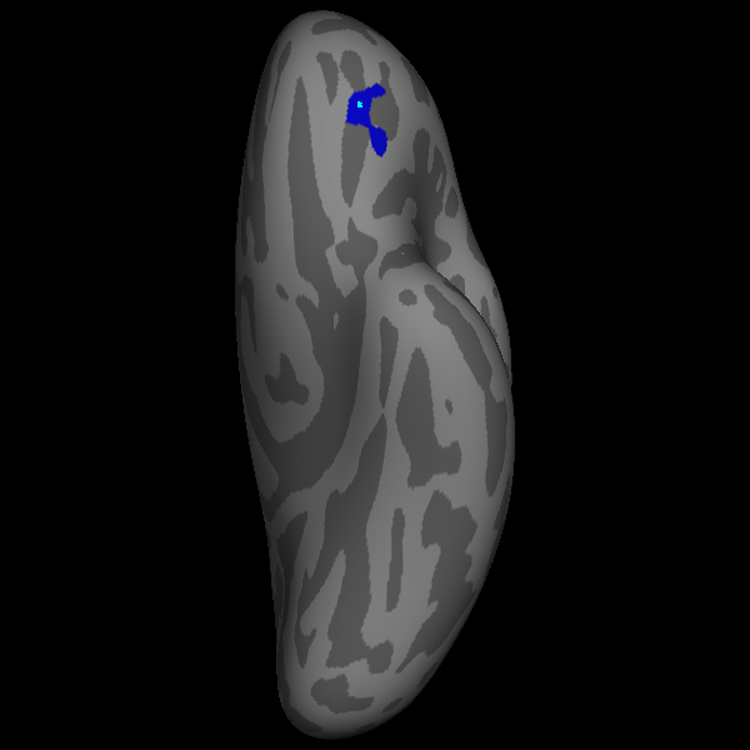
The blue label indicates the 225 mm2 region of left orbitofrontal cortex that is thicker in low reactives than high reactives, with clusterwise p value = 0.01 (two-tailed) corrected for multiple comparisons. The pial view (a) depicts the three dimensional gyral and sulcal anatomy, whereas the inflated view (b) allows visualization of the complete cortical surface that lies in sulci as well as gyri. The maximal thickness difference between the two groups defined by infant temperament occurs at the vertex with Talairach coordinates (−24, 35, −10), and is indicated with a light blue point. This vertex can be seen in the wall of the transverse orbital sulcus in the non-inflated (pial) view in (a), but is easier to appreciate in the inflated image of the orbitofrontal surface in (b).
RESULTS
Subjects with a low reactive temperament at 4 months had a thicker cortex in a region of left orbitofrontal cortex compared with those with a high reactive temperament, whereas high reactives had thicker cortex than low reactives in a region of right ventromedial prefrontal cortex (See Fig 1 and 2). There was no difference in cortical thickness between the genders, nor any interaction between temperament and gender in either of these regions.
Figure 2. Right Ventromedial Prefrontal Cortical Thickness Difference Map.
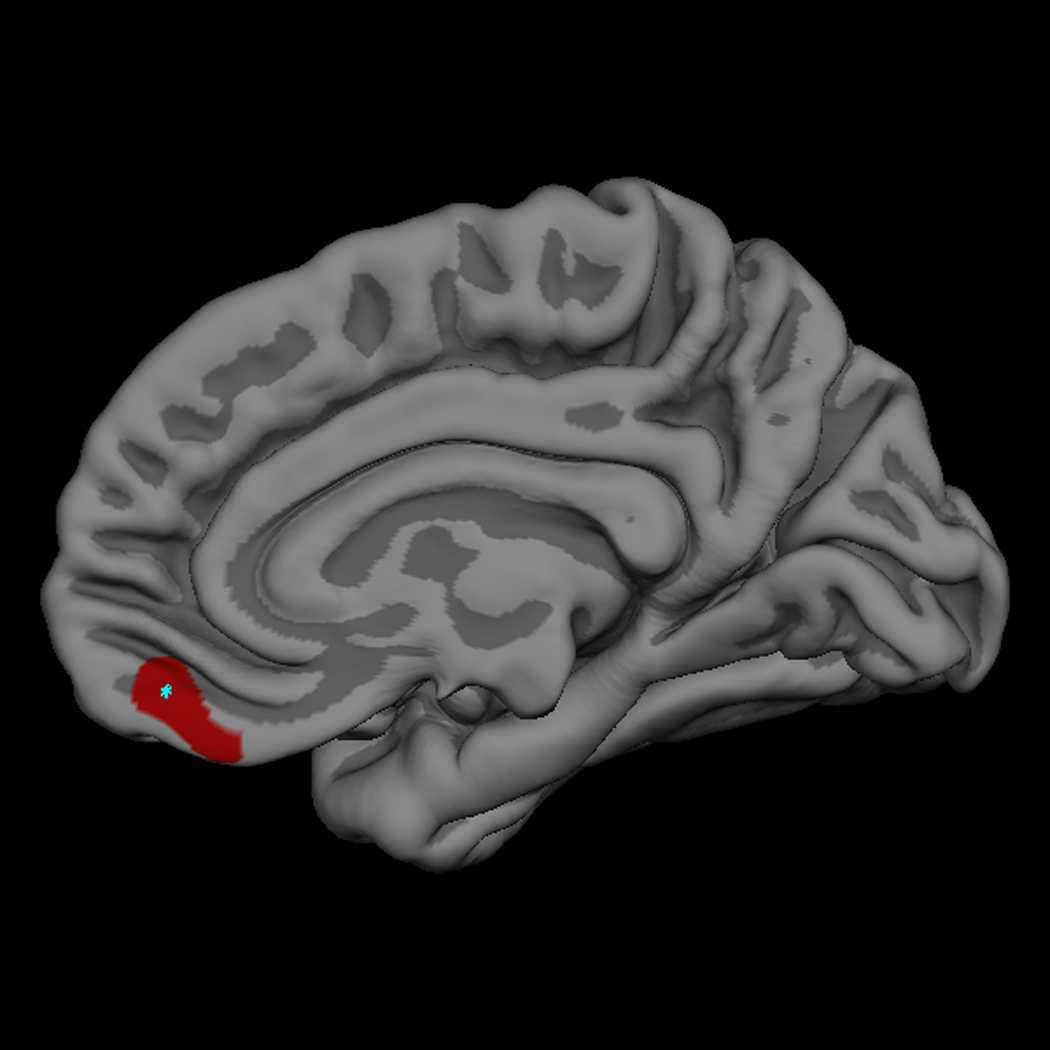
The red label indicates the 169 mm2 region of right ventromedial prefrontal cortex that is thicker in high reactives than low reactives, with clusterwise p value = 0.05 (two-tailed) corrected for multiple comparisons. The maximal thickness diffference between the two groups in the right hemisphere occurs at the vertex with Talairach coordinate (6, 46, −16), and is indicated with a light blue point in the medial view of the right hemisphere.
Figure 1 illustrates the 225 mm2 region of left OFC that was thicker in the 18 year olds who had a low reactive temperament, compared with those who were high reactive infants. The point of maximal thickness difference between the two temperamental groups, marked with a bright blue spot, lies in the transverse orbital sulcus. The cluster extends into the anterior-lateral portion of the posterior orbital gyrus, the most extreme lateral aspect of the medial orbital gyrus, the most extreme medial aspect of the lateral orbital gyrus and pars orbitalis, and the most posterior aspect of the anterior orbital gyrus. This cluster bridges several anatomical regions as defined by surface gyral and sulcal anatomy. Figure 2 illustrates the 169 mm2 region of right ventromedial prefrontal cortex (VmPfc) that was thicker in the 18 year olds who had a high reactive temperament in infancy, compared with those subjects who were low reactive infants. This cluster is located on the medial wall of the gyrus rectus of the VmPfc. The cluster extends diagonally across the medial wall of the rectus gyrus angled upwards from its most inferior/posterior territory to the most superior aspect of the cluster which is more anterior. The most superior aspect extends to include cortex lying within the superior rostral sulcus, which defines the most superior extent of the rectus gyrus on the medial wall.
Table 3 shows the range of Talairach coordinates that occur in the regions illustrated in Figure 1 and Figure 2, and the Talairach coordinates of the vertex at which the thickness difference between the temperament groups is greatest.
Table 3.
Range and Maxima of Talairach Coordinates of regional cortical thickness differences between temperaments
| Right Ventromedial PFC (High Reactive thicker than Low Reactive) |
Left Orbitofrontal Cortex (Low Reactive thicker than High Reactive) |
||||
|---|---|---|---|---|---|
| X-axis med → lat |
Y-axis post → ant |
Z-axis inf → sup |
X-axis med→ lateral |
Y-axis post → ant |
Z-axis inf → sup |
| 4 → 11 | 33 → 52 | −23 → −10 | −20 → −37 | 25 → 40 | −16 → −8 |
| 6 | 46 | −16 | −24 | 35 | −10 |
The two major contemporary maps of the human OFC are by Petrides and colleagues50, 51, and by Price and Ongur52, 53. In the Petrides’ map, the location of the left orbitofrontal cluster would correspond primarily to area 13, bounded by a transitional zone between 13 and 47/12 laterally, areas 13 and 11 anteriorally, and the junction of 13 and 14 medially. In the more fine-grained schema of Price and Ongur, the cluster would correspond to cortex in areas 47/12m, 13l, and 11l and is bounded by the transitions between 47/12m and 47/12l laterally, 47/12m and 11l anteriorally, and the junction of 13m and 13l medially.
The right ventromedial cluster, which is thicker in the high reactives, lies on the medial wall of the cerebral hemisphere and would correspond in the Petrides map to limbic cortex within areas 14 in the inferior/posterior part of the cluster and area 32 in the superior/anterior part of the cluster. In Price and Ongur’s map, the most posterior aspect of the cluster would correspond to area 14r; the cluster extends into the most posterior aspect of area 11m and the most inferior/anterior corner of area 10m, before reaching area 10r at the its most superior and anterior aspect.
Vertex-wise analyses did not reveal any additional clusters of thickness differences between the two temperament groups that survived correction for multiple comparisons at the whole brain level. In addition to this whole brain approach, as we had predicted, the posterior comparison region of visual cortex (cuneus, pericalcarine, and lingual gyrus) did not show significant difference in cortical thickness between groups [Left: Low Reactive (LR) (Mean ± SEM) 1.81 ± .015 vs. High Reactive (HR) 1.81± .017, t(74) = 0.05, p= .96; Right: LR 1.87 ± .017 vs. HR 1.86± .016, t(74) = 0.37, p= .71].
Because the cluster method detects thickness differences at adjacent vertices, we wondered if there was any evidence of additional scattered thickness differences related to temperament in ventral prefrontal cortex. Analysis of the residual territory in ventral prefrontal cortex that remained after clipping out the territories of the clusters in Figure 1 & Figure 2 showed no evidence of such diffuse thickness differences between the groups [Left: Low Reactive (LR) (Mean ± SEM) 2.58 ± .020 vs. High Reactive (HR) 2.56± .021, t(74) = 0.83, p= .41; Right: LR 2.51 ± .023 vs. HR 2.50± .024, t(74) = 0.45, p= .66].
Because social anxiety disorder in adolescence has been linked to an inhibited temperament, we asked whether our results might be due to a confounding with the use of medication, social anxiety disorder, or major depressive disorder. The results indicated that the thickness differences between the temperament groups were not associated with any of these factors (Table 4).
Table 4.
Mean +/−SEM cortical thickness by temperament in subjects without Social anxiety disorder, MDD and history of medication use
| Right Ventromedial PFC (mm) | Left Orbitofrontal Cortex (mm) | |||||
|---|---|---|---|---|---|---|
| High Reactive | Low Reactive | ES | High Reactive | Low Reactive | ES | |
| Total Sample: | 2.35 ± 0.05 | 2.09 ± 0.05 | .61 | 2.31 ± 0.06 | 2.54 ± 0.04 | .54 |
| Without Social Anxiety: |
2.33 ± 0.06 | 2.10 ± 0.05 | .52 | 2.25 ± 0.06 | 2.55 ± 0.05 | .74 |
| Without MDD: | 2.39 ± 0.06 | 2.09 ± 0.05 | .73 | 2.23 ± 0.07 | 2.54 ± 0.04 | .78 |
| Without Medication Use: |
2.38 ± 0.05 | 2.09 ± 0.05 | .68 | 2.31 ± 0.05 | 2.54 ± 0.04 | .61 |
ES = Effect Size, Cohen’s d
COMMENT
These data suggest that regional differences in the thickness of adult orbitofrontal and ventromedial prefrontal cerebral cortex are predicted by temperamental differences observed at 4 months of age. To our knowledge, there are no previous reports of a relation between infant temperament and brain structure in either infancy or adulthood. As summarized above, these temperamental differences have functional consequences lasting into adolescence.
Left Orbitofrontal Cortex
We suggest that low reactives are able to modulate their hedonic tone in a more positive direction more effectively than high reactives because of more robust pathways in this sub-region of the orbitofrontal cortex that suppress unpleasant feelings. Functional neuroimaging studies support a central role for this sub-region of the left OFC in hedonic processing54, 55 and the reappraisal of negative emotion in a more positive direction56. The posterior-lateral limb of the cluster may relate to a distinct pattern of heavy projections from the OFC to small inhibitory neurons, the intercalated cell masses of the amygdala57–59. These cells, interposed between the input to the basal complex and the output from the central nucleus, gate neuronal traffic and modulate output from the central nucleus of the amygdala that produces bodily sensations that individuals interpret as signs of anxiety60. A previous fMRI study suggested amygdala hyper-reactivity to novelty in inhibited compared to uninhibited children14; low reactives would therefore be expected to be more effective at inhibiting the amygdalar response to unfamiliarity than high reactives through this circuit.
Patients with MDD show abnormal reward processing61–63 with altered brain activation in a region of left OFC64 that overlaps substantially with the temperament-related cluster. Histopathological studies have identified thinning of 12–15% in rostral and central OFC65; sections of the later region included the area where we detected the effects of temperament66. A thicker cortex in these regions could facilitate the development of low reactive infants into prototypical uninhibited children who adapt easily to change, demonstrate few fears, and have a generally happy mood in adolescence. In contrast, a thin cortex in this region might identify infants at increased risk for depression later in life.
Right Ventromedial Prefrontal Cortex
We suggest that the thicker sub-region of right ventromedial cortex in high reactives reflects robust connectivity with structures that mediate prototypical characteristics of high reactive infants. For example, this sub-region preferentially targets the lateral and dorsolateral columns of the periaqueductal gray (PAG) -- which are linked to defensive and somatovisceral responses67–71. The lateral column of the PAG generates active avoidance and defensive behaviours including a response we called arching of the back, a response seen almost exclusively in 4-month old high reactive infants. Direct projections to the hypothalamus from this sub-region of VmPfc can also activate the medulla and sympathetic chain72, resulting in the increases in blood pressure and heart rate seen in inhibited children in response to the unfamiliar.
Furthermore, this region is reciprocally connected with the posterior parahippocampal gyrus73, 74 and receives a unilateral projection from the hippocampus15, 73, 75, and hence may play an important role in detecting whether a person, place or object is novel or familiar. A study of face perception showed greater activation of right medial orbital frontal cortex, bilateral amydgala, and right inferior parietal cortex when subjects viewed images of unfamilar individuals, compared with viewing images of themselves76. In that study, the maximum fMRI activation in the right medial orbital frontal cortex occurred at precisely the same Talairach coordinates where we detected the largest temperament-related thickness difference. The flailing arms and legs characteristic of high reactive infants in response to unexpected stimuli are consistent with projections to the ventral striatum15, 77, 78, which has a central role in the execution of limb movements. The striatum is activated by aversive, novel, unexpected or intense stimuli79. Finally, the frequent distress vocalizations of high reactive infants are mediated by direct projections from the medial prefrontal network to the PAG and anterior cingulate.
These structural differences in the cerebral cortex of adults that correlate with infant temperament are present even when we excluded subjects with major depression or social phobia (Table 4). These findings therefore point to an early temperamental marker of vulnerability (or conversely resilience) to depressive and anxiety disorders. These anatomical features may represent novel endophenotypes for genetic analysis.
Several limitations merit comment. The thickness differences in orbitofrontal and ventromedial cortex in these data are on the order of about 10%–12%. Using similar techniques, regional thickness differences in cerebral cortex of about 10% have been found in subjects with autism (including OFC)80 and 3%–8% in patients with schizophrenia81. The variations in thickness of the cortex we report could be potentially related to variation in the size or density of neurons, inhibitory interneurons, glial cells, or in the size and density of unmyelinated neuronal processes (dendrites, dendritic spines and axons) referred to as neuropil. The current state of high resolution MRI cannot address which of these components contribute to the cortical thickness differences observed. Furthermore, because imaging data were not collected in infancy, these findings cannot address the question of whether the structural differences we report are primary and could be detected earlier, or whether they develop over time due to genetic factors, environmental influences, or some interaction of the two. Understanding these developmental mechanisms could offer new avenues for the understanding of mood and anxiety disorders.
Table 2.
Mean +/−SEM cortical thickness by temperament
| Right Ventromedial PFC (mm) | Left Orbitofrontal Cortex (mm) | |||||
|---|---|---|---|---|---|---|
| High Reactive | Low Reactive | ES | High Reactive | Low Reactive | ES | |
| Total: | 2.35 ± 0.05 | 2.09 ± 0.05 | .61 | 2.31 ± 0.06 | 2.54 ± 0.04 | .54 |
| Males: | 2.35 ± 0.07 | 2.09 ± 0.06 | .63 | 2.25 ± 0.07 | 2.52 ± 0.05 | .75 |
| Females: | 2.36 ± 0.07 | 2.10 ± 0.09 | .55 | 2.36 ± 0.08 | 2.57 ± 0.08 | .44 |
ES = Effect Size, Cohen’s d
ACKNOWLEDGEMENTS
The authors thank the families and children who have stayed with the study over 18 years. With appreciation to Doreen Arcus for participating in the classification of the 4-month old infants, to Dost Ongur for helpful discussions, and to Grazyna Rajkowska for her correlation of our findings with the original slides and sections from her studies. This study was supported by the National Institutes of Mental Health 5R01MH071467 (CES), the National Center for Research Resources 5P41 RR14075-07 (Center for Functional Neuroimaging Technologies) and 5M01RR001066-27 (GCRC), the Mental Illness and Neuroscience Discovery Institute, and the Athinoula A. Martinos Center for Biomedical Imaging.
Footnotes
Portions of this work were presented at the Symposium on Biological Complexity: Genes, Circuits, and Behavior, sponsored by the Salk Institute, Nature and Fondation IPSEN January 10, 2008, La Jolla, California; and at the 47th Annual Meeting of the ACNP, December 7, 2008.
There are no conflicts of interest or financial disclosures to make in regard to this manuscript.
REFERENCES
- 1.Calkins SD, Fox NA, Marshall TR. Behavioral and physiological antecedents of ainhibited and uninhibited behavior. Child Dev. 1996 Apr;67(2):523–540. [PubMed] [Google Scholar]
- 2.Kagan J, Snidman N, Arcus D. Childhood derivatives of high and low reactivity in infancy. Child Dev. 1998 Dec;69(6):1483–1493. [PubMed] [Google Scholar]
- 3.Kagan J. Galen's Prophecy. New York: Basic Books; 1994. [Google Scholar]
- 4.Kagan J, Reznick JS, Snidman N. Biological bases of childhood shyness. Science. 1988 Apr 8;240(4849):167–171. doi: 10.1126/science.3353713. [DOI] [PubMed] [Google Scholar]
- 5.Kagan J, Snidman N, McManis M, Woodward S. Temperamental contributions to the affect family of anxiety. Psychiatr Clin North Am. 2001 Dec;24(4):677–688. doi: 10.1016/s0193-953x(05)70257-4. [DOI] [PubMed] [Google Scholar]
- 6.Kagan J, Reznick JS, Snidman N. The physiology and psychology of behavioral inhibition in children. Child Dev. 1987 Dec;58(6):1459–1473. [PubMed] [Google Scholar]
- 7.Kagan J, Snidman N, Kahn V, Towsley S. The preservation of two infant temperaments into adolescence. Monogr Soc Res Child Dev. 2007;72(2):1–75. doi: 10.1111/j.1540-5834.2007.00436.x. vii; discussion 76–91. [DOI] [PubMed] [Google Scholar]
- 8.Biederman J, Rosenbaum JF, Hirshfeld DR, et al. Psychiatric correlates of behavioral inhibition in young children of parents with and without psychiatric disorders. Arch Gen Psychiatry. 1990 Jan;47(1):21–26. doi: 10.1001/archpsyc.1990.01810130023004. [DOI] [PubMed] [Google Scholar]
- 9.Hirshfeld DR, Rosenbaum JF, Biederman J, et al. Stable behavioral inhibition and its association with anxiety disorder. J Am Acad Child Adolesc Psychiatry. 1992 Jan;31(1):103–111. doi: 10.1097/00004583-199201000-00016. [DOI] [PubMed] [Google Scholar]
- 10.Schwartz CE, Snidman N, Kagan J. Adolescent social anxiety as an outcome of inhibited temperament in childhood. J Am Acad Child Adolesc Psychiatry. 1999 Aug;38(8):1008–1015. doi: 10.1097/00004583-199908000-00017. [DOI] [PubMed] [Google Scholar]
- 11.Biederman J, Hirshfeld-Becker DR, Rosenbaum JF, et al. Further evidence of association between behavioral inhibition and social anxiety in children. Am J Psychiatry. 2001 Oct;158(10):1673–1679. doi: 10.1176/appi.ajp.158.10.1673. [DOI] [PubMed] [Google Scholar]
- 12.Stein MB, Fuetsch M, Muller N, Hofler M, Lieb R, Wittchen HU. Social anxiety disorder and the risk of depression: a prospective community study of adolescents and young adults. Arch Gen Psychiatry. 2001 Mar;58(3):251–256. doi: 10.1001/archpsyc.58.3.251. [DOI] [PubMed] [Google Scholar]
- 13.Pine DS, Cohen P, Gurley D, Brook J, Ma Y. The risk for early-adulthood anxiety and depressive disorders in adolescents with anxiety and depressive disorders. Arch Gen Psychiatry. 1998 Jan;55(1):56–64. doi: 10.1001/archpsyc.55.1.56. [DOI] [PubMed] [Google Scholar]
- 14.Schwartz CE, Wright CI, Shin LM, Kagan J, Rauch SL. Inhibited and uninhibited infants "grown up": adult amygdalar response to novelty. Science. 2003 Jun 20;300(5627):1952–1953. doi: 10.1126/science.1083703. [DOI] [PubMed] [Google Scholar]
- 15.Price JL. Connections of orbital cortex. In: Zald DH, Rauch SL, editors. The Orbitofrontal Cortex. New York: Oxford University Press; 2006. pp. 39–55. [Google Scholar]
- 16.Price JL. Definition of the Orbital Cortex in Relation to Specific Connections with Limbic and Visceral Structures and Other Cortical Regions. Annals of the New York Academy of Sciences. 2007;1121(1):54–71. doi: 10.1196/annals.1401.008. [DOI] [PubMed] [Google Scholar]
- 17.Feinstein JS, Goldin PR, Stein MB, Brown GG, Paulus MP. Habituation of attentional networks during emotion processing. Neuroreport. 2002 Jul 19;13(10):1255–1258. doi: 10.1097/00001756-200207190-00007. [DOI] [PubMed] [Google Scholar]
- 18.Rolls ET, Critchley HD, Mason R, Wakeman EA. Orbitofrontal cortex neurons: role in olfactory and visual association learning. J Neurophysiol. 1996 May 1;75(5):1970–1981. doi: 10.1152/jn.1996.75.5.1970. 1996. [DOI] [PubMed] [Google Scholar]
- 19.Wright CI, Fischer H, Whalen PJ, McInerney SC, Shin LM, Rauch SL. Differential prefrontal cortex and amygdala habituation to repeatedly presented emotional stimuli. Neuroreport. 2001 Feb 12;12(2):379–383. doi: 10.1097/00001756-200102120-00039. [DOI] [PubMed] [Google Scholar]
- 20.Beauregard M, Levesque J, Bourgouin P. Neural correlates of conscious self-regulation of emotion. J Neurosci. 2001 Sep 15;21(18):RC165. doi: 10.1523/JNEUROSCI.21-18-j0001.2001. [DOI] [PMC free article] [PubMed] [Google Scholar]
- 21.Hariri AR, Bookheimer SY, Mazziotta JC. Modulating emotional responses: effects of a neocortical network on the limbic system. Neuroreport. 2000 Jan 17;11(1):43–48. doi: 10.1097/00001756-200001170-00009. [DOI] [PubMed] [Google Scholar]
- 22.Morris JS, Dolan RJ. Dissociable amygdala and orbitofrontal responses during reversal fear conditioning. Neuroimage. 2004;22(1):372–380. doi: 10.1016/j.neuroimage.2004.01.012. [DOI] [PubMed] [Google Scholar]
- 23.Johnstone T, van Reekum CM, Urry HL, Kalin NH, Davidson RJ. Failure to regulate: counterproductive recruitment of top-down prefrontal-subcortical circuitry in major depression. J Neurosci. 2007 Aug 15;27(33):8877–8884. doi: 10.1523/JNEUROSCI.2063-07.2007. [DOI] [PMC free article] [PubMed] [Google Scholar]
- 24.Morgan MA, LeDoux JE. Differential contribution of dorsal and ventral medial prefrontal cortex to the acquisition and extinction of conditioned fear in rats. Behav Neurosci. 1995 Aug;109(4):681–688. doi: 10.1037//0735-7044.109.4.681. [DOI] [PubMed] [Google Scholar]
- 25.Kringelbach ML, Rolls ET. Neural correlates of rapid reversal learning in a simple model of human social interaction. Neuroimage. 2003 Oct;20(2):1371–1383. doi: 10.1016/S1053-8119(03)00393-8. [DOI] [PubMed] [Google Scholar]
- 26.Eippert F, Veit R, Weiskopf N, Erb M, Birbaumer N, Anders S. Regulation of emotional responses elicited by threat-related stimuli. Hum Brain Mapp. 2007 May;28(5):409–423. doi: 10.1002/hbm.20291. [DOI] [PMC free article] [PubMed] [Google Scholar]
- 27.Urry HL, van Reekum CM, Johnstone T, et al. Amygdala and ventromedial prefrontal cortex are inversely coupled during regulation of negative affect and predict the diurnal pattern of cortisol secretion among older adults. J Neurosci. 2006 Apr 19;26(16):4415–4425. doi: 10.1523/JNEUROSCI.3215-05.2006. [DOI] [PMC free article] [PubMed] [Google Scholar]
- 28.Breiter HC, Aharon I, Kahneman D, Dale A, Shizgal P. Functional imaging of neural responses to expectancy and experience of monetary gains and losses. Neuron. 2001 May;30(2):619–639. doi: 10.1016/s0896-6273(01)00303-8. [DOI] [PubMed] [Google Scholar]
- 29.Petrides M. The Orbitofrontal Cortex: Novelty, Deviation from Expectation, and Memory. Annals of the New York Academy of Sciences. 2007;1121(1):33–53. doi: 10.1196/annals.1401.035. [DOI] [PubMed] [Google Scholar]
- 30.Phan KL, Fitzgerald DA, Nathan PJ, Moore GJ, Uhde TW, Tancer ME. Neural substrates for voluntary suppression of negative affect: a functional magnetic resonance imaging study. Biol Psychiatry. 2005 Feb 1;57(3):210–219. doi: 10.1016/j.biopsych.2004.10.030. [DOI] [PubMed] [Google Scholar]
- 31.Nitschke JB, Sarinopoulos I, Mackiewicz KL, Schaefer HS, Davidson RJ. Functional neuroanatomy of aversion and its anticipation. Neuroimage. 2006 Jan 1;29(1):106–116. doi: 10.1016/j.neuroimage.2005.06.068. [DOI] [PubMed] [Google Scholar]
- 32.Kagan J, Snidman N. The Long Shadow of Temperament. Cambridge, MA: Belknap Press; 2004. [Google Scholar]
- 33.Oldfield RC. The assessment and analysis of handedness: the Edinburgh inventory. Neuropsychologia. 1971 Mar;9(1):97–113. doi: 10.1016/0028-3932(71)90067-4. [DOI] [PubMed] [Google Scholar]
- 34.Woodward SA, Lenzenweger MF, Kagan J, Snidman N, Arcus D. Taxonic structure of infant reactivity: evidence from a taxometric perspective. Psychol Sci. 2000 Jul;11(4):296–301. doi: 10.1111/1467-9280.00259. [DOI] [PubMed] [Google Scholar]
- 35.Dale AM, Fischl B, Sereno MI. Cortical surface-based analysis. I. Segmentation and surface reconstruction. Neuroimage. 1999 Feb;9(2):179–194. doi: 10.1006/nimg.1998.0395. [DOI] [PubMed] [Google Scholar]
- 36.Fischl B, Sereno MI, Dale AM. Cortical surface-based analysis. II: Inflation, flattening, and a surface-based coordinate system. Neuroimage. 1999 Feb;9(2):195–207. doi: 10.1006/nimg.1998.0396. [DOI] [PubMed] [Google Scholar]
- 37.Fischl B, Dale AM. Measuring the thickness of the human cerebral cortex from magnetic resonance images. Proc Natl Acad Sci U S A. 2000 Sep 26;97(20):11050–11055. doi: 10.1073/pnas.200033797. [DOI] [PMC free article] [PubMed] [Google Scholar]
- 38.Fischl B, Salat DH, Busa E, et al. Whole brain segmentation: automated labeling of neuroanatomical structures in the human brain. Neuron. 2002 Jan 31;33(3):341–355. doi: 10.1016/s0896-6273(02)00569-x. [DOI] [PubMed] [Google Scholar]
- 39.Fischl B, van der Kouwe A, Destrieux C, et al. Automatically parcellating the human cerebral cortex. Cereb Cortex. 2004 Jan;14(1):11–22. doi: 10.1093/cercor/bhg087. [DOI] [PubMed] [Google Scholar]
- 40.Desikan RS, Segonne F, Fischl B, et al. An automated labeling system for subdividing the human cerebral cortex on MRI scans into gyral based regions of interest. Neuroimage. 2006 Jul 1;31(3):968–980. doi: 10.1016/j.neuroimage.2006.01.021. [DOI] [PubMed] [Google Scholar]
- 41.Fischl B, Sereno MI, Tootell RB, Dale AM. High-resolution intersubject averaging and a coordinate system for the cortical surface. Hum Brain Mapp. 1999;8(4):272–284. doi: 10.1002/(SICI)1097-0193(1999)8:4<272::AID-HBM10>3.0.CO;2-4. [DOI] [PMC free article] [PubMed] [Google Scholar]
- 42.Segonne F, Dale AM, Busa E, et al. A hybrid approach to the skull stripping problem in MRI. Neuroimage. 2004 Jul;22(3):1060–1075. doi: 10.1016/j.neuroimage.2004.03.032. [DOI] [PubMed] [Google Scholar]
- 43.Fischl B, Liu A, Dale AM. Automated manifold surgery: constructing geometrically accurate and topologically correct models of the human cerebral cortex. IEEE Trans Med Imaging. 2001 Jan;20(1):70–80. doi: 10.1109/42.906426. [DOI] [PubMed] [Google Scholar]
- 44.Benner T, Wisco JJ, van der Kouwe AJ, et al. Comparison of manual and automatic section positioning of brain MR images. Radiology. 2006 Apr;239(1):246–254. doi: 10.1148/radiol.2391050221. [DOI] [PubMed] [Google Scholar]
- 45.Han X, Jovicich J, Salat D, et al. Reliability of MRI-derived measurements of human cerebral cortical thickness: the effects of field strength, scanner upgrade and manufacturer. Neuroimage. 2006 Aug 1;32(1):180–194. doi: 10.1016/j.neuroimage.2006.02.051. [DOI] [PubMed] [Google Scholar]
- 46.Jovicich J, Czanner S, Greve D, et al. Reliability in multi-site structural MRI studies: effects of gradient non-linearity correction on phantom and human data. Neuroimage. 2006 Apr 1;30(2):436–443. doi: 10.1016/j.neuroimage.2005.09.046. [DOI] [PubMed] [Google Scholar]
- 47.Rosas HD, Liu AK, Hersch S, et al. Regional and progressive thinning of the cortical ribbon in Huntington's disease. Neurology. 2002 Mar 12;58(5):695–701. doi: 10.1212/wnl.58.5.695. [DOI] [PubMed] [Google Scholar]
- 48.Duvernoy HM, Bourgouin Maeder P, Cabanis EA, Cattin F, Guyot J, Iba-Zizen MT. The Human Brain: Surface Three-Dimensional Sectional Anatomy and MRI. 2nd ed. New York: Springer-Verlag NY Inc; 2001. [Google Scholar]
- 49.Kringelbach ML, Rolls ET. The functional neuroanatomy of the human orbitofrontal cortex: evidence from neuroimaging and neuropsychology. Prog Neurobiol. 2004 Apr;72(5):341–372. doi: 10.1016/j.pneurobio.2004.03.006. [DOI] [PubMed] [Google Scholar]
- 50.Petrides M, Mackey S. The orbitofrontal cortex: sulcal and gyral morphology and architecture. In: Zald DH, Rauch SL, editors. The Orbitofrontal Cortex. New York: Oxford University Press; 2006. pp. 19–37. [Google Scholar]
- 51.Petrides M, Pandya DN. Comparative cytoarchitectonic analysis of the human and the macaque ventrolateral prefrontal cortex and corticocortical connection patterns in the monkey. Eur J Neurosci. 2002 Jul;16(2):291–310. doi: 10.1046/j.1460-9568.2001.02090.x. [DOI] [PubMed] [Google Scholar]
- 52.Price JL. Architectonic structure of the orbital and medial prefrontal cortex. In: Zald DH, Rauch SL, editors. The Orbitofrontal Cortex. New York: Oxford University Press; 2006. pp. 4–17. [Google Scholar]
- 53.Ongur D, Ferry AT, Price JL. Architectonic subdivision of the human orbital and medial prefrontal cortex. J Comp Neurol. 2003 Jun 2;460(3):425–449. doi: 10.1002/cne.10609. [DOI] [PubMed] [Google Scholar]
- 54.Kringelbach ML, O'Doherty J, Rolls ET, Andrews C. Activation of the human orbitofrontal cortex to a liquid food stimulus is correlated with its subjective pleasantness. Cereb Cortex. 2003 Oct;13(10):1064–1071. doi: 10.1093/cercor/13.10.1064. [DOI] [PubMed] [Google Scholar]
- 55.Blood AJ, Zatorre RJ, Bermudez P, Evans AC. Emotional responses to pleasant and unpleasant music correlate with activity in paralimbic brain regions. Nat Neurosci. 1999 Apr;2(4):382–387. doi: 10.1038/7299. [DOI] [PubMed] [Google Scholar]
- 56.Goldin PR, McRae K, Ramel W, Gross JJ. The neural bases of emotion regulation: reappraisal and suppression of negative emotion. Biol Psychiatry. 2008 Mar 15;63(6):577–586. doi: 10.1016/j.biopsych.2007.05.031. [DOI] [PMC free article] [PubMed] [Google Scholar]
- 57.Barbas H. Specialized elements of orbitofrontal cortex in primates. Ann N Y Acad Sci. 2007 Dec;1121:10–32. doi: 10.1196/annals.1401.015. [DOI] [PubMed] [Google Scholar]
- 58.Barbas H, Zikopoulos B. Sequential and parallel circuits for emotional processing in primate orbitofrontal cortex. In: Zald DH, Rauch SL, editors. The Orbitofrontal Cortex. New York: Oxford University Press; 2006. pp. 57–91. [Google Scholar]
- 59.Ghashghaei HT, Barbas H. Pathways for emotion: interactions of prefrontal and anterior temporal pathways in the amygdala of the rhesus monkey. Neuroscience. 2002;115(4):1261–1279. doi: 10.1016/s0306-4522(02)00446-3. [DOI] [PubMed] [Google Scholar]
- 60.Royer S, Martina M, Pare D. An inhibitory interface gates impulse traffic between the input and output stations of the amygdala. J Neurosci. 1999 Dec 1;19(23):10575–10583. doi: 10.1523/JNEUROSCI.19-23-10575.1999. [DOI] [PMC free article] [PubMed] [Google Scholar]
- 61.Forbes EE, Christopher May J, Siegle GJ, et al. Reward-related decision-making in pediatric major depressive disorder: an fMRI study. J Child Psychol Psychiatry. 2006 Oct;47(10):1031–1040. doi: 10.1111/j.1469-7610.2006.01673.x. [DOI] [PMC free article] [PubMed] [Google Scholar]
- 62.Forbes EE, Shaw DS, Dahl RE. Alterations in reward-related decision making in boys with recent and future depression. Biol Psychiatry. 2007 Mar 1;61(5):633–639. doi: 10.1016/j.biopsych.2006.05.026. [DOI] [PubMed] [Google Scholar]
- 63.Bogdan R, Pizzagalli DA. Acute stress reduces reward responsiveness: implications for depression. Biol Psychiatry. 2006 Nov 15;60(10):1147–1154. doi: 10.1016/j.biopsych.2006.03.037. [DOI] [PMC free article] [PubMed] [Google Scholar]
- 64.Tremblay LK, Naranjo CA, Graham SJ, et al. Functional neuroanatomical substrates of altered reward processing in major depressive disorder revealed by a dopaminergic probe. Arch Gen Psychiatry. 2005 Nov;62(11):1228–1236. doi: 10.1001/archpsyc.62.11.1228. [DOI] [PubMed] [Google Scholar]
- 65.Rajkowska G, Miguel-Hidalgo JJ, Dubey P, Stockmeier CA, Krishnan KR. Prominent reduction in pyramidal neurons density in the orbitofrontal cortex of elderly depressed patients. Biol Psychiatry. 2005 Aug 15;58(4):297–306. doi: 10.1016/j.biopsych.2005.04.013. [DOI] [PMC free article] [PubMed] [Google Scholar]
- 66.Rajkowska G. Personal Communication. 2008 [Google Scholar]
- 67.Bandler R, Price JL, Keay KA. Brain mediation of active and passive emotional coping. Prog Brain Res. 2000;122:333–349. doi: 10.1016/s0079-6123(08)62149-4. [DOI] [PubMed] [Google Scholar]
- 68.Bandler R, Shipley MT. Columnar organization in the midbrain periaqueductal gray: modules for emotional expression? Trends Neurosci. 1994 Sep;17(9):379–389. doi: 10.1016/0166-2236(94)90047-7. [DOI] [PubMed] [Google Scholar]
- 69.An X, Bandler R, Ongur D, Price JL. Prefrontal cortical projections to longitudinal columns in the midbrain periaqueductal gray in macaque monkeys. J Comp Neurol. 1998 Nov 30;401(4):455–479. [PubMed] [Google Scholar]
- 70.Bandler R, Keay KA, Floyd N, Price J. Central circuits mediating patterned autonomic activity during active vs. passive emotional coping. Brain Res Bull. 2000 Sep 1;53(1):95–104. doi: 10.1016/s0361-9230(00)00313-0. [DOI] [PubMed] [Google Scholar]
- 71.Bandler R, Keay KA. Columnar organization in the midbrain periaqueductal gray and the integration of emotional expression. Prog Brain Res. 1996;107:285–300. doi: 10.1016/s0079-6123(08)61871-3. [DOI] [PubMed] [Google Scholar]
- 72.Ongur D, An X, Price JL. Prefrontal cortical projections to the hypothalamus in macaque monkeys. J Comp Neurol. 1998 Nov 30;401(4):480–505. [PubMed] [Google Scholar]
- 73.Carmichael ST, Price JL. Limbic connections of the orbital and medial prefrontal cortex in macaque monkeys. J Comp Neurol. 1995 Dec 25;363(4):615–641. doi: 10.1002/cne.903630408. [DOI] [PubMed] [Google Scholar]
- 74.Kondo H, Saleem KS, Price JL. Differential connections of the perirhinal and parahippocampal cortex with the orbital and medial prefrontal networks in macaque monkeys. J Comp Neurol. 2005 Dec 26;493(4):479–509. doi: 10.1002/cne.20796. [DOI] [PubMed] [Google Scholar]
- 75.Barbas H, Blatt GJ. Topographically specific hippocampal projections target functionally distinct prefrontal areas in the rhesus monkey. Hippocampus. 1995;5(6):511–533. doi: 10.1002/hipo.450050604. [DOI] [PubMed] [Google Scholar]
- 76.Morita T, Itakura S, Saito DN, et al. The role of the right prefrontal cortex in self-evaluation of the face: a functional magnetic resonance imaging study. J Cogn Neurosci. 2008 Feb;20(2):342–355. doi: 10.1162/jocn.2008.20024. [DOI] [PubMed] [Google Scholar]
- 77.Ferry AT, Ongur D, An X, Price JL. Prefrontal cortical projections to the striatum in macaque monkeys: evidence for an organization related to prefrontal networks. J Comp Neurol. 2000 Sep 25;425(3):447–470. doi: 10.1002/1096-9861(20000925)425:3<447::aid-cne9>3.0.co;2-v. [DOI] [PubMed] [Google Scholar]
- 78.Russchen FT, Bakst I, Amaral DG, Price JL. The amygdalostriatal projections in the monkey. An anterograde tracing study. Brain Res. 1985 Mar 11;329(1–2):241–257. doi: 10.1016/0006-8993(85)90530-x. [DOI] [PubMed] [Google Scholar]
- 79.Schultz W, Tremblay L. Involvement of primate orbitofrontal neurons in reward, uncertainty, and learning. In: Zald DH, Rauch SL, editors. The Orbitofrontal Cortex. New York: Oxford University Press; 2006. pp. 173–198. [Google Scholar]
- 80.Hadjikhani N, Joseph RM, Snyder J, Tager-Flusberg H. Anatomical differences in the mirror neuron system and social cognition network in autism. Cereb Cortex. 2006 Sep;16(9):1276–1282. doi: 10.1093/cercor/bhj069. [DOI] [PubMed] [Google Scholar]
- 81.Kuperberg GR, Broome MR, McGuire PK, et al. Regionally localized thinning of the cerebral cortex in schizophrenia. Arch Gen Psychiatry. 2003 Sep;60(9):878–888. doi: 10.1001/archpsyc.60.9.878. [DOI] [PubMed] [Google Scholar]