Abstract
Failure of cells to respond to DNA damage is a primary event associated with mutagenesis and environmental toxicity. To map the transcriptional network controlling the damage response, we measured genomewide binding locations for 30 damage-related transcription factors (TFs) after exposure of yeast to methyl-methanesulfonate (MMS). The resulting 5272 TF-target interactions revealed extensive changes in the pattern of promoter binding and identified damage-specific binding motifs. As systematic functional validation, we identified interactions for which the target changed expression in wild-type cells in response to MMS but was nonresponsive in cells lacking the TF. Validated interactions were assembled into causal pathway models that provide global hypotheses of how signaling, transcription, and phenotype are integrated after damage.
Exposure of cells to chemical and physical damaging agents can result in DNA lesions that contribute to the onset of cancer, aging, immune deficiencies, and other degenerative diseases (1). DNA damage is sensed by a highly conserved mechanism involving the ATM/ATR protein kinases in humans (ataxia-telangiectasia mutated/ataxia-telangiectasia and Rad3-related; homologous to Tel1 and Mec1 in yeast). These aggregate at DNA lesions (2) and activate signaling cascades that include the Chk protein kinases (Chk1, Rad53, and Dun1 in yeast). Chk kinases, in turn, trigger both transcriptional and transcription-independent responses, including activation of DNA repair machinery and cell-cycle arrest (1).
Beyond the known DNA repair genes, genomewide expression profiling in yeast has identified several hundred genes (3–5) whose expression is increased or decreased in response to alkylation damage by methyl-methanesulfonate (MMS). At the level of growth phenotype, systematic deletion studies have also identified several hundred genes that are required for normal recovery from alkylation damage (6–8). Surprisingly, the set of genes that, when deleted, affect damage recovery is not enriched for genes whose transcript levels change upon damage exposure (7, 9). Thus, neither transcriptional profiling alone, nor genomic phenotyping alone, adequately defines the cellular response to DNA-damaging agents. However, these studies do suggest that the DNA damage response involves multiple levels of regulation, affecting not only DNA repair genes but also genes that influence protein and lipid turnover, cytoskeleton remodeling, and general stress pathways.
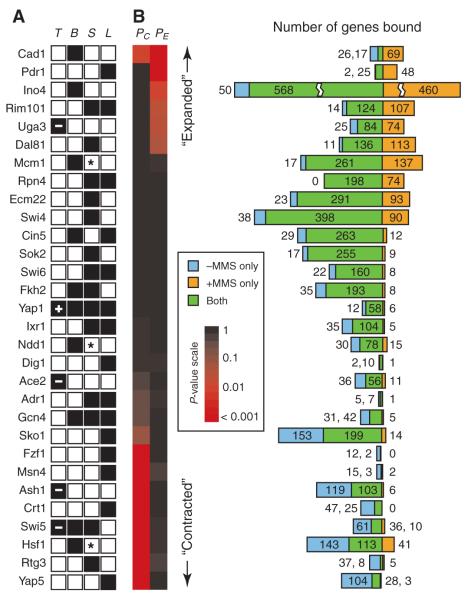
To construct a global model of yeast transcriptional networks activated by MMS, we applied a systems approach (10) that integrated data from genomewide chromatin immunoprecipitation (ChIP) assays, expression profiling, systematic phenotyping, and protein interaction databases (Fig. 1). First, we performed a systematic screen for transcription factors (TFs) involved in the MMS response. TFs were chosen from a set of 141 yeast DNA binding factors (11) and were selected according to any one of three criteria (Fig. 2A). These criteria were TF expression (that is, the TF was differentially expressed after exposure to 0.03% MMS); expression of bound genes [that is, the TF had been previously shown (11) to bind the promoters of genes that were differentially expressed in the above MMS experiment]; or sensitivity [that is, deletion of the TF gene, if not lethal, caused growth sensitivity in MMS relative to that in nominal conditions (fig. S1)].
Fig. 1.
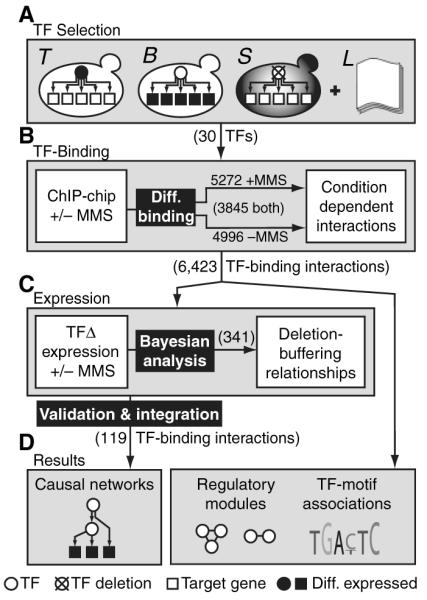
Overview of the systems approach (see text).
Fig. 2.
TF selection and ChIP-chip experiments. (A) Results of the four criteria used to select the 30 TFs [TF (T) expression, expression of bound (B) genes, sensitivity (S), or literature (L); see text]. In column T, a “+” or “−” represents increased or decreased expression, respectively. For column S, a “*” denotes essential TFs. (B) Number of gene promoters bound by each TF. The three regions represent promoters bound exclusively in the absence of MMS (blue), presence of MMS (orange), or in both conditions (green). The proportion of genes in each region was compared to a negative control data set using Fisher’s exact test (16). A red square in the left column (PC’, “Contracted”) indicates that the proportion absence/both is significantly higher than expected in the negative control. Similarly, red in the right column (PE’, “Expanded”) indicates that the proportion presence/both is higher.
A set of 23 TFs was identified (Fig. 2A). Four TFs were implicated by multiple criteria (Yap1, Gcn4, Fkh2, Swi5), and three were encoded by essential genes (Hsf1, Mcm1, Ndd1). Two of the 14 MMS-sensitive TF-deletion strains (sok2Δ and ecm22Δ) had not been reported in a previous genomewide assay for MMS sensitivity (6). The set also included seven of the nine known cell-cycle regulators (12), as might be expected given that DNA damage affects cell-cycle progression (1). A search of the literature identified 15 TFs that had been previously associated with regulation of DNA repair (13–15). Eight of these were also detected by our systematic criteria; the remaining seven were added to our list to yield a total of 30 TFs associated with the DNA damage response.
We then used the technique of chromatin immunoprecipitation coupled with microarray chip hybridization (ChIP-chip) to identify the MMS-induced transcriptional network immediately downstream of each TF (Fig. 2B). Exponentially growing yeast cultures were exposed to 0.03% MMS for 1 hour, resulting in ~50% cell viability (3, 6). At a significance threshold of P ≤ 0.001, a total of 5272 protein-DNA interactions with 2599 distinct genes were identified for the 30 factors. To reveal how the transcriptional network was reprogrammed between damaging and nondamaging conditions, we compared the MMS-induced interactions for each TF to the corresponding interactions as reported in nominal (noninduced) growth conditions by Lee et al.(11). Raw data from nominal conditions were reanalyzed using a data processing pipeline and significance threshold (P ≤ 0.001) that were identical to those used for the MMS experiments, yielding a total of 4996 protein-DNA interactions with 2588 distinct genes for the same 30 factors in nominal conditions. The detailed experimental methods and raw data files (tables S1 to S4) are provided in the supporting online material.
For each TF, we applied a pairwise statistical analysis to score the overlap in promoter binding between the damage-induced and non-induced conditions (16). This method exploits the dependency in P values of binding between two related ChIP-chip data sets to identify TF-promoter interactions with more sensitivity than can be obtained if each data set were analyzed separately (fig. S2). Using this method, the number of promoters bound by each TF ranged from 13 (Adr1 and Dig1) to 1078 (Ino4) with an average of 214 per factor. Six factors bound significantly (P < 0.05) more genes in the presence of MMS, and conversely, eight factors bound significantly more genes under nominal growth conditions (Fig. 2B).
Several promoter sets were enriched for DNA sequence binding motifs reported in the literature (Table 1) (17–19). The observed shifts in promoter binding for Cad1 and Hsf1 correlated with the known Cad1 and Hsf1 binding motifs, which were enriched in the sets of promoters bound before but not after MMS exposure. We also used the ANN-Spec algorithm (16, 20) to search each set of promoters for motifs that had not been previously reported. Four such motifs were found, associated with Gcn4, Sko1, Ndd1, or Swi5, respectively (Table 1). The GCTCGAAAA motif was found upstream of 12 of 15 genes bound by Ndd1 in the presence of MMS, but was found upstream of only 3 of 30 genes bound in the absence of MMS. Such motifs may have been missed in past analyses because they are not active before damage exposure. They may represent DNA binding sequences bound directly by the associated factor (Gcn4, Sko1, Ndd1, or Swi5) upon posttranslational modification, or alternatively, they may be bound by a different TF that is coordinately recruited to the promoters after MMS treatment.
Table 1.
DNA sequence motifs found in promoters bound in only one condition.
| Consensus sequence* | Promoter set† | No. of promoters with motif (−MMS)‡ |
No. of promoters with motif (+MMS)‡ |
Motif source§ |
|---|---|---|---|---|
| Motifs found in −MMS but not +MMS∥ | ||||
| TGACTC | Gcn4 | 20/31 | 0/5 | GCN4¶, BAS1# |
| ATTAGTAAGC | Cad1 | 18/26 | 0/69 | CAD1# |
| cGGGGG | Hsf1 | 35/143 | 1/41 | ADR1# |
| CGGGGCACnCTcStCCG | Hsf1 | 43/143 | 3/41 | GAL4¶, PUT3# |
| TTCtannnnnTTC | Hsf1 | 44/143 | 7/41 | HSF1# |
| CCGGtACCGG | Hsf1 | 37/143 | 0/41 | LEU3# |
| CGGCGCCCGCGAn | Hsf1 | 43/143 | 6/41 | RFA2 |
| GCCSnGSCC | Hsf1 | 40/143 | 1/41 | SKN7# |
| GCGGCnnnGCGGC | Hsf1 | 39/143 | 2/41 | STP1# |
| ACCCGTACAt | Yap5 | 44/104 | 0/3 | SFP1# |
| Motifs found in +MMS but not −MMS** | ||||
| TMSCTGCAAAnTT | Gcn4 | 0/31 | 5/5 | Predicted (ANN-Spec) |
| GCTCGAAAA | Ndd1 | 3/30 | 12/15 | Predicted (ANN-Spec) |
| TGAYTAACn | Sko1 | 7/153 | 11/14 | Predicted (ANN-Spec) |
| TnTCnCTCAT | Swi5 | 6/61 | 9/10 | Predicted (ANN-Spec) |
| GCGGCnnnGCGGC | Pdr1 | 0/2 | 21/48 | STP1# |
| GCSGGGnCGG | Pdr1 | 0/2 | 19/48 | SUT1# |
Letter based on IUPAC code; lowercase used when information content < 0.3 bits per position.
The set of promoters bound by each TF was analyzed for the presence of known and novel motifs.
Motif presence was scored using ANN-Spec at a threshold that predicted sites at a rate of <10−4 over all intergenic regions.
Predicted motifs were identified using ANN-Spec.
Known motifs were drawn from the SCPD database
or from Harbison et al. (17).
Enriched in −MMS-only promoters (hypergeometric P ≤ 10−7) but not in +MMS-only (P > 10−2).
Enriched in +MMS-only promoters (hypergeometric P ≤ 10−7) but not in −MMS-only (P > 10−2).
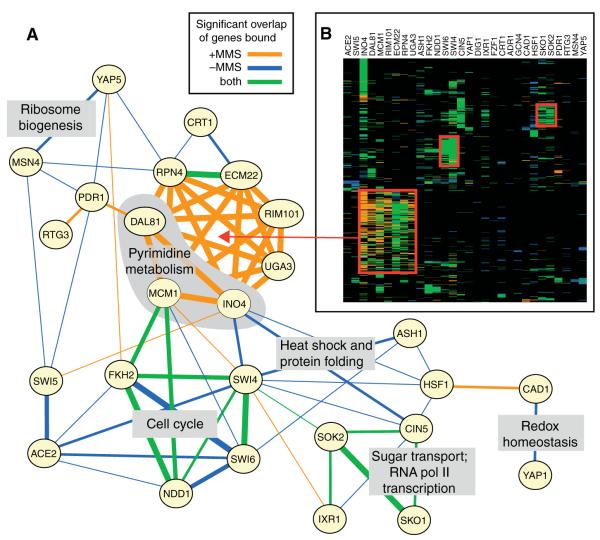
To identify combinations of TFs that regulate genes in common, we scored the significance of overlap between the gene sets bound by each pair of the 30 TFs (Fig. 3A) (hyper-geometric test at P ≤ 0.01). Cad1 was found to pair with Yap1 in the absence of MMS but paired with Hsf1 in the presence of MMS. Several cell-cycle TFs that normally co-regulate large numbers of genes (such as Fkh2 and Swi6 or Ace2 and Swi5) (12) no longer appeared to do so after MMS treatment, perhaps because DNA damage causes delayed progression through the cell cycle. A prominent combination that emerged after MMS treatment consisted of Ino4 and six other factors (Dal81, Mcm1, Rim101, Ecm22, Rpn4, and Uga3) from the “expanded” set, which regulated several hundred genes in common (Fig. 3B). An additional set of >200 genes were targeted uniquely by Ino4 both before and after damage exposure (Fig. 3B), supporting a previous hypothesis that Ino4 is a global regulator of gene expression (21).
Fig. 3.
Overlap in TF binding patterns in response to MMS. (A) TFs are linked if they bind sets of promoters that significantly overlap. Thicker lines represent overlap that is more statistically significant than overlap represented by thin lines. Linked TFs are labeled with the high-level functions of their associated sets of (co)-regulated genes. (B) Hierarchical clustering matrix for the 30 TFs (columns) across the top 1000 gene targets with highest variance (in log P-value of binding; rows) pooled over −MMS and +MMS conditions. Color is based on the binding condition(s), as in (A), or is black when the target is not bound in either condition.
Next, we sought to validate transcriptional effects of the measured binding interactions and to pinpoint the particular interaction pathways involved in transmission of the damage response signal. For this purpose, we used yeast genome microarrays to monitor MMS-induced gene expression changes across the viable knockout strains (22) for the TFs found to be important in the DNA damage response (16)(table S5). Of the 30 TFs identified, 27 were nonessential (Fig. 2A, column S) and could be profiled. Hierarchical clustering over all genes confirmed that these knockout profiles were globally more similar to the responses of wild-type cells to MMS [as measured in this study and previously (3, 4)] than to the expression responses of wild-type cells to other stress conditions (5, 23) (fig. S3). Furthermore, although ~20% of the transcriptional response to MMS may be due to slowed cell cycle progression through G1/S phase (4, 5), most responsive genes were not periodically expressed during the cell cycle (fig. S4).
Processed expression data were analyzed to identify genes that were genetically “buffered” by one or more TF deletions. In this context, we define “deletion buffering” to mean an effect in which genes that are normally differentially expressed become unresponsive in a specific knockout background. For each gene-TF combination, wild-type and knockout profiles were analyzed to score the significance of the deletion-buffering effect using a Bayesian scoring scheme (fig. S5, table S6) (16). At P ≤ 0.005, a total of 341 genes showed deletion buffering in the 27 knockouts, corresponding to 27 genes on average over a range of 90 genes for the Adr1 knockout to 4 genes for the Ecm22 knockout (fig. S6).
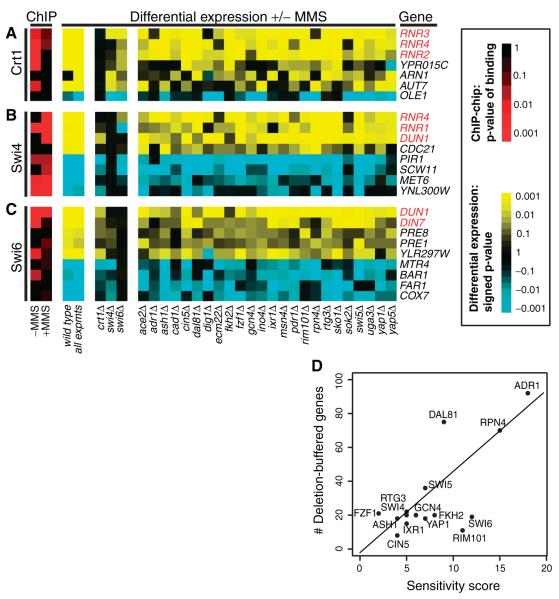
As a positive control, we examined the deletion-buffering results for Crt1 (Rfx1), a transcriptional repressor of the ribonucleotide-diphosphate reductase (RNR) complex that catalyzes synthesis of new nucleotides during DNA repair (24, 25). As expected, the expression levels of RNR2, 3, and 4 were deletion-buffered in the crt1Δ strain but not in most other strains, and Crt1 bound the promoters of these genes before but not after MMS treatment (Fig. 4A; fig. S7). Many of the remaining deletion-buffering events represent previously undocumented regulatory relationships. For example, contrary to a previous report (26), we found that both members of the Swi4-Swi6 complex could bind the DUN1 promoter and were required for the DUN1 transcriptional response (Fig. 4, B and C).
Fig. 4.
Representative genes showing deletion buffering for (A) Crt1, (B) Swi4, or (C) Swi6. Expression changes are colored yellow for up-regulation or blue for down-regulation. Genes highlighted in red are those previously known to function in the DNA damage response. (D) Correlation between phenotypic sensitivity of each deletion strain in MMS (x axis) versus the number of genes buffered by the TF deletion (y axis). Sensitivity scores were drawn from (6). Scores range from 0 to 30, where high scores indicate that a TF deletion was found to be sensitive to low concentrations (less than 0.03%) of MMS over replicate growth experiments. Only TFs with detectable sensitivity (score > 0) are shown.
Beyond validation of individual interactions, the deletion-buffering analysis provided insights into the damage response system as a whole. Paradoxically, the set of genes that are differentially expressed in response to DNA damage does not significantly overlap with the set of genes required for growth under damaging conditions (7, 9). Our new expression data confirmed these findings for MMS, but also showed that the number of genes buffered by a TF knockout was highly correlated with its degree of MMS sensitivity (r = 0.72) (Fig. 4D). For example, adr1Δ, the most sensitive TF knockout in our study, also buffered the largest number of genes. Thus, the TFs most essential for cellular recovery after MMS exposure are, apparently, also the most central to the MMS transcriptional response.
The opposite of deletion buffering is deletion enhancement, that is, genes that are MMS responsive in a TF deletion strain but not in the wild type. Deletion enhancement was a much rarer event than deletion buffering. At the same P-value threshold, only 16 genes showed deletion enhancement, whereas 341 showed deletion buffering (table S7). TFs associated with deletion enhancement appear to be required to maintain stable expression of a set of genes, which become MMS responsive in their absence.
Only 11% of the observed deletion-buffering events (37 out of 341) coincided with a direct ChIP-chip binding interaction (fig. S8). Such low overlap might occur for two reasons. First, failure to detect deletion buffering does not necessarily invalidate TF-promoter binding. Second, an observed deletion-buffering effect might be indirect, that is, mediated by longer regulatory pathways connecting the deleted TF to its regulated gene through one or more intermediate factors.
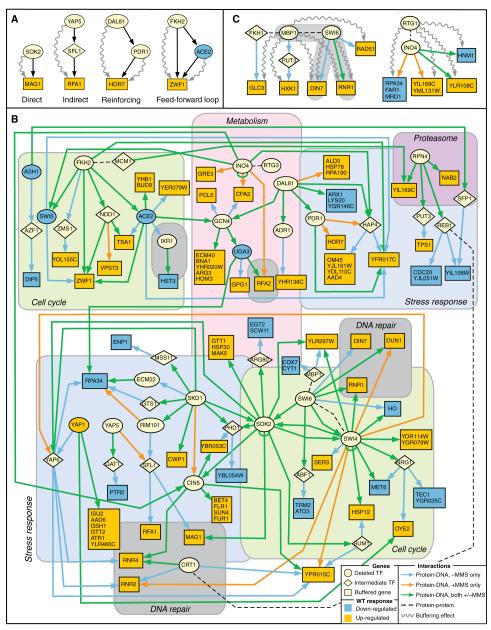
To identify these longer pathways, we applied a Bayesian modeling procedure (27) to search the known physical network for the smallest set of paths (of two interactions) that were supported by the largest number of deletion-buffering events (16). Types of regulatory pathways identified are shown in Fig. 5A. The physical network consisted of TF-promoter binding interactions from (i) the 5272 interactions measured in the presence of MMS for the 30 TFs in our study; (ii) the 4996 interactions measured for these TFs under nominal conditions; and (iii) 5903 interactions for the 74 additional TFs assayed by Lee et al. (11), also in nominal conditions. We also included (iv) a set of 14,319 high-throughput protein-protein interaction measurements from the Database of Interacting Proteins (28). These protein-protein interactions were measured in cells grown in the absence of MMS and hence might or might not be present in MMS-treated cells. In the combined network, a link from protein A to B represented the observation that protein A directly targets the promoter of the gene encoding protein B [sources (i) through (iii)] or that proteins A and B physically interact [source (iv)].
Fig. 5.
A network of regulatory interactions connecting TFs to deletion-buffered genes. (A) Example regulatory paths in which deletion-buffering effects (squiggled arrows) support binding interactions (straight arrows). (B) The full validated model based on overlap between binding and buffering (see text). Buffering effects are omitted for clarity (listed in table S8). Regions of the network are organized on the basis of known functions of the deleted TFs. (C) Models resulting from follow-up experiments to generate buffering profiles for Mbp1 and Rtg1.
In total, we identified 68 buffering events that validated 88 longer paths. These paths were combined with the 37 direct effects identified earlier to formulate a model of the transcriptional response to MMS (Fig. 5B; tables S8 and S9). This model explains the MMS expression response of 82 genes and provides the basic scaffold on which interprocess communication is achieved in the transcriptional response to an alkylating agent. At the core of the model are the known damage response genes RNR1, RNR2, RNR4, RFA1, RFA2, DIN7, DUN1, and MAG1 (3). Although some of the TFs regulating these genes are expected on the basis of previous studies (e.g., Swi4, Swi6, or Crt1), many others would not have been predicted, including those that have been previously associated with lipid metabolism (Ino4), stress response (e.g., Yap5), or cyclic adenosine 5′-monophosphate–dependent signal transduction (Sok2). Overall, the model highlights extensive regulatory cross-talk among the processes of DNA replication and repair, cell cycle and cell-cycle arrest, stress responses, and metabolic pathways.
Every path of length two implicates an intermediate factor that is expected to regulate a set of genes similar to that regulated by the deleted TF. Some of these paths (6 out of 88), such as Dal81→Pdr1→HOR7 and Fkh2→Ace2→ZWF1, were already consistent with available data for both the source (e.g., Dal81 or Fkh2) and the intermediate (e.g., Pdr1 or Ace2) factor, because both TFs were already included among the 27 assayed (“Reinforcing” or “Feed-forward loop” in Fig. 5A). Other paths included intermediate factors for which the transcription profiles were implied but untested (“Indirect” in Fig. 5A), suggesting follow-up experiments to refine the model.
Swi6 is thought to bind DNA in a complex with either Swi4 or Mbp1 (29). To discriminate which Swi6 targets were Mbp1 dependent, we analyzed an mbp1 knockout strain. The set of genes deletion-buffered by mbp1Δ was found to overlap with the swi6Δ-buffered set, including the genes RNR1 and DIN7 (Fig. 5C). Thus, RNR1 and DIN7 appear to depend on both Mbp1 and Swi6 for proper regulation.
Noting that loss of Rtg3 caused deletion buffering of many downstream genes through the path Rtg3→Ino4, we investigated whether loss of Rtg1, a binding partner of Rtg3 (30), would produce a similar outcome. Indeed, loss of Rtg1 buffered many genes that were bound by Ino4 (Fig. 5C). However, the sets of Rtg1 versus Rtg3 deletion-buffered genes did not strongly overlap. Thus, in response to MMS exposure, Rtg1 and Rtg3 appear to collaborate with Ino4 to regulate a battery of genes (whose products influence phospholipid metabolism and retrograde transport), but their functional roles are not interchangeable.
We have integrated TF binding profiles with genetic perturbations, mRNA expression, and protein interaction data to reveal direct and indirect interactions between TFs and MMS-responsive genes. The result is a highly interconnected physical map of regulatory pathways supported by both binding and deletion-buffering profiles. Some relations in this map are confirmed by previous studies, but most represent the basis for new hypotheses. As systems-level approaches continue to map the connectivity of large cellular systems, an important goal will be to make these maps even more integrative and to learn how to use them to predict the effects of different drugs, dosages, and genetic dispositions on pathway function.
Supplementary Material
Acknowledgments
31. We acknowledge funding from the National Institute of Environmental Health Sciences (NIEHS), the National Cancer Institute (NCI), and the David and Lucille Packard Foundation. L.D.S. is the Ellison American Cancer Society Research Professor. We thank R. Young, D. Odom, T. I. Lee, M. Daly, and B. Ren for assistance with ChIP-chip analysis and J. Kadonaga, W. McGinnis, and G. Kassavetis for consultations on the binding motif predictions. Microarray data have been deposited in the ArrayExpress database (accession numbers E-TABM-92 and E-TABM-93).
Footnotes
Supporting Online Material www.sciencemag.org/cgi/content/full/312/5776/1054/DC1 Materials and Methods Figs. S1 to S8 Tables S1 to S9 References
References and Notes
- 1.Friedberg EC, et al. DNA Repair and Mutagenesis. ed. 2 American Society for Microbiology; Washington, DC: 2005. [Google Scholar]
- 2.Rouse J, Jackson SP. Science. 2002;297:547. doi: 10.1126/science.1074740. [DOI] [PubMed] [Google Scholar]
- 3.Gasch AP, et al. Mol. Biol. Cell. 2001;12:2987. doi: 10.1091/mbc.12.10.2987. [DOI] [PMC free article] [PubMed] [Google Scholar]
- 4.Jelinsky SA, Samson LD. Proc. Natl. Acad. Sci. U.S.A. 1999;96:1486. doi: 10.1073/pnas.96.4.1486. [DOI] [PMC free article] [PubMed] [Google Scholar]
- 5.Jelinsky SA, Estep P, Church GM, Samson LD. Mol. Cell. Biol. 2000;20:8157. doi: 10.1128/mcb.20.21.8157-8167.2000. [DOI] [PMC free article] [PubMed] [Google Scholar]
- 6.Begley TJ, Rosenbach AS, Ideker T, Samson LD. Mol. Cell. 2004;16:117. doi: 10.1016/j.molcel.2004.09.005. [DOI] [PubMed] [Google Scholar]
- 7.Begley TJ, Rosenbach AS, Ideker T, Samson LD. Mol. Cancer Res. 2002;1:103. [PubMed] [Google Scholar]
- 8.Chang M, Bellaoui M, Boone C, Brown GW. Proc. Natl. Acad. Sci. U.S.A. 2002;99:16934. doi: 10.1073/pnas.262669299. [DOI] [PMC free article] [PubMed] [Google Scholar]
- 9.Birrell GW, et al. Proc. Natl. Acad. Sci. U.S.A. 2002;99:8778. doi: 10.1073/pnas.132275199. [DOI] [PMC free article] [PubMed] [Google Scholar]
- 10.Ideker T, et al. Science. 2001;292:929. doi: 10.1126/science.292.5518.929. [DOI] [PubMed] [Google Scholar]
- 11.Lee TI, et al. Science. 2002;298:799. doi: 10.1126/science.1075090. [DOI] [PubMed] [Google Scholar]
- 12.Simon I, et al. Cell. 2001;106:697. doi: 10.1016/s0092-8674(01)00494-9. [DOI] [PubMed] [Google Scholar]
- 13.Habeler G, et al. Nucleic Acids Res. 2002;30:80. doi: 10.1093/nar/30.1.80. [DOI] [PMC free article] [PubMed] [Google Scholar]
- 14.Mewes HW, et al. Nucleic Acids Res. 2002;30:31. doi: 10.1093/nar/30.1.31. [DOI] [PMC free article] [PubMed] [Google Scholar]
- 15.Friedberg EC, Siede W, Cooper AJ. In: The Molecular and Cellular Biology of the Yeast Saccharomyces. Broach JR, Pringle J, Elizabeth J, editors. vol. 1. Cold Spring Harbor Laboratory Press; Cold Spring Harbor: 1991. pp. 147–192. [Google Scholar]
- 16.Materials and methods are available as supporting material on Science Online.
- 17.Harbison CT, et al. Nature. 2004;431:99. doi: 10.1038/nature02800. [DOI] [PMC free article] [PubMed] [Google Scholar]
- 18.Zhu J, Zhang MQ. Bioinformatics. 1999;15:607. doi: 10.1093/bioinformatics/15.7.607. [DOI] [PubMed] [Google Scholar]
- 19.Wingender E, et al. Nucleic Acids Res. 2001;29:281. doi: 10.1093/nar/29.1.281. [DOI] [PMC free article] [PubMed] [Google Scholar]
- 20.Workman CT, Stormo GD. Pac. Symp. Biocomput. 2000;5:467. doi: 10.1142/9789814447331_0044. [DOI] [PubMed] [Google Scholar]
- 21.Santiago TC, Mamoun CB. J. Biol. Chem. 2003;278:38723. doi: 10.1074/jbc.M303008200. [DOI] [PubMed] [Google Scholar]
- 22.Winzeler EA, et al. Science. 1999;285:901. doi: 10.1126/science.285.5429.901. [DOI] [PubMed] [Google Scholar]
- 23.Gasch AP, et al. Mol. Biol. Cell. 2000;11:4241. doi: 10.1091/mbc.11.12.4241. [DOI] [PMC free article] [PubMed] [Google Scholar]
- 24.Huang M, Zhou Z, Elledge SJ. Cell. 1998;94:595. doi: 10.1016/s0092-8674(00)81601-3. [DOI] [PubMed] [Google Scholar]
- 25.Chabes A, et al. Cell. 2003;112:391. doi: 10.1016/s0092-8674(03)00075-8. [DOI] [PubMed] [Google Scholar]
- 26.Iyer VR, et al. Nature. 2001;409:533. doi: 10.1038/35054095. [DOI] [PubMed] [Google Scholar]
- 27.Yeang CH, Ideker T, Jaakkola T. J. Comput. Biol. 2004;11:243. doi: 10.1089/1066527041410382. [DOI] [PubMed] [Google Scholar]
- 28.Xenarios I, et al. Nucleic Acids Res. 2002;30:303. doi: 10.1093/nar/30.1.303. [DOI] [PMC free article] [PubMed] [Google Scholar]
- 29.Koch C, Moll T, Neuberg M, Ahorn H, Nasmyth K. Science. 1993;261:1551. doi: 10.1126/science.8372350. [DOI] [PubMed] [Google Scholar]
- 30.Jia Y, Rothermel B, Thornton J, Butow RA. Mol. Cell. Biol. 1997;17:1110. doi: 10.1128/mcb.17.3.1110. [DOI] [PMC free article] [PubMed] [Google Scholar]
Associated Data
This section collects any data citations, data availability statements, or supplementary materials included in this article.


