

Abstract
Background
Gene expression changes in the liver after acute binge drinking may differ from the changes seen in chronic ethanol feeding in the rat. The changes in gene expression after chronic ethanol feeding may sensitize the liver to alcohol-induced liver damage, which is not seen after acute binge drinking.
Methods
To test this hypothesis, gene microarray analysis was performed on the livers of rats (n = 3) fed an acute binge dose of ethanol (6 g/kg body wt) and killed at 3 and 12 hours after ethanol by gavage. The gene microarrays were compared with those made on the liver of rats from a previous study, in which the rats were fed ethanol by intragastric tube for 1 month (36% of calories derived from ethanol).
Results
Microarray analysis data varied between the acute and chronic models in several important respects. Growth factors increased mainly in the chronic alcohol fed rat. Changes in enzymes involved in oxidative stress were noted only with chronic ethanol feeding. Gene expression of fat metabolism was increased only with chronic ethanol feeding. Most importantly, epigenetic related enzymes and acetylation and methylation of histones changed only after chronic ethanol feeding.
Conclusions
The results support the concept that chronic ethanol ingestion induces altered gene expression as a result of changes in epigenetic mechanisms, where acetylation and methylation of histones were altered.
Keywords: Epigenetic Memory, Ethanol, Phenotype, Binge Drinking, Chronic Alcoholic Liver Disease
ALCOHOL INGESTION INDUCES an epigenetic change in gene expression which may be a mechanism for ethanol-induced liver injury (Shukla et al., 2008). Chronic ethanol feeding by intragastric tube feeding leads to liver pathology, including steatosis, apoptosis, inflammation, and fibrosis (French et al., 1986). The various mechanisms involved in liver injury include oxidative stress because of CYP2E1 induction by ethanol (French et al., 1993a; Morimoto et al., 1993), the amount and type of dietary fat (French et al., 1986; French et al., 1993b), and the blood alcohol level (Bardag-Gorce et al., 2002; Tsukamoto et al., 1985). However, recently, evidence has been reported which supports a role for epigenetic phenotypic change in the pathogenesis of liver pathology, especially when the blood alcohol levels (BAL) are high (Bardag-Gorce et al., 2006, 2007; French et al., 2005; Li et al., 2004). Histone 3 lysine 9 acetylation and histone acetyltransferase P300 (HAT) were increased when the BAL were high but not when they were low in the intragastric tube feeding rat model of chronic alcoholic liver disease (Bardag-Gorce et al., 2007). The question that is addressed here is; will a single episode of binge drinking induce the same gene microarray response as seen after chronic ethanol feeding was given? To answer this question, microarrays were performed at 3 and 12 hours after a bolus of alcohol and the results were compared with the microarrays performed after feeding alcohol by intragastric tube for 1 month.
MATERIALS AND METHODS
Animal Model of Alcoholic Liver Disease
Male Wistar rats from Harleco (Hollister, CA) weighing 250 to 300 g were used. The rats (number 3 to 4/group) were fed acutely an alcohol bolus (6 g/kg body weight, 20% solution of ethanol) by gavage. Controls were fed isocaloric glucose. The rats were killed 3 hours or 12 hours after the alcohol feeding. Urine and blood were collected during killing to measure alcohol levels. Blood alanine aminotransferase (ALT) levels were also measured. Liver tissue was quick frozen in isopentane in liquid nitrogen and gene microarray analysis was performed on RNA extracted from the fast frozen tissue. Liver tissue was also fixed in 10% zinc formalin for H&E staining. The microarray results were compared with microarrays done on liver tissue from previously reported studies (Bardag-Gorce et al., 2006; French et al., 2005). The chronic ethanol fed rats were fed a liquid diet intragastrically containing ethanol (13 g/kg/d at a constant rate for 1 month (Li et al., 2000) (alcohol-fed group). Pair-fed controls were fed dextrose isocaloric to ethanol (pair-fed control group). The ethanol fed rats were killed at either the peaks or troughs of the urinary alcohol cycle (UAL) as determined by measuring the daily 24 urinary alcohol levels. The urine was collected under toluene using metabolic cages, one rat/cage. The urinary alcohol level was measured using a kit (QED Saliva Alcohol test kit A 150, STC Technologies, Bethlehem, PA). During killing under isofluorane anesthesia, the liver was removed and weighed. A portion of the livers were quick frozen and stored in isopentane in liquid nitrogen followed by storage at −80°C.
The rats were maintained according to the Guidelines of Animal Care, as described by the National Academy of Sciences and published by the National Institute of Health (1996).
Microarray Analysis
RNA extraction of quick frozen liver tissue stored at −80°C was subjected to microarray analysis. Microarray analysis on livers of chronic ethanol fed rats from previously reported studies were compared with the microarray analysis on livers of rats fed ethanol acutely.
RNA extraction
Approximately 50 to 100 μg of frozen liver samples and 1000 μl of Trizol® (Invitrogen™, Carlsbad, CA) were added to a Bio 101 bead tube containing Lysing Matrix D (MP Biomedicals, LLC, Irvine, CA). Each tissue was homogenized by processing the tubes in the FastPrep centrifuge (MP Biomedicals LLC, Irvine, CA) for 30 s and incubating them on ice for 1 min. Total RNA was extracted following the Trizol® protocol using chloroform, heavy phase lock gel tubes (Eppendorf, Westbury, NY), and isopropanol. RNA quality was confirmed using Agilent's 2100 BioAnalyzer (Santa Clara, CA).
About 5 μg of total RNA was used for preparing biotin-labeled cRNA. Fifteen micrograms of labeled and fragmented cRNA were subsequently hybridized to Rat Genome 230 2.0 Array (Affymetrix, Santa Clara, CA). RNA isolation, labeling, and data analysis were performed at the Microarray Core at Los Angeles Biomedical Research Institute. Hybridization, washing, staining, and scanning of the chips were performed at the Microarray Core at Cedars-Sinai Medical Center.
cDNA Microarray
Sample preparation and loading
Equal amount of RNA (5 μg) from each sample were used for Affymetrix GeneChip analysis. RNA was converted to cDNA using GeneChip® One-Cycle cDNA Synthesis Kit (Affymetrix) and then converted to biotinylated cRNA using GeneChip® IVT Labeling Kit. The quality of labeled RNA was confirmed with the Affymetrix Test 3 Array before placement on chip.
Hybridization and Staining
The hybridization cocktail was prepared, which includes controls at the fragmented cRNA. The samples were hybridized in the array at 45°C for 17 hours using GeneChip Hybridization Oven 640. Immediately following hybridization, the array underwent an automated washing and staining protocol (R-Phycoerythin Streptavidin conjugated, Molecular Probes, Eugene, OR) on the GeneChip Fluidics Station 400. The arrays were then scanned with a GeneChip Scanner 3000 (Affymetrix). The sample quality was checked first, by running the cRNA on the Bioanalyzer and then was checked a second time by using the Test 3 (Affymetrix) array prior to hybridization of the samples on to the Rat Genome Array.
Microarray Data Analysis
Data preparation, analysis, and integration were performed using Affymetrix's GeneChip Operating Software (GCOS). The software was used to perform image processing, evaluation of data quality, normalization, transformation, and filtering, so that data were ready for further analysis. Wilcoxon's signed rank test was used in comparison analysis to derive biologically significant results from the raw probe intensities on expression arrays. For comparison analysis, each probe set on the experiment array was compared with its counterpart on the control array to calculate the change in p-value that was used to generate the difference call of increase (I; p < 0.04), marginal increase (MI; p < 0.04 to p < 0.06), decrease (D; p > 0.997), marginal decrease (MD; p > 0.992 to p > 0.997), or no change (NC; p > 0.06 to p < 0.997). Comparison analyses were used to generate a signal log ratio for each probe prior to experimental array to the corresponding probe pair on the control array. This strategy canceled out differences resulting from different probe binding coefficients. Signal log ratio was computed by using a one-step Tukey's biweight method by taking a mean of the log ratio of probe pair intensities across the 2 arrays.
Once the absolute, pair-wise comparison, and replicate comparison data files were created in GCOS, genes were identified with signal intensity differences using BULLFROG v12.3 TG (Lockhart and Lockhart) and GeneSpring (Silicon Genetics). In the BULLFROG analysis, the pair-wise comparisons were used to find consistent differences among all of the samples compared. The criteria used are the following: a change call of increase/marginal increase or decrease/marginal decrease, a fold change >1.5, and a present call in at least one of the arrays. BULLFROG was also used to determine the amount of variability between replicates. In GeneSpring the probes were first normalized using “Per Gene: Normalize to median.” Next, transcripts were determined to be differentially expressed based on the following criteria: a Change Call of Increase, Marginal Increase, Decrease, or Marginal Decrease with a Change in p value <0.0006 or >0.994, a Signal Log Ratio <−0.06 or >0.6, a Present Call for the probe set in either or both experimental conditions, and a minimum signal intensity of 50 in a probe in either or both of the experimental files.
After generating a list of differentially expressed genes, down stream analysis was performed. The filtered transcripts were clustered in GeneSpring using the heatmap and K-means clustering to find similar patterns of gene expression.
The lists of transcripts were also uploaded into GenMapp (Gene Micro Array Pathway Profiler, Gladstone Institutes, University of California at San Francisco, CA). This software clusters the transcripts based on biological function.
Nuclear Isolation
The isolation of nuclei was carried out according to the method of Umlauf and colleagues (2004). Briefly, liver tissue was homogenized using a dounce homogenizer and centrifuged for 10 min. at 6000 × g. The Pellets were then resuspended and centrifuged for 20 min. at 9000 × g on a sucrose cushion. The pellets containing nuclei were then collected and protein concentrations were measured using the Bio-Rad reagent (Bradford, 1976).
Western Blots
About 5 μg of protein from liver homogenates, cytosol, or nuclear extracts was used in SDS-PAGE electrophoresis using either a 7% or 12% separation gel, depending on the size of the protein molecular weight (Laemmli, 1970). Proteins were transferred to a polyvinylidene difluoride membrane (Bio-Rad, Hercules, CA) for 1 hour in 2.5 mm/L Tris–HC1 (pH 8.3), 192 mmol/L glycine, and 20% methanol. An immunologic stain was performed using an enhanced chemiluminescence kit (Amer-sham, Piscataway, NJ) or an alkaline phosphatase kit (BioRad, Hercules, CA). The membranes were then scraped and stained with a second antibody to α actin to correct for protein loading differences. Antibodies and sources used are listed as follows: Histone 3 Acetylated lysine 9 (AcH3K9) and histone 3 Acetylated lysine 18 (AcH3K18) (Cell Signaling Technology Danvers, MA); p300 (Santa Cruz Biotech Santa Cruz, CA); HDAC2 (BIOMOL International, L.P. Plymouth Meeting, PA); dimethyl histone 3 lysine 4 (H3K4me2) and trimethyl histone 3 lysine 27 (Active Motif, Carlsbad CA); and 5-methylcytosine (Calbiochem, Inc., La Jolla, CA).
Quantitative Real-Time RT-PCR Assay
Total liver RNAs were extracted with Trizol Plus RNA Purification Kit (Invitrogen). Synthesis of cDNAs was performed with 5 γg total RNA, and 50 ng random hexamer primers using SuperSriptIII RNase H− Reverse Transcriptase (Invitrogen). PCR primers were designed with the assistance of the Primer Express software (Applied Biosystems, Foster City, CA). The primers were:
| Aldh1a4 | NM_017272 | Forward | CGCACCATGGATGCTTCA |
| Aldh1a4 | NM_017272 | Reverse | CGCGATCTCTCTCCATTAAGTCA |
| Sirt1 | NM_001107627 | Forward | TGACTTCAGATCAAGAGATGGTATTTATG |
| Sirt1 | NM_001107627 | Reverse | TGGCTTGAGGATCTGGGAGAT |
| PGC1a | NM_031347 | Forward | GCGCCAGCCAACACTCA |
| PGC1a | NM 031347 | Reverse | TGGGTGTGGTTTGCATGGT |
| PPARγ | NM_013124 | Forward | GACCTGAAGCTCCAAGAATACCA |
| PPARγ | NM_013124 | Reverse | TAGAGTTGGGTTTTTTCAGAATAATAAGG |
| RARb | NM_011243 | Forward | GCGGAGAGATCATGTTTGACTGTA |
| RARb | NM_011243 | Reverse | GAAGGGCTCGCGGTGTAGA |
Sense and anti-sense: Quantitative PCR was achieved using the SYBR Green JumpStart™ Tag ReadyMix (Sigma, St. Louis, MO) on an ABI PRISM 7700 Sequence Detector System (Applied Biosystems). The thermal cycling consists of an initial step at 50°C for 2 min, followed by a denaturation step at 95°C for 10 min, then 40 cycles at 95°C for 15 s and 60°C for 1 min. Single PCR product was confirmed with the heat dissociation protocol at the end of the PCR cycles. Quantitative values were obtained from the threshold PCR cycle number (Ct) at which point the increase in signal associated with an exponential growth for PCR product starts to be detected. The target mRNA abundance in each sample was normalized to its 18S level as ΔCt = Cttarget gene − Ct18S. For each target gene, the highest ΔCt was assigned as ΔCtmax.
Statistical Analysis
Tissue from 3 rats/group (control, high BAL, and low BAL) were compared. p-values were determined by ANOVA and Bonferroni multiple group comparisons (Sigma Software, San Francisco, CA).
RESULTS
Rats fed ethanol and killed at 3 and 12 hours had normal ALT levels and normal liver morphology when compared with controls (Table 1). Blood alcohol levels were high at 3 hours and low at 12 hours, analogous to the BAL levels at the peaks and troughs of rats fed alcohol chronically by intragastric tube feeding (Bardag-Gorce et al., 2002).
Table 1.
UAL, BAL, Alanine aminotransferase (ALT), and pathology score were determined for 3 and 12 hours after gavage feeding of ethanol
| Treatment | Time (hour) | UALmg% | BALmg% | ALTU/L | Path score | N |
|---|---|---|---|---|---|---|
| Alcohol | 3 | 453.33 ± 56.66 | 347.86 ± 68.03 | 50.75 ± 2.9 | 0 | 4 |
| Dextrose | 3 | 0 | 0 | 41.25 ± 3.1 | 0 | 4 |
| Alcohol | 12 | 33.4 ± 15.5 | 29 ± 17.39 | 54 ± 3.2 | 0 | 3 |
| Dextrose | 12 | 0 | 0 | 50 ± 4 | 0 | 3 |
Gene microarrays of livers from the 3-hour alcohol bolus fed rats showed that the expression of 488 genes were changed, most of which were up-regulated compared with controls (Fig. 1). The liver gene microarrays of the 12-hour alcohol bolus fed rats showed that the expression of 586 genes were changed.
Fig. 1.

Gene microarrays at 3 hours and 12 hours after an ethanol bolus were compared with 3 and 12 hours controls given isocaloric diet (red lines represent up-regulated genes and green lines represent down-regulated genes). The 1 month of chronic ethanol ingestion heat map is reprinted from Bardag-Gorce and colleagues (2007), with permission from Elsevier (mean ± SEM, n = 3).
The increase in gene expression induced with the bolus feeding of alcohol involved most of the functional pathways (Fig. 2). The only pathways which showed down-regulation of more than 1 gene at 3 hours were cell cycle, cytokine–cytokine receptor interaction, MAPK signaling, and Jak-STAT signaling. The TGF-beta signaling pathway was the most prominent in this regard. The results at 12 hours showed that many of the pathways had more down-regulated genes compared with the results at 3 hours up-regulated genes were about the same as the 3-hour results. At 12 hours the number of genes up-regulated were roughly the same number as the down-regulated genes (Fig. 1).
Fig. 2.

The functional pathways due to changes in gene expression at 3 hours (A) and 12 hours (B) after ethanol bolus feeding are compared with the controls. Red is up-regulated and green is down-regulated (mean ± SEM, n = 3).
Table 2 compares specific gene expressions, which were changed in response to a bolus of ethanol (3 and 12 hours) and at the peak and trough of the urinary alcohol level (UAL) after 1 month of chronic ethanol intragastric tube feeding (n = 3) (Bardag-Gorce et al., 2005).
Table 2.
Listed are changes in specific gene expressions
| Ratio (experimental vs. control) |
|||||
|---|---|---|---|---|---|
| Gen title | Gen symbol | Peak | Trough | 12 hours | 3 hours |
| Cyclin-dependent kinase inhibitor 1A or CDKN1A | p21 | nc | nc | nc | nc |
| Tumor necrosis factor | TNF alpha | nc | nc | nc | nc |
| Transforming growth factor | TGF beta | nc | nc | nc | −1.5 |
| Adiponectin | Acrp30, apM1 | nc | nc | nc | nc |
| Sterol regulatory element-binding protein | SREBP | nc | nc | nc | nc |
| Catalase | Cat | nc | nc | nc | nc |
| Nuclear factor-kappa B | NFκB | nc | nc | nc | nc |
| Inhibitor of kappa B | IκB | nc | nc | nc | nc |
| Insulin-like growth factor-binding protein 1 | igfbpi | 18.5 | 20.1 | 10.78 | nc |
| Aldehyde dehydrogenase family 1, subfamily A4 | Aldh1a4 | 10.7 | 3.2 | nc | nc |
| Peroxisome proliferative activated receptor, gamma, coactivator 1 alpha | PGC1a | 8.3 | nc | nc | nc |
| Prolactin receptor | Prlr | 8.2 | 11 | nc | nc |
| Growth arrest and DNA-damage-inducible 45 beta (predicted) | Gadd45b | 7.8 | 6.8 | nc | nc |
| Kruppel-like factor | Klf2 | 7.8 | nc | nc | nc |
| Early growth response 1 | Egr1 | 7.5 | 15.2 | nc | nc |
| Cytochrome P450, family 1, subfamily a, polypeptide 1 | Cyp1a1 | 6.4 | 4 | nc | nc |
| NAD(P)H dehydrogenase, quinone 1 | Nqo1 | 4.6 | 3.8 | 2.23 | nc |
| Retinoic acid receptor, beta | RARb | 3.8 | 2.2 | nc | nc |
| Aldehyde dehydrogenase family 1, member A1 | Aldh1a1 | 3.1 | nc | nc | nc |
| v-jun sarcoma virus 17 oncogene homolog (avian) | Jun | 2.9 | nc | nc | |
| Jun-B oncogene | Junb | 2.8 | 5.5 | 2.23 | 2.5 |
| Kruppel-like factor 3 (basic) | Klf3 | 2.5 | nc | nc | nc |
| Fatty acid synthase | Fasn | 2.4 | nc | −3.18 | 2.1 |
| Connective tissue growth factor | Ctgf | 2.4 | nc | 2.01 | nc |
| Janus kinase 3 | Jak3 | 2.4 | 2.7 | 1.95 | nc |
| Fatty acid binding protein 5, epidermal | Fabp5 | 2.3 | 2.8 | nc | nc |
| Protein kinase, cAMP-dependent, regulatory, type 2, alpha | Prkar2a (AMPK) | 2.3 | 1.8 | 2.6 | nc |
| Ubiquitin-conjugating enzyme E2G 2 (predicted) | Ube2g2 | 2 | nc | nc | 2.5 |
| Jun D proto-oncogene | JunD | 1.9 | 1.6 | nc | nc |
| Nitric oxide synthase trafficking | Nostrin (NOS) | 1.9 | nc | nc | nc |
| Aryl hydrocarbon receptor | Ahr | 1.9 | nc | nc | nc |
| Sirtuin 3 (silent mating type information regulation 2, homolog) 3 (S. cerevisiae) (predicted) | Sirt3 | 1.9 | nc | nc | nc |
| Cytochrome P450, family 4, subfamily a, polypeptide 14 | Cyp4a14 | 1.7 | nc | 1.97 | nc |
| Cytochrome P450 IIA1 (hepatic steroid hydroxylase IIA1) gene | Cyp2a1 | 1.7 | nc | nc | 1.5 |
| Itchy homolog E3 ubiquitin protein ligase | Itch | 1.7 | nc | nc | nc |
| Cbp/p300-interacting transactivator, with Glu/Asp-rich carboxy-terminal domain, 2 | CBP/p300 | 1.7 | nc | nc | nc |
| Forkhead box O1A | Foxola | 1.7 | nc | nc | nc |
| Lactate dehydrogenase D (predicted) | Ldhd_predicted | −1.8 | −1.7 | nc | nc |
| Aldehyde dehydrogenase 1 family, member B1 (predicted) | Aldh1b1_predicted | −2.2 | nc | −2.6 | nc |
| Bcl2 modifying factor | Bmf | −2.6 | −2.1 | nc | nc |
| NADPH oxidase 4 | Nox4 | −3.6 | −5.7 | nc | nc |
| Cytochrome P450, subfamily 2A, polypeptide 1 | Cyp2a2 | −4.1 | −5.3 | nc | nc |
| Carbonic anhydrase 3 | Ca3 | −4.1 | −2.8 | nc | nc |
| Cyclin D1 | Ccnd1 | −5.9 | −2.8 | −2.48 | nc |
These changes occurred with the bolus of ethanol at 3 and 12 hours, and after 1 month of chronic ethanol intragastric tube feeding at the peak and trough of the urinary alcohol level (UAL).
For example, the acetaldehyde metabolizing enzymes, Aldhla4 and Aldhla1 were up-regulated at the peak and trough of the alcohol cycle, the peak more than the trough, whereas there were no changes at 3 hours or 12 hours after an acute bolus of alcohol. The Aldh1a4 result was confirmed by PCR (Fig. 3).
Fig. 3.
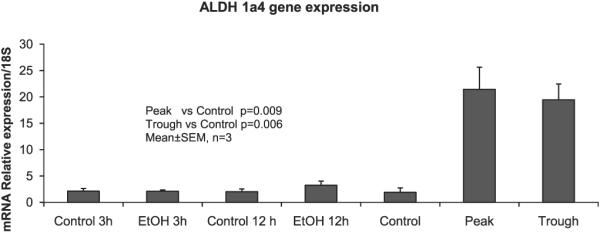
Aldh1a4 gene expression of the acute ethanol feeding experiment was compared with the chronic ethanol feeding experiment by PCR. Note: Only chronic ethanol feeding showed a significant increase (approximately 10-fold increase), both at the peak (P) and the trough (T) (mean ± SEM, n = 3).
Growth factors up-regulated at the peak and trough included Gadd45b, Egr1, Jun, KLF3, and JunD. There were no changes at 3 hours or 12 hours after ethanol bolus. The expression of genes involved in oxidative stress that were up-regulated at the peaks and troughs, included CYP1a1 and NOS, whereas there were no changes in the expression of these genes at 3 hours or 12 hours after alcohol bolus. Gene expression involved in fat metabolism, and up-regulated at the peaks and troughs of the UAL cycle, were PPARγ, RARb, and Fabp5. The expression of these genes was unchanged at 3 and 12 hours after alcohol bolus. Most importantly, genes involved in the epigenetic phenomenon, FOXO1a, Cbp/p300 rtd 2, and Sirt1 were up-regulated at the peak of the alcohol cycle, but were unchanged at 3 and 12 hours after alcohol bolus. Sirt1 and PGC-1a were also up-regulated at the peak ethanol levels (Fig. 4) as assessed by PCR. On the other hand, PPARγ was negatively regulated at the peaks (Fig. 4). None of these changes appeared in the microarray analysis at 3 and 12 hours. Thus, chronic ethanol treatment up-regulates the Sirt1/PGC-1a/PPARγ pathway (Rodgers et al., 2008).
Fig. 4.

Gene expression of Sirt1, PGC-1a, and RARb was up-regulated at peaks of the alcohol level in chronic ethanol fed rats, whereas PPARγ was down-regulated at the peaks. Sirt1 expression was not changed at 3 hours and 12 hours (mean ± SEM, n = 3 to 4).
Proteins involved in the epigenetic phenomenon that were increased at the peaks of the UAL cycle included acetylated histone 3 lysine 9 and HAT (Bardag-Gorce et al., 2007). Acetylation of H3K9 is associated with an increase in gene expression. In contrast there were no changes in acetylation of histone 3 lysine 9 and lysine 18 (Fig. 5) after 3 hours or 12 hours after alcohol bolus. Acetylation of H3K18 was increased after 1 month of ethanol feeding when the BALs were at their peaks (Fig. 5). Acetylation of H3K18 is also associated with an increase in gene expression. The HAT enzyme p300 was not changed after 3 hours or 12 hours after alcohol bolus in the nuclear extracts (Fig. 6). In addition, there was no change in histone deacetylase of histone 3 (HDAC2) (Fig. 7) at 3 hours or 12 hours in the nuclear extracts.
Fig. 5.

Western blot analysis of histone 3 lysine 9 acetylation in liver nuclear extracts after 3 and 12 hours of ethanol bolus. Note there were no significant changes in the liver of ethanol fed rats compared with the controls. The acetylation of histone 3 lysine 18 (H3K18) also showed no change in the acute ethanol fed model. There was a significant increase of H3K18 acetylation at the peaks in the chronic ethanol fed model (mean ± SEM, n = 3 to 4).
Fig. 6.

Western blot analysis of histone acetyltransferase p300 in the liver nuclear extracts after 3 and 12 hours after ethanol bolus. Note there was no significant change in the livers of ethanol fed rats compared with the controls (mean ± SEM, n = 3 to 4).
Fig. 7.

Western blot analysis of histone deacetylase HDAC2 responsible for deacetylating histone 3 lysine 9 in the liver nuclear extracts after 3 and 12 hours after ethanol bolus. Note: There was no significant change in the liver of the ethanol fed rats compared with the controls (mean ± SEM, n = 3 to 4).
Methylation of histones and DNA were investigated. No change was found in dimethyl histone 3 lysine 4 (H3K4me2) in the acute model, whereas the chronic model showed a significant increase at the peaks (Fig. 8) indicating an increase in gene expression activation. Trimethylation of histone 3 lysine 27 also increased significantly after chronic ethanol feeding (Fig. 9) indicating a decrease in gene activation. However, DNA methylation did not show any changes in the chronic ethanol feeding model. In the acute model, DNA methylation decreased in the 12 hours ethanol bolus (Fig. 10).
Fig. 8.

Histone 3 lysine 4 dimethylation analysis. There was a significant increase in H3K4me2 after 1 month of ethanol feeding (mean ± SEM, n = 3 to 4).
Fig. 9.

Histone 3 lysine 27 trimethylation analysis. There was a significant increase in H3K27me3 after 1 month of ethanol feeding (mean ± SEM, n = 3 to 4).
Fig. 10.

Global DNA hypomethylation occurred 12 hours after an ethanol bolus. It did not occur at 3 hours after an ethanol bolus or after 1 month of chronic ethanol feeding (mean ± SEM, n = 3 to 4).
DISCUSSION
Gene expression changes differed quantitatively and qualitatively between the acute and chronic ethanol feeding models studied. It was postulated that the differences were due to chronic ethanol feeding induction of epigenetic cellular memory alterations. To test this hypothesis, histone acetylation and methylation modifications were assessed. The enzymes responsible for these modifications were also assessed. Both acetylation and methylation of histones were up-regulated only in the chronic ethanol feeding model, not in the acute model. Thus, global epigenetic gene regulation changes accounted for the changes observed in gene expression after chronic ethanol feeding when liver pathologic changes were observed. Because of this association, it is postulated that the pathologic changes observed were the result of the epigenetic alterations in gene expression induced by chronic ethanol feeding. Both the pathologic changes and the histone modifications were seen in the chronic model, not in the acute model. Thus, the results reported provide a mechanism that explains the changes in gene expression and liver injury through epigenetic modifications induced by chronic ethanol feeding.
The gene expression changes were increased at 3 hours (488 genes) and 12 hours (586 genes) compared with 1300 genes at 1 month. Table 2 compares some of the gene expression changes in the chronic model compared with the acute model. What is shown is that the genes which changed expression in the chronic model were different from those that changed in the acute model. The main point, however, is that there was no change in histone acetylation or methylation and no change in histone modifying enzymes, such as p300 and HDAC2 in the acute model. These enzymes that were significantly changed in the chronic model were reported in a previous study (Bardag-Gorce et al., 2007).
The response to ethanol at 3 and 12 hours was not associated with a change in histone 3 lysine 9 acetylation (AcH3K9). This change was observed in the chronic model of ethanol feeding (Bardag-Gorce et al., 2007). These results differ from those reported by Kim and Shukla (2006), where an increase was observed in H3K9 acetylation in the liver at 1 and 12 hours after an acute dose of alcohol (6 g/kg). The differences in results might be due to the experimental design. Kim and Shukla (2006) fasted their rats for 6 hours, gave the alcohol at a concentration of 32%, and fed the controls distilled water. In the study reported here, the rats were not fasted, the concentration of ethanol was 20%, and the controls were given isocaloric glucose to control for calories ingested.
REFERENCES
- Bardag-Gorce F, French BA, Dedes J, Li J, French SW. Gene expression patterns of the liver in response to alcohol. In vitro and in vitro models compared. Exp Mol Pathol. 2005;80:241–251. doi: 10.1016/j.yexmp.2005.12.006. [DOI] [PubMed] [Google Scholar]
- Bardag-Gorce F, French BA, Joyce M, Baires M, Montgomery RO, Li J, French S. Histone acetyltransferase p300 modulates gene expression in an epigenetic manner at high blood alcohol levels. Exp Mol Pathol. 2007;82:197–202. doi: 10.1016/j.yexmp.2006.10.006. [DOI] [PMC free article] [PubMed] [Google Scholar]
- Bardag-Gorce F, French BA, Li J, Riley NE, Yuan QX, Valinluck V, Fu P, Ingelman-Sundberg M, Yoon S, French SW. The importance of cycling of blood alcohol levels in the pathogenesis of experimental alcoholic liver disease in rats. Gastroenterology. 2002;123:325–335. doi: 10.1053/gast.2002.34177. [DOI] [PubMed] [Google Scholar]
- Bardag-Gorce F, French BA, Nan L, Song H, Nguyen SK, Yong H, Dedes J, French SW. CYP2E1 induced by ethanol causes oxidative stress, proteasome inhibition and cytokeratin aggresomes (Mallory body-like) formation. Exp Mol Pathol. 2006;81:191–201. doi: 10.1016/j.yexmp.2006.07.007. [DOI] [PubMed] [Google Scholar]
- Bradford MM. A rapid and sensitive method for the quantitation of microgram quantities protein utilizing the principle of protein-dye binding. Anal Biochem. 1976;72:248–254. doi: 10.1016/0003-2697(76)90527-3. [DOI] [PubMed] [Google Scholar]
- French SW. Nutrition in the pathogenesis of alcoholic liver disease. Alcohol Alcohol. 1993b;28:97–109. [PubMed] [Google Scholar]
- French BA, Dedes J, Bardag-Gorce F, Li J, Wilson L, Fu P, Nan L, French SW. Microarray analysis of gene expression in the liver during the urinary ethanol cycle in rats fed ethanol intragastrically at a constant rate. Exp Mol Pathol. 2005;79:87–94. doi: 10.1016/j.yexmp.2005.06.006. [DOI] [PubMed] [Google Scholar]
- French SW, Miyamoto K, Tsukamoto H. Ethanol-induced hepatic fibrosis in the rat-role of the amount of fat. Alcohol Clin Exp Res. 1986;10:513–519. doi: 10.1111/j.1530-0277.1986.tb05175.x. Suppl. [DOI] [PubMed] [Google Scholar]
- French SW, Wong K, Jui L, Albano E, Hagbjork AL, Ingelman M. The effect of ethanol on cytochrome P450 2E1 (CYP2E1), lipid peroxidation, and serum protein adduct formation in relation to liver pathology pathogenesis. Exp Mol Pathol. 1993a;58:61–75. doi: 10.1006/exmp.1993.1006. [DOI] [PubMed] [Google Scholar]
- Kim JS, Shukla SD. Acute in vivo effect of ethanol (binge drinking) on histone H3 modifications in rat tissues. Alcohol. 2006;41:126. doi: 10.1093/alcalc/agh248. [DOI] [PubMed] [Google Scholar]
- Laemmli UK. Cleavage of structural proteins during the assembly of the head of bacteriophage T4. Nature. 1970;227:680–685. doi: 10.1038/227680a0. [DOI] [PubMed] [Google Scholar]
- Li J, French BA, Wu Y, Vankatesh R, Montgomery R, Bardag-Gorce F, Kitto J, French SW. Liver hypoxia and lack of recovery after reperfusion at high blood alcohol levels in the intragastric feeding model of alcoholic liver disease. Exp Mol Pathol. 2004;77:184–192. doi: 10.1016/j.yexmp.2004.08.002. [DOI] [PubMed] [Google Scholar]
- Li J, Nguyen BA, French BA, Parlow AF, Su GL, Fu P, Yuan QX, French SW. Mechanism of the cyclic pattern urinary ethanol levels in rats fed ethanol. The role of the hypothalamic-pituitary-thyroid axis. Am J Physiol Gastroenterol Liver Physiol. 2000;279:G118–G125. doi: 10.1152/ajpgi.2000.279.1.G118. [DOI] [PubMed] [Google Scholar]
- Morimoto M, Haghjork AL, Nanji AA, Ingelman-Sundberg M, Lindros KO, Fu PC, Albano E, French SW. Role of cytochrome P450 2E1 in alcoholic liver disease pathogenesis. Alcohol. 1993;10:459–464. doi: 10.1016/0741-8329(93)90065-v. [DOI] [PubMed] [Google Scholar]
- Rodgers JT, Lerin C, Gerhart-Hines Z, Puigserver P. Metabolic adaptations through the PGC-1 alpha and SIRT1 pathways. FEBS Lett. 2008;582(1):46–53. doi: 10.1016/j.febslet.2007.11.034. [DOI] [PMC free article] [PubMed] [Google Scholar]
- Shukla SD, Velasquez J, French SW, Lu SC, Ticku MK, Zakhari S. Emerging role of epigenetic in the actions of alcohol. Alcohol Clin Exp Res. 2008;32:1–10. doi: 10.1111/j.1530-0277.2008.00729.x. [DOI] [PubMed] [Google Scholar]
- Tsukamoto H, French SW, Reidelberger RD, Largeman C. Cyclic pattern of blood alcohol levels during continuous intragastric ethanol infusion in rats. Alcohol Clin Exp Res. 1985;9:31–37. doi: 10.1111/j.1530-0277.1985.tb05046.x. [DOI] [PubMed] [Google Scholar]
- Umlauf D, Goto Y, Feil R. Site-specific analysis of histone methylation and acetylation. Methods Mol Biol. 2004;287:99–120. doi: 10.1385/1-59259-828-5:099. [DOI] [PubMed] [Google Scholar]