

Abstract
Several mechanisms have been proposed to account for perceptual alterations during binocular rivalry, including neural adaptation and neural noise. However, the importance of neural adaptation for producing perceptual alterations has been challenged in several articles (Y.-J. Kim, Grabowecky, & Suzuki, 2006; Moreno-Bote, Rinzel, & Rubin, 2007). We devised an “online” adaptation procedure to reexamine the role of adaptation in binocular rivalry. Periods of adaptation inserted into rivalry observation periods parametrically alter the dynamics of rivalry such that increased adaptation duration decreases dominance duration, which cannot be accounted for by neural noise. Analysis of the average dominance durations and their variance (coefficient of variation) provides evidence for an increasingly important role of noise in rivalry alternations as a given dominance period continues in time, consistent with recent computational models.
When an observer is faced with ambiguous or conflicting visual information, perception can fluctuate unpredictably over time between alternative interpretations (C.-Y. Kim & Blake, 2005; Leopold & Logothetis, 1999; Sterzer, Kleinschmidt, & Rees, 2009). Called multistable perception, these rival perceptual states can be experienced when an observer views figures with conflicting figure–ground interpretations or displays in which 3-D surface layout is ambiguous, or when the two eyes receive dissimilar monocular stimuli. These various forms of perceptual multistability exhibit comparable dynamics, with distribution of dominance durations associated with a given perceptual state being unimodal and skewed toward longer durations (Klink, van Ee, & van Wezel, 2008; Leopold & Logothetis, 1999; van Ee, 2005). The similarity of their dynamics suggests that those different forms of multistability may arise from comparable, although not necessarily identical, underlying neural events. What might be the nature of those mechanisms?
To answer this question, it is important to distinguish neural events associated with the representation of a given perceptual state from those that are responsible for switches between alternative perceptual states (Blake & Logothetis, 2002; Sterzer et al., 2009). In the present article, we focus on this latter aspect of multistable perception (i.e., the causes of fluctuations in perception during prolonged viewing of conflicting visual stimuli). According to one view (Pettigrew, 2001), a clocklike neural oscillator triggers perceptual alternations of bistable perception. Consistent with this proposal, alternation rates for different forms of perceptual multistability are correlated across individuals (Carter & Pettigrew, 2003; Sheppard & Pettigrew, 2006). According to another view, whose origin dates back to Helmholtz (1867/1962), perceptual fluctuations arise from a high-level process whereby the brain continuously reevaluates sensory information to update perceptual interpretations (Leopold & Logothetis, 1999). There is suggestive evidence that favors this conceptualization as well (see a recent review by Sterzer et al., 2009). It is not obvious, however, how these two alternative accounts of perceptual alternations would explain a wide range of results showing systematic changes in the dynamics of those alternations dependent on sensory visual properties, such as stimulus contrast, spatial frequency, and luminance (Fahle, 1982; Kang, 2009; Levelt, 1965). Indeed, those kinds of stimulus influences are considerably more robust than are influences attributable to nonsensory factors, such as attention (e.g., Lack, 1978; Meng & Tong, 2004), meaning (e.g., Blake, 1988), and affective connotation (e.g., Alpers & Pauli, 2006). Those kinds of robust visual influences are handled more readily by sensory-based models involving interactions among competing neural representations—models of the sort discussed in the next paragraph.
Traditional accounts of multistability are built around the notion of inhibition between pools of neurons representing possible alternative interpretations. According to this idea, activity associated with one neural representation inhibits activity within neurons representing a conflicting interpretation, causing the more active representation to be dominant. On this account, alternations in perception result from neural adaptation of the currently dominant representation and/or from noise (i.e., variability in neural responses within competing pools of neurons). In adaptation-based models, adaptation of the perceptually dominant representation steadily weakens the neural representation of the dominant stimulus, eventually leading to a switch in a balance of activity among competing representations. To account for the irregularity in successive dominance durations, adaptation models also incorporate stochastic variability (i.e., noise) in neural responses (Kalarickal & Marshall, 2000; Laing & Chow, 2002; Lehky, 1988; Wilson, 2003, 2007).
Despite being simple and grounded in plausible neurophysiological processes, models of perceptual alternation based on adaptation can be challenged on two grounds. For one thing, adaptation models predict that durations of perceptual dominance should be reduced when they are preceded by particularly long dominance durations, and this should be revealed by significant correlation between successive dominance durations (Moreno-Bote, Rinzel, & Rubin, 2007). However, a number of studies have failed to confirm this prediction (Fox & Herrmann, 1967; Lehky, 1995; Logothetis, Leopold, & Sheinberg, 1996; but see Gao et al., 2006). For another, those studies that have purported to show an influence of adaptation on rivalry dynamics (Blake & Overton, 1979; Blake, Westendorf, & Fox, 1990; Hollins & Hudnell, 1980; van Boxtel, Alais, & van Ee, 2008; Wade & de Weert, 1986) have used procedures that do not correspond to the actual conditions of rivalry. Specifically, in all these studies, a single extended period of monocular adaptation preceded tracking periods of binocular rivalry, with the duration of adaptation being considerably longer (from 10 to 60 sec) than the average dominance durations (2–3 sec). This procedure probably produces saturated adaptation, making it difficult to generalize to the relatively brief periods of adaptation presumably contributing to rivalry alternations.
In the present article, we confront these two challenges by reexamining the influence of adaptation on binocular rivalry dynamics using a novel “online” adaptation procedure. With this procedure, we parametrically manipulate the adaptation duration within a range of values comparable to the dominance durations of binocular rivalry, and we do this during actual periods of binocular rivalry. If adaptation plays a role in promoting rivalry alternations, the dominance durations after online adaptation should decrease systematically with increases in adaptation duration. Moreover, results from those measurements of rivalry dynamics during online adaptation allow us to analyze results in a manner that possibly explains the lack of correlation between successive dominance durations on the basis of intrinsic noise of the sort proposed in several recent articles (Lankheet, 2006; Moreno-Bote et al., 2007; Noest, van Ee, Nijs, & van Wezel, 2007).
The Present Experiment
To examine the influence of adaptation on the alternations occurring during binocular rivalry, we had observers track changes in rivalry dominance between two rival gratings viewed for an extended tracking period during which brief periods of monocular adaptation were interspersed. Figure 1 schematically illustrates one episode of monocular adaptation during a rivalry-tracking sequence. Here, we created these periods of monocular adaptation by physically removing one of the rival gratings at the moment it became suppressed (i.e., at the moment that the other grating achieved dominance) and reintroducing that suppressed grating after a short period in order to reinstate the conditions for rivalry. The measure of interest was the duration of dominance of the grating that remained present throughout this sequence of events (i.e., the currently dominant stimulus).
Figure 1.

Schematic of stimuli and trial sequence for the online-adaptation experiment. The upper timeline (labeled “percept”) illustrates which of two gratings is perceptually dominant, and the lower two lines illustrate the physical stimuli presented to the two eyes. The sequence consists of a series of epochs. An adaptation epoch begins when the observer presses a given key, signifying that one eye's rival target had just achieved dominance (indicated by a left-hand vertical line in the percept timeline). At this moment, the other eye's rival stimulus is removed from that unadapted eye for a given duration (33%, 66%, or 100% of the average dominance duration) and then reintroduced. The dominance duration is defined as the time interval from the reintroduction of that previously removed stimulus until the dominant grating experienced during that adaptation duration is no longer dominant (indicated by a right-hand vertical line in the percept timeline).
To implement this procedure successfully, we had to overcome one technical difficulty associated with the removal and reintroduction of the suppressed grating. It is well established that binocular rivalry may be disrupted when the suppressed pattern changes abruptly, probably because of visual transients (Blake et al., 1990; Walker & Powell, 1979). This is particularly true when presentation of rival stimuli is followed by prior monocular adaptation (Wolfe, 1984). To reduce visual transients associated with removal and reintroduction of the suppressed grating, we tested online adaptation using three different rival stimulus sequences, all of which have been shown in previous rivalry studies to mask transients; these sequences are illustrated in Figure 2. In the on/off flicker sequence (Figure 2A), the rival stimuli were flickered on and off at 15 Hz, a stimulus manipulation that should mask any transients associated with reintroduction of the rival stimulus (Logothetis et al., 1996). In the on/off composite sequence (Figure 2B), the composite configuration created by superimposing both rival stimuli was presented dioptically during the off period of the flicker sequence, also manipulation that minimizes the effects of transients (Kang & Blake, 2008). In the counterphase sequence (Figure 2C), two identical gratings drifting in opposite directions were superimposed, thus creating 10-Hz counterphase flicker (Levinson & Sekuler, 1975). Unlike the on/off composite sequences, counterphase flicker effectively precludes local light adaptation because the spatial phase of the flickering grating changes smoothly and continuously over time from 0° to 360°. In all three stimulus conditions, the temporal phase of both rival stimuli was the same—both rival stimuli were synchronously turned on and off for the flicker and composite sequences, and the contrast levels and spatial phase were synchronously changed for the counterphase sequence. The stimulus that remained present during the brief periods of monocular adaptation was always the same stimulus as the one being viewed by that eye during the rivalry portion of the trial, and the reintroduction of the rival target to the unadapted eye was always synchronized to the on phase, or to the peak contrast phase of the flicker sequence of the grating, in the adapted eye.
Figure 2.
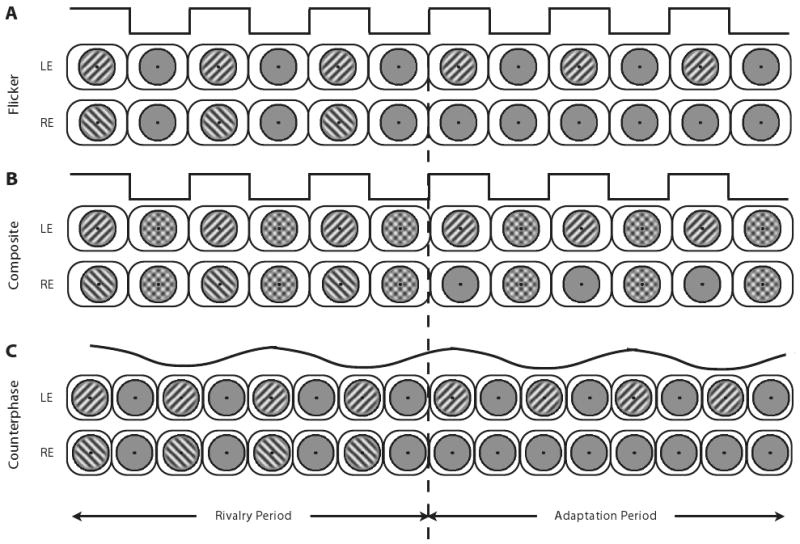
Schematic illustration of the three stimulus sequences in which a period of rivalry is followed by a period of adaptation: flicker sequence (A), composite sequence (B), and counterphase sequence (C). At the top of each schematic is a timeline (black line) denoting the periodic change in contrast level of the stimuli during the rivalry and adaptation portions of a trial (dotted vertical line denotes transition from rivalry to adaptation). For flicker and composite sequences, stimuli change contrast abruptly (square wave); for counterphase sequence, stimuli change contrast smoothly over time (sinusoidal in which the spatial phases of both rival stimuli change continuously, thereby ensuring that local light adaptation is uniform over time). LE, left eye; RE, right eye.
The prediction following from this online-adaptation technique is simple: If neural adaptation of the dominant stimulus causes perceptual switches, the dominance durations of that grating should decrease systematically with increasing adaptation duration after introduction of the previously suppressed grating. The experiments reported here confirm that prediction.
Method
Participants
Seven observers (5 male, 2 female; mean age, ∼28 years), including the first author (M.-S.K.), were tested in the flicker and composite sequence conditions. Four observers (2 male, 2 female; mean age, ∼31 years), including M.-S.K., were tested in the counterphase sequence condition. Except for M.-S.K., observers were naive to the purpose of the study. All had normal or corrected-to-normal vision, and all gave informed consent after thorough explanation of the procedures. All aspects of this study were approved by the Vanderbilt University Institutional Review Board.
Apparatus
A Macintosh G4 computer running OS 9.2.2 was used to control the experiment. Stimuli were generated using the Psychophysics Toolbox (Brainard, 1997; Pelli, 1997) in conjunction with MATLAB (The MathWorks, Natick, MA). Stimuli were presented on the screen of a Sony E540 21-in. monitor (1,024 × 768 pixel resolution; 120-Hz frame rate) in a dimly illuminated room. The luminance level of the monitor was linearized, using a gamma-corrected lookup table. In all experiments, the stimuli were viewed on a gray background (21.67 cd/m2) through a mirror stereoscope placed 90 cm from the monitor.
Procedure
Rival stimuli were circularly windowed, right- and left-tilted gratings whose diameters were 1.8° in visual angle. The boundaries of both rival gratings were smoothed using a Gaussian filter whose σ equaled 3 pixels. The contrast of the rival gratings was 20%, and their spatial frequency was 3 cpd. To promote stable binocular alignment of the two eyes, a black circular border (diameter 1.9°, width 0.2°) framed each rival grating. In addition, a circular fixation spot (∼0.2°) was presented at the center of rival stimuli. The composite configuration was created by adding the two rival gratings, with the contrast of each component set at 10%, so that the contrast of the composite stimulus equaled 20%. Temporal modulation rate for both the flicker and composite sequences was 15 Hz (square-wave modulation). The counterphase sequence was created by combining two otherwise identical gratings drifting in opposite directions (Levinson & Sekuler, 1975). The contrast of each grating was 10%, and both drifted at 10 Hz, thus creating sinusoidal modulation of contrast and phase over time. During adaptation periods interspersed within rivalry using either on/off or counterphase flicker, the unadapted eye viewed only the fixation mark and circular boundary frame (Figures 2A and 2C); when adaptation was interspersed within rivalry using the composite configuration, the composite grating was presented to both eyes during adaptation (Figure 2B).
The present experiment involved testing three adaptation durations for each of the three conditions of rival stimulation. Because rivalry alternation rate and, hence, average dominance durations vary among observers (Carter & Pettigrew, 2003), we first had to measure average dominance durations for each participant, to determine the specific adaptation durations to be used for that individual. So, for each of the three stimulus sequences, we collected rivalry-tracking data uninterrupted by monocular adaptation, and, from those records, we computed three adaptation durations to be used in the main experiments: durations that were 33%, 66%, and 100% of the average dominance duration for a given observer and condition.
After those durations had been determined, we administered a series of rivalry-tracking trials that included online adaptation. Each trial lasted until a prescribed number of adaptation epochs (described below) had been introduced; actual trial durations varied among observers and across trials. As is illustrated in Figure 1, an adaptation epoch was defined as the time from the onset of a period of monocular adaptation until the end of the dominance state of the rival grating viewed by the eye undergoing monocular adaptation (i.e., until a switch in dominance to the previously suppressed grating). It is important to keep in mind that the dominance duration associated with an adaptation epoch was defined as starting from the reintroduction of the suppressed pattern and lasting until termination of dominance of the grating experienced during adaptation. Within each tracking session, each adaptation epoch (33%, 66%, and 100%) was randomly repeated 3 times. Note also that both rival stimuli always remained present continuously for one or two perceptual alternations between any successive adaptation epochs. By including these no-adaptation epochs, we were able to randomize the eye receiving online adaptation and to measure dominance durations associated with rivalry, uninterrupted by adaptation. The flicker and composite sequences were repeated 4 times, so that 12 dominance durations were obtained for the following three relative adaptation durations (33%, 66%, and 100%). The counterphase sequence was repeated 16 times, so that 48 dominance durations were obtained for those three relative adaptation durations.
From an observer's standpoint, the task was simple: to track the alternations in perception by pressing and holding one key to indicate a grating that tilted left and another to indicate a grating that tilted right. When experiencing mixed dominance, the observer pressed neither key.
Results
The three columns of graphs in Figure 3 show the results from the three stimulus sequences (flicker, composite, and counterphase). Figures 3A–3C show the dominance durations averaged across observers as a function of relative adaptation duration. For all three stimulus sequences, the mean dominance durations decreased monotonically. A one-way ANOVA, with the factor of relative adaptation duration, yielded a significant main effect of adaptation for all three stimulus sequences [flicker sequence, F(1,6) = 92.86, p < .001; composite sequence, F(1,6) = 73.22, p < .001; counterphase sequence, F(1,3) = 435, p < .001]. To show the robustness of this result, each observer's mean dominance durations are drawn in the middle three panels as a function of actual adaptation duration (Figures 3D–3F). For all observers, the dominance durations tended to decrease with increasing adaptation duration. This consistent finding is all the more remarkable considering the relatively small number of measurements contributing to each data point in these graphs. Note, too, that the consistent trend for dominance duration to decrease with adaptation duration would not be observed if abrupt reintroduction of the previously suppressed rival target were solely responsible for those durations.
Figure 3.

Dominance durations measured under each of the three stimulus sequences: flicker, composite, and counterphase. Panels A–C: Dominance durations averaged across observers, plotted as a function of relative adaptation duration. Error bars represent ±1 SE. Panels E–F: Dominance durations of individual observers, plotted as a function of actual durations of online adaptation. Each symbol represents data from different observers. Panels G–I: Distribution of normalized dominance durations for four relative adaptation durations (solid black for 0%, dotted black for 33%, solid gray for 66%, and dotted gray for 100% adaptation level). Note that the number of dominance durations measured to obtain the data points for the counterphase sequence (panels C, F, and I) is four times larger than the number of durations associated with the flicker and composite sequences.
The frequency histograms of dominance durations in Figures 3G–3I also reflect the decrease in dominance durations with increasing adaptation duration. Figures 3G–3I show distributions of normalized dominance durations from the three stimulus sequences, respectively. We normalized the dominance durations by dividing dominance durations of each observer by the individual's mean dominance duration associated with no adaptation; and we pooled all measurements across observers, because the number of measurements at each relative adaptation duration is too small to produce meaningful histograms. As is evident in the figures, the distribution of dominance durations becomes narrower, and its peak is shifted leftward, with increasing relative dominance duration. There were, as expected, some epochs that produced very brief dominance durations (left-hand tails of these distributions). Some of those brief durations could have been caused by the reintroduction of the previously suppressed target. We could not distinguish such trials from ones in which the dominance durations were inherently brief, so we did not selectively remove any dominance measures from our analysis.
Discussion
Adaptation-based models of bistability have been challenged (Brascamp, van Ee, Noest, Jacobs, & van den Berg, 2006; Y.-J. Kim, Grabowecky, & Suzuki, 2006; Moreno-Bote et al., 2007) for two reasons: (1) the likely saturation in adaptation level associated with previous studies involving adaptation followed by rivalry and (2) the absence of correlation among successive dominance durations. Results from the present study using online adaptation overcome the first concern by showing that reductions in dominance durations are proportional to the duration of adaptation comparable to that occurring during actual rival stimulation. This finding, together with earlier results showing that rivalry dominance durations are significantly lengthened under stimulus conditions that minimize neural adaptation (Blake, Sobel, & Gilroy, 2003), solidifies the argument that neural adaptation is involved in the production of switches in perceptual state during rivalry. Still, this leaves unresolved the puzzle of why, contrary to purely adaptation-based models, successive durations of dominance are uncorrelated. In the following paragraphs, we discuss the implications of our results for the resolution of this puzzle, and we begin that discussion by introducing an alternative account of rivalry alternations on the basis of intrinsic noise alone.
It has been proposed that noise alone, without neural adaptation, can account for perceptual alternations and for the randomness of individual dominance durations (Moreno-Bote et al., 2007). According to this idea, competing perceptual states comprise alternative, semistable states within a dynamical system in which noise can trigger switches between states. This noise could be intrinsic (e.g., variability in neural spiking) or extrinsic (e.g., random fluctuations in signal strength). This noise-driven attractor model, as it is called, can be formulated in ways that produce several key dynamical properties of binocular rivalry without recourse to neural adaptation (Moreno-Bote et al., 2007). As well, there is empirical evidence for the involvement of noise in the production of transitions in perceptual state during rivalry (Brascamp et al., 2006; Y.-J. Kim et al., 2006; Lankheet, 2006). The results presented in the present article, however, are difficult to explain on the basis of noise alone. Brief periods of monocular adaptation inserted within the rivalry sequence should not abbreviate subsequent dominance durations if those durations are determined by noise alone. Of course, one could argue that adaptation has influenced intrinsic noise, but, in fact, any such influence would likely suppress noise and, therefore, lengthen subsequent durations of dominance. In any event, there is psychophysical evidence that adaptation has no influence on additive or multiplicative noise and operates only to reduce contrast gain (Dao, Lu, & Dosher, 2006).
This is not to say, however, that noise plays no role in rivalry alternations. Indeed, noise may be an essential ingredient to account fully for the dynamics of rivalry (Shpiro, Moreno-Bote, Rubin, & Rinzel, 2009): As discussed earlier, neural adaptation without noise should produce fairly regular perceptual alternations. On the other hand, alternations on the basis of noise alone should produce exponentially distributed dominance durations. Shpiro et al. have shown that these predicted characteristics can be indexed by the coefficient of variation (CV), defined as the ratio between standard deviation and mean of dominance durations. The CV approaches zero if the durations of dominance are governed almost entirely by neural adaptation, because the standard deviation of those dominance durations should be very small; but, the CV should be approximately 1.0 when it is noise that primarily governs alternations, because, with the exponential distribution, the mean and standard deviation are equal. Previous studies have shown that CV is approximately 0.5 for dominance durations measured during extended periods of binocular rivalry (Levelt, 1965), suggesting that rivalry dynamics are determined jointly by adaptation and noise. The data collected with our online-adaptation procedure offer the unique opportunity to evaluate CV as a function of adaptation duration. If noise is indeed involved in rivalry alternations, CV should approach 1.0 as online-adaptation duration increases.
Figure 4 shows values of CV as a function of relative adaptation duration. Because all results obtained from three stimulus sequences are similar, as shown in Figure 3, we compiled data across the three stimulus sequences: CVs at each relative adaptation duration were averaged across two or three stimulus sequences for each observer, so that a single CV measure at each relative adaptation duration was obtained individually. Consistent with previous studies, CV is approximately 0.5 without adaptation (Levelt, 1965) and increases monotonically, being close to 1 at 100% relative adaptation duration. This approximately twofold increase in CV was statistically significant [F(1,8) = 6.21, p < .05].
Figure 4.

Result of coefficient of variation (CV) analysis. CV (standard deviation of the sample of dominance durations divided by mean dominance duration for that sample) is plotted as a function of relative adaptation duration. Each observer's data were pooled across the three stimulus sequences. The vertical lines associated with each symbol denote ±1 SE.
So, this additional analysis suggests how adaptation interacts with noise in the production of perceptual alternations in binocular rivalry, in a manner consistent with the mechanisms proposed by recent computational studies (Moreno-Bote et al., 2007; Shpiro et al., 2009). Specifically, when a given stimulus initially achieves dominance, its associated activity level is high relative to the activity level associated with the suppressed stimulus. Both of those activity levels also contain random fluctuations due to neural noise. Without adaptation, however, those noise fluctuations very rarely would cause the activity level of the currently suppressed stimulus to exceed that of the currently dominant stimulus. On the basis of noise alone, in other words, the dominant stimulus should remain dominant indefinitely. With adaptation, however, the activity level of the dominant stimulus wanes with time, thus increasing the likelihood that noise-driven fluctuations will reverse the relative strengths of the two activity levels and, therefore, trigger a perceptual state change. Operating together, these two mechanisms—adaptation and noise—culminate in the skewed, unimodal distribution of dominance durations that is characteristic of bistable perception (Moreno-Bote et al., 2007; Shpiro et al., 2009). Importantly, the CV analysis applied to our results implies that perceptual alternations whose associated dominance durations are longer than the mean dominance duration are largely governed by noise. It is not surprising, therefore, that the correlation between successive dominance durations is so low (Fox & Herrmann, 1967).
As a final note, this adaptation-plus-noise account makes no assumptions about the level within the visual hierarchy at which rivalry transpires, an issue recently debated (e.g., Alais & Parker, 2006). All that is required is that neural representations of the competing stimuli exhibit stochastic variability and undergo neural adaptation. We have used gratings in our experiments and expect that the same pattern of results would be obtained for more complex rival targets, such as houses and faces. For that matter, this adaptation-plus-noise account leaves open the possibility of top-down influences on rivalry dynamics, including influences based on attention, expectation, or semantics (Leopold & Logothetis, 1999; Sterzer et al., 2009). If multistable perception is indeed the culmination of low-level sensory events interacting with high-level cognitive and affective processes (see, e.g., Tong, Meng, & Blake, 2006), then neural events throughout the visual hierarchy could interact to affect the strength of the neural representation of a given stimulus. And because the strength of that neural representation can modify the rate and level of neural adaptation associated with that representation, the stimulus may be aided by top-down factors when it is having to compete for perceptual dominance.
Conclusion
The present results provide strong evidence that adaptation is involved in the production of binocular rivalry alternations, thereby questioning the validity of models based on noise alone. At the same time, our results point to the involvement of noise in the alternation process and imply that the effective contributions of adaptation and of noise are differentially distributed over time as predicted by a recent computational model (Shpiro et al., 2009).
Acknowledgments
The present study is supported by NIH Grants EY13358, EY016752, and P30 EY08126.
Contributor Information
Min-Suk Kang, Vanderbilt University, Nashville, Tennessee.
Randolph Blake, Vanderbilt University, Nashville, Tennessee and Seoul National University, Seoul, Korea.
References
- Alais D, Parker A. Independent binocular rivalry processes for motion and form. Neuron. 2006;52:911–920. doi: 10.1016/j.neuron.2006.10.027. [DOI] [PubMed] [Google Scholar]
- Alpers GW, Pauli P. Emotional pictures predominate in binocular rivalry. Cognition & Emotion. 2006;20:596–607. doi: 10.1080/02699930500282249. [DOI] [Google Scholar]
- Blake R. Dichoptic reading: The role of meaning in binocular rivalry. Perception & Psychophysics. 1988;44:133–141. doi: 10.3758/bf03208705. [DOI] [PubMed] [Google Scholar]
- Blake R, Logothetis NK. Visual competition. Nature Reviews Neuroscience. 2002;3:13–21. doi: 10.1038/nrn701. [DOI] [PubMed] [Google Scholar]
- Blake R, Overton R. The site of binocular rivalry suppression. Perception. 1979;8:143–152. doi: 10.1068/p080143. [DOI] [PubMed] [Google Scholar]
- Blake R, Sobel K, Gilroy L. Visual motion retards alternations between conflicting perceptual interpretations. Neuron. 2003;39:869–878. doi: 10.1016/S0896-6273(03)00495-1. [DOI] [PubMed] [Google Scholar]
- Blake R, Westendorf D, Fox R. Temporal perturbations of binocular rivalry. Perception & Psychophysics. 1990;48:593–602. doi: 10.3758/bf03211605. [DOI] [PubMed] [Google Scholar]
- Brainard D. The Psychophysics Toolbox. Spatial Vision. 1997;10:433–436. doi: 10.1163/156856897X00357. [DOI] [PubMed] [Google Scholar]
- Brascamp J, van Ee R, Noest AJ, Jacobs RHAH, van den Berg AV. The time course of binocular rivalry reveals a fundamental role of noise. Journal of Vision. 2006;6:1244–1256. doi: 10.1167/6.11.8. [DOI] [PubMed] [Google Scholar]
- Carter O, Pettigrew J. A common oscillator for perceptual rivalries? Perception. 2003;32:295–305. doi: 10.1068/p3472. [DOI] [PubMed] [Google Scholar]
- Dao DY, Lu ZL, Dosher BA. Adaptation to sine-wave gratings selectively reduces the contrast gain of the adapted stimuli. Journal of Vision. 2006;6:739–759. doi: 10.1167/6.7.6. [DOI] [PubMed] [Google Scholar]
- Fahle M. Binocular rivalry: Suppression depends on orientation and spatial frequency. Vision Research. 1982;22:787–800. doi: 10.1016/0042-6989(82)90010-4. [DOI] [PubMed] [Google Scholar]
- Fox R, Herrmann J. Stochastic properties of binocular rivalry alternations. Perception & Psychophysics. 1967;2:432–436. [Google Scholar]
- Gao JB, Billock VA, Merk I, Tung WW, White KD, Harris JG, Roychowdhury VP. Inertia and memory in ambiguous visual perception. Cognitive Processing. 2006;7:105–112. 0030–5. doi: 10.1007/s10339-006-0030-5. [DOI] [PubMed] [Google Scholar]
- von Helmholtz H. In: Treatise on physiological optics. Southall JPC, translator and editor. New York: Dover; 1962. Original work published 1867. [Google Scholar]
- Hollins M, Hudnell K. Adaptation of the binocular rivalry mechanism. Investigative Ophthalmology & Visual Science. 1980;19:1117–1120. [PubMed] [Google Scholar]
- Kalarickal GJ, Marshall JA. Neural model of temporal and stochastic properties of binocular rivalry. Neurocomputing. 2000;32-33:843–853. [Google Scholar]
- Kang MS. Size matters: A study of binocular rivalry dynamics. Journal of Vision. 2009;9:1–11. doi: 10.1167/9.1.17. [DOI] [PMC free article] [PubMed] [Google Scholar]
- Kang MS, Blake R. Enhancement of bistable perception associated with visual stimulus rivalry. Psychonomic Bulletin & Review. 2008;15:586–591. doi: 10.3758/PBR.15.3.586. [DOI] [PMC free article] [PubMed] [Google Scholar]
- Kim CY, Blake R. Psychophysical magic: Rendering the visible “invisible”. Trends in Cognitive Sciences. 2005;9:381–388. doi: 10.1016/j.tics.2005.06.012. [DOI] [PubMed] [Google Scholar]
- Kim YJ, Grabowecky M, Suzuki S. Stochastic resonance in binocular rivalry. Vision Research. 2006;46:392–406. doi: 10.1016/j.visres.2005.08.009. [DOI] [PubMed] [Google Scholar]
- Klink PC, van Ee R, van Wezel RJA. General validity of Levelt's propositions reveals common computational mechanisms for visual rivalry. PLoS ONE. 2008;3:e3473. doi: 10.1371/journal.pone.0003473. [DOI] [PMC free article] [PubMed] [Google Scholar]
- Lack LC. Selective attention in the control of binocular rivalry. The Hague: Mouton; 1978. [Google Scholar]
- Laing CR, Chow CC. A spiking neuron model for binocular rivalry. Journal of Computational Neuroscience. 2002;12:39–53. doi: 10.1023/A:1014942129705. [DOI] [PubMed] [Google Scholar]
- Lankheet MJM. Unraveling adaptation and mutual inhibition in perceptual rivalry. Journal of Vision. 2006;6:304–310. doi: 10.1167/6.4.1. [DOI] [PubMed] [Google Scholar]
- Lehky SR. An astable multivibrator model of binocular rivalry. Perception. 1988;17:215–228. doi: 10.1068/p170215. [DOI] [PubMed] [Google Scholar]
- Lehky SR. Binocular rivalry is not chaotic. Proceedings of the Royal Society of London B. 1995;259:71–76. doi: 10.1098/rspb.1995.0011. [DOI] [PubMed] [Google Scholar]
- Leopold DA, Logothetis NK. Multistable phenomena: Changing views in perception. Trends in Cognitive Sciences. 1999;3:254–264. doi: 10.1016/S1364-6613(99)01332-7. [DOI] [PubMed] [Google Scholar]
- Levelt W. On binocular rivalry. Soesterberg, The Netherlands: RVO–TNO, Institute for Perception; 1965. [Google Scholar]
- Levinson E, Sekuler R. The independence of channels in human vision selective for direction of movement. Journal of Physiology. 1975;250:347–366. doi: 10.1113/jphysiol.1975.sp011058. [DOI] [PMC free article] [PubMed] [Google Scholar]
- Logothetis NK, Leopold DA, Sheinberg DL. What is rivalling during binocular rivalry? Nature. 1996;380:621–624. doi: 10.1038/380621a0. [DOI] [PubMed] [Google Scholar]
- Meng M, Tong F. Can attention selectively bias bistable perception? Differences between binocular rivalry and ambiguous figures. Journal of Vision. 2004;4:539–551. doi: 10.1167/4.7.2. [DOI] [PMC free article] [PubMed] [Google Scholar]
- Moreno-Bote R, Rinzel J, Rubin N. Noise-induced alternations in an attractor network model of perceptual bistability. Journal of Neurophysiology. 2007;98:1125–1139. doi: 10.1152/jn.00116.2007. [DOI] [PMC free article] [PubMed] [Google Scholar]
- Noest AJ, van Ee R, Nijs MM, van Wezel RJA. Percept-choice sequences driven by interrupted ambiguous stimuli: A low-level neural model. Journal of Vision. 2007;7:1–14. doi: 10.1167/7.8.10. [DOI] [PubMed] [Google Scholar]
- Pelli DG. The VideoToolbox software for visual psychophysics: Transforming numbers into movies. Spatial Vision. 1997;10:437–442. doi: 10.1163/156856897X00366. [DOI] [PubMed] [Google Scholar]
- Pettigrew JD. Searching for the switch: Neural bases for perceptual rivalry alternations. Brain & Mind. 2001;2:85–118. [Google Scholar]
- Sheppard BM, Pettigrew JD. Plaid motion rivalry: Correlates with binocular rivalry and positive mood state. Perception. 2006;35:157–169. doi: 10.1068/p5395. [DOI] [PubMed] [Google Scholar]
- Shpiro A, Moreno-Bote R, Rubin N, Rinzel J. Balance between noise and adaptation in competition models of perceptual bistability. Journal of Computational Neuroscience. 2009;27:37–54. doi: 10.1007/s10827-008-0125-3. [DOI] [PMC free article] [PubMed] [Google Scholar]
- Sterzer P, Kleinschmidt A, Rees G. The neural bases of multistable perception. Trends in Cognitive Sciences. 2009;13:310–318. doi: 10.1016/j.tics.2009.04.006. [DOI] [PubMed] [Google Scholar]
- Tong F, Meng M, Blake R. Neural bases of binocular rivalry. Trends in Cognitive Sciences. 2006;10:502–511. doi: 10.1016/j.tics.2006.09.003. [DOI] [PubMed] [Google Scholar]
- van Boxtel JJA, Alais D, van Ee R. Retinotopic and non-retinotopic stimulus encoding in binocular rivalry and the involvement of feedback. Journal of Vision. 2008;8:1–10. doi: 10.1167/8.5.17. [DOI] [PubMed] [Google Scholar]
- van Ee R. Dynamics of perceptual bi-stability for stereoscopic slant rivalry and a comparison with grating, house-face, and Necker cube rivalry. Vision Research. 2005;45:29–40. doi: 10.1016/j.visres.2004.07.039. [DOI] [PubMed] [Google Scholar]
- Wade NJ, de Weert CM. Aftereffects in binocular rivalry. Perception. 1986;15:419–434. doi: 10.1068/p150419. [DOI] [PubMed] [Google Scholar]
- Walker P, Powell DJ. The sensitivity of binocular rivalry to changes in the nondominant stimulus. Vision Research. 1979;19:247–249. doi: 10.1016/0042-6989(79)90169-X. [DOI] [PubMed] [Google Scholar]
- Wilson HR. Computational evidence for a rivalry hierarchy in vision. Proceedings of the National Academy of Sciences. 2003;100:14499–14503. doi: 10.1073/pnas.2333622100. [DOI] [PMC free article] [PubMed] [Google Scholar]
- Wilson HR. Minimal physiological conditions for binocular rivalry and rivalry memory. Vision Research. 2007;47:2741–2750. doi: 10.1016/j.visres.2007.07.007. [DOI] [PubMed] [Google Scholar]
- Wolfe JM. Reversing ocular dominance and suppression in a single flash. Vision Research. 1984;24:471–478. doi: 10.1016/0042-6989(84)90044-0. [DOI] [PubMed] [Google Scholar]