Abstract
Plasmon-resonant gold nanorods (GNRs) can serve as imaging agents for spectroscopic optical coherence tomography (SOCT). The aspect ratio of the GNRs are adjusted for maximum absorption in the far red to create a partial spectral overlap with the low-wavelength edge of the near-infrared SOCT imaging band. The spectroscopic absorption profile of the GNRs is incorporated into a depth-resolved algorithm for mapping the relative GNR density within OCT images. This technique enables us to image GNR distributions in excised human breast carcinomas, demonstrating their potential as OCT contrast agents in heteregeneous, highly scattering tissues.
1. Introduction
Optical coherence tomography (OCT) is an emerging biomedical imaging modality, using near-infrared (NIR) light to provide noninvasive, real-time imaging in tissues up to a few millimeters in depth and with microscopic resolution.1 This unique length scale, coupled with the portability of fiber optics, has enabled diagnostic advances with OCT imaging in clinical ophthalmology, gastroenterology, cardiology, and oncology. However, OCT is a coherence imaging technology and cannot be used to detect fluorescent or bioluminescent probes, which emit incoherent light.2 Instead, OCT must rely on variations in optical scattering and absorption. The development of OCT probes that can enhance local optical contrast would greatly advance the utility of this technique for diagnostic or molecular imaging.
OCT operates on the principle of optical depth-ranging, performed by interferometric detection of coherently backscattered light within the tissue sample. The OCT axial imaging resolution is dictated by the coherence length of the light source, which is inversely proportional to the spectral bandwidth. Using a high-bandwidth light source improves spatial resolution and also enables a spectroscopic mode of image analysis based on wavelength-dependent backscattering or absorption within the tissue, known as spectroscopic OCT (SOCT).3 The Fourier relationship between the spectral and spatial signals in SOCT results in a tradeoff between spectral and spatial resolutions, but this can be tailored to fit the particular application.
SOCT provides spectroscopic information on both the scattered light measured directly by OCT,4 and the absorbed light via analysis of the depth-attenuated OCT signal.5,6 In particular, agents with a sharp absorption peak on one edge of the OCT imaging band provide a spectroscopic signature which departs from the host tissue, providing SOCT contrast.7,8 These distinctive spectral features are important because the OCT signal is also attenuated by wavelength-dependent forward light scattering not collected by the imaging system. However, new signal processing algorithms have been developed to account for the endogenous tissue response by imaging the samples a priori to the introduction of exogenous contrast agents, thereby increasing the overall specificity of SOCT.9
Two types of SOCT contrast agents have been considered for their strong optical absorption at visible and NIR wavelengths: organic chromophores and plasmon-resonant gold nanoparticles. Organic dyes such as the FDA-approved indocyanine green have been employed as SOCT contrast agents, but their chemical and optical stabilities raise some practical concerns.7,8 Gold nanoparticles are chemically and physically robust, are well known for their biocompatibility, and are often used as an adjuvant in several clinical therapies. In addition, their plasmon resonances can be engineered as a function of size or shape to absorb in the wavelength region of interest. NIR-resonant gold nanoparticles have been previously investigated as OCT contrast agents, including nanoshells,10 nanocages,11 and nanorods.12 In particular, SOCT contrast has been demonstrated using gold nanocages in tissue phantoms.13 However, SOCT contrast with exogenous probes has not yet been achieved in biological tissue samples, whose structural complexity raises a greater challenge for detection. The ability to generate contrast in heterogenous tissue samples is an obvious requisite for clinical SOCT applications.
In this work we take the first step toward SOCT imaging of exogenous contrast agents in human tissues using plasmon-resonant gold nanorods (GNRs), whose absorption can be tuned to NIR frequencies as a function of aspect ratio.14,15 In this study, GNRs have been tuned to the short wavelength edge of the SOCT imaging band. GNRs are excellent candidates as SOCT contrast agents because the quality (Q factor) of their NIR resonance is higher than that of most other nanostructures including spherical gold nanoparticles.16 Previously, SOCT contrast by GNRs was demonstrated in liquid tissue phantoms using an algorithm that computed the depth-averaged (but not depth-resolved) spectral shift arising from GNRs.17 In this work, the utility of GNRs for SOCT contrast in human tissue specimens is realized by using recently developed spectroscopic algorithms customized for optimal detection and depth-resolved imaging of GNRs.9 The SOCT data can be integrated with standard B-mode (i.e. 2D axial-transverse) structural OCT images to produce distribution maps of GNRs within the tumor specimen.
2. Experimental
2.1 Preparation and characterization of gold nanorods
An optically dense suspension of GNRs was synthesized using seeded growth conditions,18–20 followed by a mild treatment with sodium sulfide to quench further growth,21 then centrifuged, redispersed, and washed with chloroform to remove excess surfactant. GNRs were characterized by transmission electron microscopy (TEM) and found to be under 50 nm with an aspect ratio of 3 (Fig. 1). The size of these GNRs make them amenable to extravasation or permeation into diseased tissues. Furthermore, the small particle volumes ensure that their optical resonances are dominated by absorption instead of scattering (see below). The large absorption cross sections of GNRs have biomedical potential for photothermal therapy, in which light is used to selectively heat nanorod-labeled cells and tissues.22–24
Fig. 1.
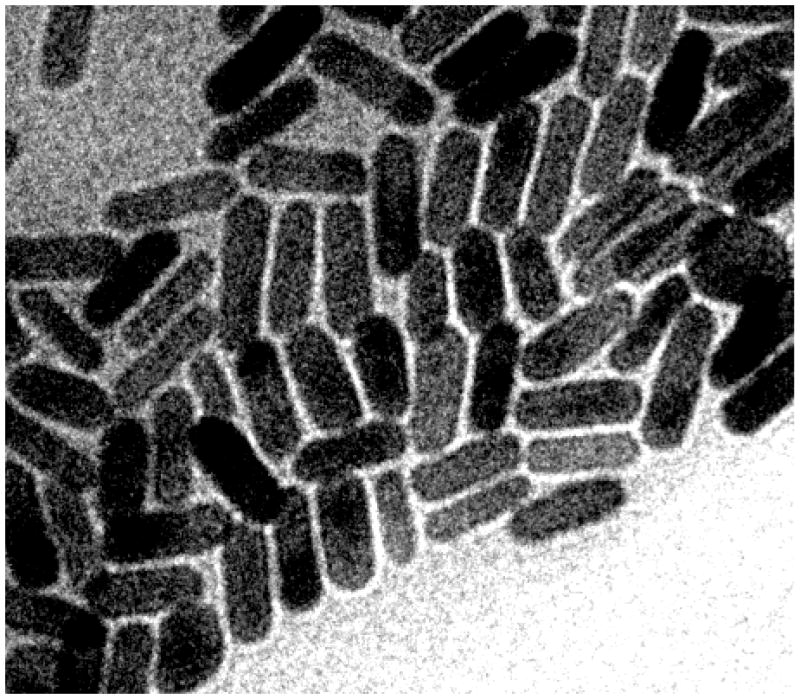
TEM image (Philips CM-200, 120 keV) of GNRs, ca. 15 × 45 nm. Image dimensions: 250 nm × 200 nm.
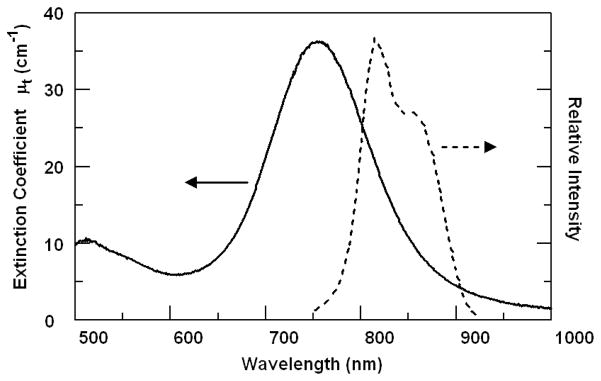
The GNR extinction spectrum exhibits a plasmon resonance peak at 755 nm, with an extinction coefficient (μt) of 36 cm−1 (Fig. 2). The plasmon peak was designed to overlap with the blue edge of the OCT imaging spectral band to provide a steep wavelength-dependent response. Previous measurements using integrating spheres have shown that GNRs of similar size are dominated by absorption (nearly 80% of the optical extinction), giving rise to a low backscattering albedo that can also be exploited for OCT contrast in highly scattering media.12 Other studies also indicate that GNRs of similar aspect ratio are primarily absorbing at sizes below 50 nm, but produce greater scattering with increasing particle size and nanorod width.25,26
Fig. 2.
Extinction spectrum (Ocean Optics, USB2000) of GNRs (left, solid curve) and relative intensity of OCT imaging light (right, dotted curve). The GNR absorption peak asymmetrically attenuates the OCT imaging beam, allowing more sensitive detection in SOCT.
2.2 Spectroscopic optical coherence tomography
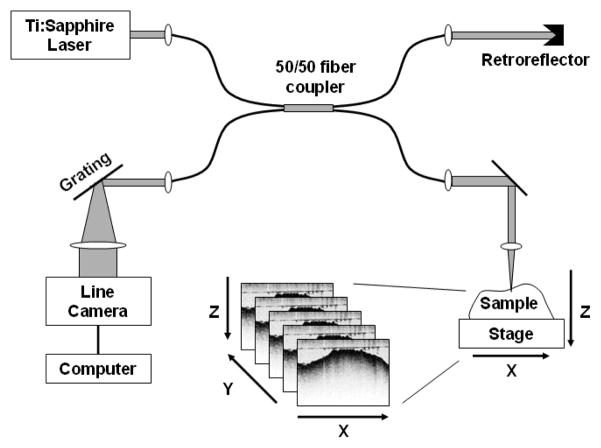
GNR imaging was performed using a spectral-domain OCT imaging system similar to that described previously,27 with modifications to ensure optimal SOCT data collection (Fig. 3). A Ti:Sapphire laser (KMLabs, Inc.) providing ~300 mW of broadband light spanning 780–900 nm (Fig. 2) is directed into a single-mode fiber interferometer for easy optical alignment. The reference arm of the interferometer consists of a fixed retroreflector delay, and the sample arm incorporates an imaging lens (40 mm focal length) which delivers ~10 mW of light into the sample. The imaging resolution of the OCT system is nominally 16 × 3 μm in the transverse and axial directions, respectively. The sample is mechanically scanned transversely along the x-direction to acquire a single B-mode image in the x-z plane (Fig. 3). Volumetric stacks of B-mode images were acquired by manually shifting the sample in the y-direction between successive scans.
Fig. 3.
SOCT setup consisting of a single-mode fiber interferometer which splits the light equally (50/50) into the reference and sample arms. The sample is scanned along the x axis during OCT imaging to produce a single B-mode (x-z) image; volumetric image stacks are acquired by displacing the sample in y between successive B-mode scans.
To perform OCT, the backscattered light from the sample was collected and combined with the reference light on a line camera (Dalsa Piranha 2) positioned inside a spectrometer. The camera sampled the spectral interferogram at a rate of 7.5 kHz; Fourier transformation of the interferogram provided the z-dimension (depth) of the sample. Each B-mode image consisted of 1000 × 1024 pixels, corresponding to a width and height of 3 × 1.5 mm, respectively. Wavelength calibration was performed using NIR filters as described previously, and the linearity of the spectral response was also verified.17 We note that the spectral-domain OCT hardware28 is capable of more rapid sampling (29 kHz axial line rate), but is limited in this work by the transverse scanning speed of the sample stage.
2.3 SOCT image processing
In order to generate SOCT images with GNR-based contrast enhancement, the following image processing steps were taken: (1) SOCT spectra collected by the line camera were resampled into equispaced wavenumbers, as previously done;27 (2) the light spectrum was computed within voxels consisting of 30 × 40 pixels (width × height) using expression (17) of Ref. 17 to normalize against background noise; (3) the bottom portion of each image plane was cropped to a total of 700 pixels in height, at the threshold of OCT signal detection. The voxel-averaged spectrum S was computed for images from each sample both before (a priori) and after the injection of GNRs into the tissue sample.
The relative GNR density ρ was then computed by the following expression (similar to that reported in Ref. 9):
where μt is the wavelength-dependent extinction coefficient of the GNRs (Fig. 2), zs is the position of the top surface of the sample, and the denominator Sa_priori is the average of all a priori spectra having common values of z, zs, and λ with the sample spectrum S in the numerator. The derivative with respect to z is computed using Euler’s formula, and the average of the entire expression is taken over all wavelengths λi. This equation is derived from the exponential transport equation, with the assumption that the depth-resolved spectral attenuation is given by the differential8 after subtraction of a priori tissue attenuation, such that any residual spectrum is due to the presense of GNRs.9 The resulting computed density ρ is relative to that used for the measurement of μt.
The structural (B-mode) OCT image was computed simultaneously from the background-subtracted Fourier transform of the spectral interferograms, and displayed using the red channel of an RGB image. The remaining two channels were used for displaying SOCT-contrasted values of ρ to facilitate co-localization of GNRs within the structural image, using green for positive ρ and blue for negative ρ. A 2D Gaussian filter was applied to the blue and green channels for smoothing the voxel-averaged data.
2.4 Human tissue specimens
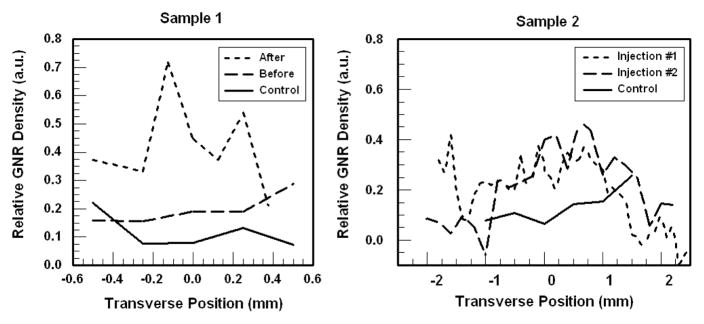
Two specimens (ca. 1 cm3) of anonymized breast tumor tissue were obtained following informed signed consent from patients with biopsy-proven breast cancer, under protocols approved by the Institutional Review Boards of Carle Foundation Hospital and the University of Illinois at Urbana-Champaign. The tissue specimens (Samples 1 and 2) were fixed in formalin and identified as invasive ductal carcinomas via histopathology. Sample 1 was divided into equal portions, with one serving as a control. Stacks of B-mode SOCT images were collected from both portions (labelled “Control” and “Before” in Fig. 4) at various positions in the y direction (number of samples N=5). The second portion was then injected with several microliters of a dense suspension of GNRs (λmax=755 nm, μt=36 cm−1) using a 26-gauge needle, in two separate locations perpendicular to the imaging surface and close to the center of the imaging range. This sample (labelled “After”) was then imaged at various positions along y (N=8) over a similar range as before. The surface roughness of Sample 1 limited OCT scanning to < 1 mm in the y direction.
Fig. 4.
Plots of SOCT image-averaged relative GNR densities in human breast tumors, before or after injection. In each sample, the control group of images was used as the a priori data. The image stacks for Sample 1 (left) display an increase in ρ after GNR injection, whereas the sample before injection is similar to control. Sample 2 (right) exhibits a broad peak in ρ near y=0 after GNR injections, which is consistent with the GNR injection site. GNR density values are relative to that used during the spectral calibration.
Sample 2 was cut to prepare a flat surface to enable OCT scanning over several millimeters in both the x and y directions. Stacks of B-mode images were again collected before treatment with contrast agent (N=6), followed by a single injection of GNRs near the center of the imaging surface (x and y ≈ 0 mm) using the procedure as described above. A stack of SOCT images was then collected at multiple points along y over a range of more than 4 mm (“Injection #1,” N=45). The specimen was injected with a second aliquot of GNRs near the site of the first injection, followed by additional OCT scanning over a similar region as before (“Injection #2,” N=24).
3. Results and Discussion
The results of SOCT imaging of GNRs in human breast tissue samples are summarized in Figs. 4 and 5. To confirm that the ρ values derived from SOCT correlate with changes in GNR density, we first compare the mean ρ values taken from each stack of SOCT images, plotted along the y direction (Fig. 4). For Sample 1, the control image stack is used to construct the a priori spectral database. As expected, the image stacks obtained from Sample 1 after GNR injection show a clear increase in mean ρ, whereas the image stack before treatment is nearly identical to that of the control. We note that there appears to be a positive bias in ρ for the untreated samples, which needs to be further investigated. As the injected GNR solution was at a relative density ρ of 1 (equivalent to that used for the spectral calibration), it is consistent that the resulting concentrations measured within the tissue samples were some fraction of this number.
Fig. 5.
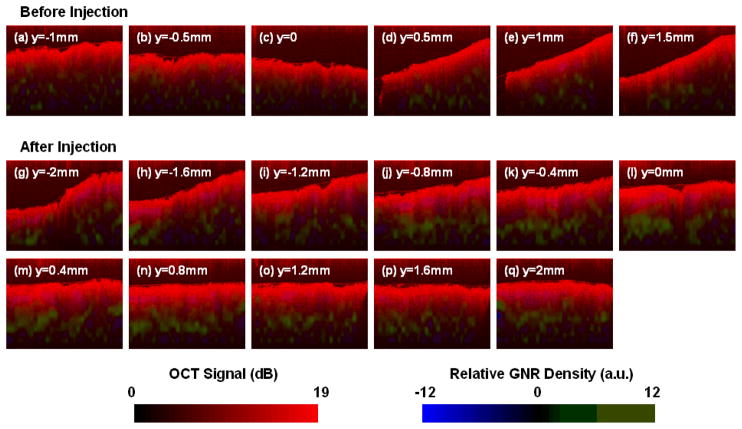
GNR contrast-enhanced SOCT images of a human breast carcinoma tissue sample. (a)–(f) Series of B-mode images before injection, sampled every 0.5 mm along y; (g)–(q) images after the second injection of GNR solution in Sample 2 (cf. Fig. 4), taken from the image stack every 0.4 mm along y. The structural OCT image is presented in red, and the SOCT-computed GNR density is presented in green (ρ>0) or blue (ρ<0). The tissue sample after GNR injection displays a strong and positive increase in ρ compared with the control. Image dimensions: 3 mm × 1 mm.
For Sample 2, the two image stacks after GNR injections show a sizable increase in mean ρ values near y=0 relative to the control sample, as expected from the central location of the injection site. The apparent extent of GNR diffusion is approximately 1 mm from the origin. However, we note that these tissues are fixed in formalin and are expected to be less permeable than live or unfixed tissues, so the extent of GNR diffusion may be greater in a living subject.
The GNR distribution can also be superimposed onto standard OCT images, and resolved with sub-millimeter resolution in the x and z dimensions (Fig. 5). The structure of the tissue samples are shown in red (OCT signal), while the relative density of GNRs are plotted in green or blue (ρ>0 or ρ<0, respectively). While there is no physical meaning to negative density values, their intensities may reflect the noise levels of this technique, or a disturbance in tissue structure. For example, a few purplish regions indicating negative ρ can be found near the surfaces in images (j)–(l). A possible reason for this apparent signal depletion may be due to the forced hydration of nearby tissue caused by GNR injections, producing a local reduction in endogenous tissue scattering.
Inspection of the B-mode SOCT images acquired for Sample 2 after the second GNR injection reveals an increased number of pixels with high, positive ρ values, mostly well beneath the surface of the tissue (Fig. 5gq). This result is not unexpected, as the injection needle was inserted 1–2 mm below the tissue surface. The regions of green in images (j)–(m) are particularly bright and continuous, correlating strongly with the injection site near the center of the image stack (Fig. 5). In comparison, the control SOCT images (Fig. 5a–f) exhibit only a slight positive bias. Overall, the relative GNR densities observed in the SOCT images are consistent with the mean ρ values plotted in Fig. 4.
The results above suggest that the relative GNR density needed for detection in human breast tissues is about 0.3. The molar extinction coefficients of our GNRs are estimated to be in the range of 2–4 × 10⁹ M−1 cm−1 at plasmon resonance, based on characterization data for GNRs of comparable size.29–31 Based on these values, the undiluted concentration of GNRs used in this study is 10–20 nM, suggesting the limit of detection to be 3–6 nM (μt=12 cm−1). Lower limits are possible if the samples are spectroscopically homogeneous, as reported by others where absorption sensitivity to 5 cm−1 was obtained in homogeneous tissue phantoms.32 Considering that this study has addressed the added complexity of imaging within heterogeneously scattering tissues with irregular boundaries, the experimental SOCT sensitivity to GNRs is within an expected range.
It is worth mentioning that SOCT images of GNRs have been obtained previously in liquid tissue phantoms (Intralipid), using a different SOCT algorithm to compute the cumulative spectral shift.17 One problem with the cumulative algorithm is that while the noise is somewhat mitigated, the locations of the GNRs cannot be depth-resolved. Furthermore, a comparison of SOCT images obtained from liquid and solid specimens indicates a higher level of spectroscopic noise in the liquid phantoms. This is attributed to Brownian motion of the oil emulsion, causing Doppler shifts that scramble the spectrum. In this work, the SOCT algorithms are depth-resolved for solid tissue imaging, and produce sufficiently low noise to enable the detection of GNRs in a heterogeneous medium. While the experiments reported here demonstrate imaging after interstitial injection of nanorods into tumor specimens, we expect that in realistic in vivo imaging scenarios the enhanced permeation and retention effect may provide tumor-specific imaging after intravenous administration, as demonstrated previously using nanoshells to image mouse tumors.33
4. Conclusion
GNRs are well suited as contrast agents for SOCT imaging in biological systems, as demonstrated by their detection in human tumor tissues. Additional theoretical developments are expected to produce more robust methods for imaging GNRs with higher sensitivity and spatial resolution, thereby enhancing the capability of OCT imaging to provide depth-resolved information significantly beyond the immediate surface layer.
Acknowledgments
We gratefully acknowledge the National Institutes of Health (EB-001777) for financial support, and Dr. Adam Zysk, Dr. Daniel Marks, and Eric Chaney (Beckman Institute for Advanced Science and Technology, University of Illinois) for technical assistance. We thank Drs. Kendrith Rowland, Patricia Johnson, Jan Kotynek, Uretz Oliphant, and Frank Bellafiore (Carle Clinic Association, Urbana, IL) for their assistance in human tissue acquisition and handling. TEM images were taken at the Imaging Technology Group Microscopy Suite at the University of Illinois. This work is in association with Carle Foundation Hosptial and Carle Clinic Association in Urbana, Illinois, the Purdue Cancer Center, and the Oncological Sciences Center at Purdue University.
Contributor Information
Alexander Wei, Email: alexwei@purdue.edu.
Stephen A. Boppart, Email: boppart@illinois.edu.
References
- 1.Huang D, Swanson EA, Lin CP, Schuman JS, Stinson WG, Chang W, Hee MR, Flotte T, Gergory K, Puliafite CA, Fujimoto JG. Science. 1991;254:1178. doi: 10.1126/science.1957169. [DOI] [PMC free article] [PubMed] [Google Scholar]
- 2.Boppart SA, Oldenburg AL, Xu C, Marks DL. J Biomed Opt. 2005;10:041208-1–14. doi: 10.1117/1.2008974. [DOI] [PubMed] [Google Scholar]
- 3.Morgner U, Drexler W, Fartner FX, Li XD, Pitris C, Ippen EP, Fujimoto JG. Opt Lett. 2000;25:111. doi: 10.1364/ol.25.000111. [DOI] [PubMed] [Google Scholar]
- 4.Xu C, Carney PS, Boppart SA. Opt Express. 2005;13:5450. doi: 10.1364/opex.13.005450. [DOI] [PubMed] [Google Scholar]
- 5.Schmitt JM, Xiang SH, Yung KM. J Opt Soc Am A. 1998;15:2288. [Google Scholar]
- 6.Leitgeb R, Wojtkowski M, Kowalczyk A, Hitzenberger CK, Sticker M, Fercher AF. Opt Lett. 2000;25:820. doi: 10.1364/ol.25.000820. [DOI] [PubMed] [Google Scholar]
- 7.Xu C, Ye J, Marks DL, Boppart SA. Opt Lett. 2004;29:1647. doi: 10.1364/ol.29.001647. [DOI] [PubMed] [Google Scholar]
- 8.Yang C, McGuckin LEL, Simon JD, Choma MA, Applegate BE, Izatt JA. Opt Lett. 2004;29:2016. doi: 10.1364/ol.29.002016. [DOI] [PMC free article] [PubMed] [Google Scholar]
- 9.Oldenburg AL, Hansen MN, Wei A, Boppart SA. Proc SPIE. 2008;6867:6867OE. [Google Scholar]
- 10.Lin AWH, Lewinski NA, West JL, Halas NJ, Drezek RA. J Biomed Opt. 2005;10:064035. doi: 10.1117/1.2141825. [DOI] [PubMed] [Google Scholar]
- 11.Chen J, Wiley B, Li ZY, Campbell D, Saeki F, Cang H, Au L, Lee J, Li X, Xia Y. Adv Mater. 2005;17:2255. [Google Scholar]
- 12.Oldenburg AL, Hansen MN, Zweifel DA, Wei A, Boppart SA. Opt Express. 2006;14:6724. doi: 10.1364/oe.14.006724. [DOI] [PubMed] [Google Scholar]
- 13.Cang H, Sun T, Li ZY, Chen J, Wiley BJ, Xia Y, Li X. Opt Lett. 2005;30:3048. doi: 10.1364/ol.30.003048. [DOI] [PubMed] [Google Scholar]
- 14.Perez-Juste J, Pastoriza-Santos I, Liz-Marzan LM, Mulvaney P. Coord Chem Rev. 2005;249:1870. [Google Scholar]
- 15.Liao H, Nehl CL, Hafner JH. Nanomedicine. 2006;1:201. doi: 10.2217/17435889.1.2.201. [DOI] [PubMed] [Google Scholar]
- 16.Jain PK, Lee KS, El-Sayed IH, El-Sayed MA. J Phys Chem B. 2006;110:7238. doi: 10.1021/jp057170o. [DOI] [PubMed] [Google Scholar]
- 17.Oldenburg AL, Xu C, Boppart SA. IEEE J Sel Top Quant Elect. 2007;13:1629. [Google Scholar]
- 18.Jana NR, Gearheart L, Murphy CJ. Adv Mater. 2001;13:1389. [Google Scholar]
- 19.Sau TK, Murphy CJ. Langmuir. 2004;20:6414. doi: 10.1021/la049463z. [DOI] [PubMed] [Google Scholar]
- 20.Nikoobakht B, El-Sayed MA. Chem Mater. 2003;15:1957. [Google Scholar]
- 21.Zweifel DA, Wei A. Chem Mater. 2005;17:4256. doi: 10.1021/cm0506858. [DOI] [PMC free article] [PubMed] [Google Scholar]
- 22.Huang X, El-Sayed IH, Qian W, El-Sayed MA. J Am Chem Soc. 2006;128:2115. doi: 10.1021/ja057254a. [DOI] [PubMed] [Google Scholar]
- 23.Takahashi H, Niidome T, Nariai A, Niidome Y, Yamada S. Chem Lett. 2006;35:500. [Google Scholar]
- 24.Tong L, Zhao Y, Huff TB, Hansen MN, Wei A, Cheng JX. Adv Mater. 2007;19:3136. doi: 10.1002/adma.200701974. [DOI] [PMC free article] [PubMed] [Google Scholar]
- 25.Lee KS, El-Sayed MA. J Phys Chem B. 2005;109:20331. doi: 10.1021/jp054385p. [DOI] [PubMed] [Google Scholar]
- 26.Ni W, Kou X, Yang Z, Wang J. ACS Nano. 2008;2:677–86. doi: 10.1021/nn7003603. [DOI] [PubMed] [Google Scholar]
- 27.Ralston TS, Marks DL, Carney PS, Boppart SA. Nat Phys. 2007;3:129. doi: 10.1038/nphys514. [DOI] [PMC free article] [PubMed] [Google Scholar]
- 28.Nassif N, Cense B, Park BH, Yun SH. Opt Lett. 2004;29:480. doi: 10.1364/ol.29.000480. [DOI] [PubMed] [Google Scholar]
- 29.Nikoobakht B, Wang J, El-Sayed MA. Chem Phys Lett. 2002;366:17. [Google Scholar]
- 30.Liao H, Hafner JH. Chem Mater. 2005;17:4636. [Google Scholar]
- 31.Orendorff CJ, Murphy CJ. J Phys Chem B. 2006;110:3990. doi: 10.1021/jp0570972. [DOI] [PubMed] [Google Scholar]
- 32.Hermann B, Bizheva K, Unterhuber A, Povazay B, Sattmann H, Schmetterer L, Fercher AF, Drexler W. Opt Express. 2004;12:1677. doi: 10.1364/opex.12.001677. [DOI] [PubMed] [Google Scholar]
- 33.Gobin AM, Lee MH, Halas NJ, James WD, Drezek RA, West JL. Nano Lett. 2007;7:1929. doi: 10.1021/nl070610y. [DOI] [PubMed] [Google Scholar]


