Over 80% of pharmaceutical products on the market, including many biopharmaceuticals, are in various solid forms.[1–4] Solid-state NMR (SSNMR) provides atomic-resolution structural insight to such materials, and therefore is recognized as a powerful analytical approach to analyze formulation chemistry in pharmaceutical products.[1] Dramatic progress in SSNMR over the last decade has enabled the determination of structures for several proteins, with the assistance of 13C and 15N isotope enrichment.[5,6] However, due to limited experimental sensitivity inherent in low natural abundance of 13C (1.07%) and 15N (0.368%), the application in pharmaceutical SSNMR research has been limited to small molecules.[1] Furthermore, the one-dimensional 13C spectra commonly acquired for small molecule drugs have insufficient resolution for larger peptide and protein pharmaceuticals.
Herein we report a solution to these sensitivity and resolution problems by demonstrating resolved two-dimensional (15N-1H and 13C-1H) spectra of the therapeutic proteins aprotinin and insulin, acquired in half to one day with milligram quantities of sample. This is remarkable in comparison to the fact that one-dimensional 15N CP-MAS experiments require measurement times of at least tens of hours, and more likely several days in order to obtain similar signal-to-noise ratios. Because proteins are susceptible to physical and chemical degradation under many conditions (e.g., exposure to heating, freeze-thaw cycles, light, moisture, shaking, and hydrophobic surfaces), the ability to monitor changes efficiently and precisely will enable an improved understanding of the molecular basis of formulation toxicity and/or loss of efficacy.[7] Improved SSNMR methods in this context enable analysis of detailed conformational changes (e.g. denaturation and aggregation) and chemical modifications (e.g. deamination, oxidation, and hydrolysis), and therefore offer a fundamentally new analytical tool for biochemists in the pharmaceutical industry. More generally, the higher throughput capability enables study of natural abundance proteins in order to gain insight into a variety of structure-function problems in modern molecular science.
We achieve a major sensitivity gain by employing proton detection in combination with the recently developed fast magic-angle spinning (MAS) technique[8,9] and a highly optimized solvent suppression method.[10] Proton detection, which is used almost ubiquitously in solution NMR,[11] has traditionally been less often utilized in the solid state due to the broad resonance lines arising from strong proton dipolar couplings. One approach to address this challenge is proton dilution, in which all non-exchangeable protons are (bio)synthetically replaced with deuterons.[9, 12, 13] This approach is inconvenient and cost-prohibitive for many chemical problems, and is undesirable for pharmaceutical analyses since it alters drug substance sameness.[7, 14, 15] Alternatively, the fast (40 kHz) MAS approach has enabled us to demonstrated significant resolution and sensitivity enhancements for fully protonated small molecule pharmaceuticals[16] and proteins[8]. However in that protein study 13C and 15N isotope enrichment was used,[8] which suffers from the aforementioned shortcomings. Here we demonstrate that the fast MAS approach can be practically applied to natural abundance proteins within reasonable experimental times.
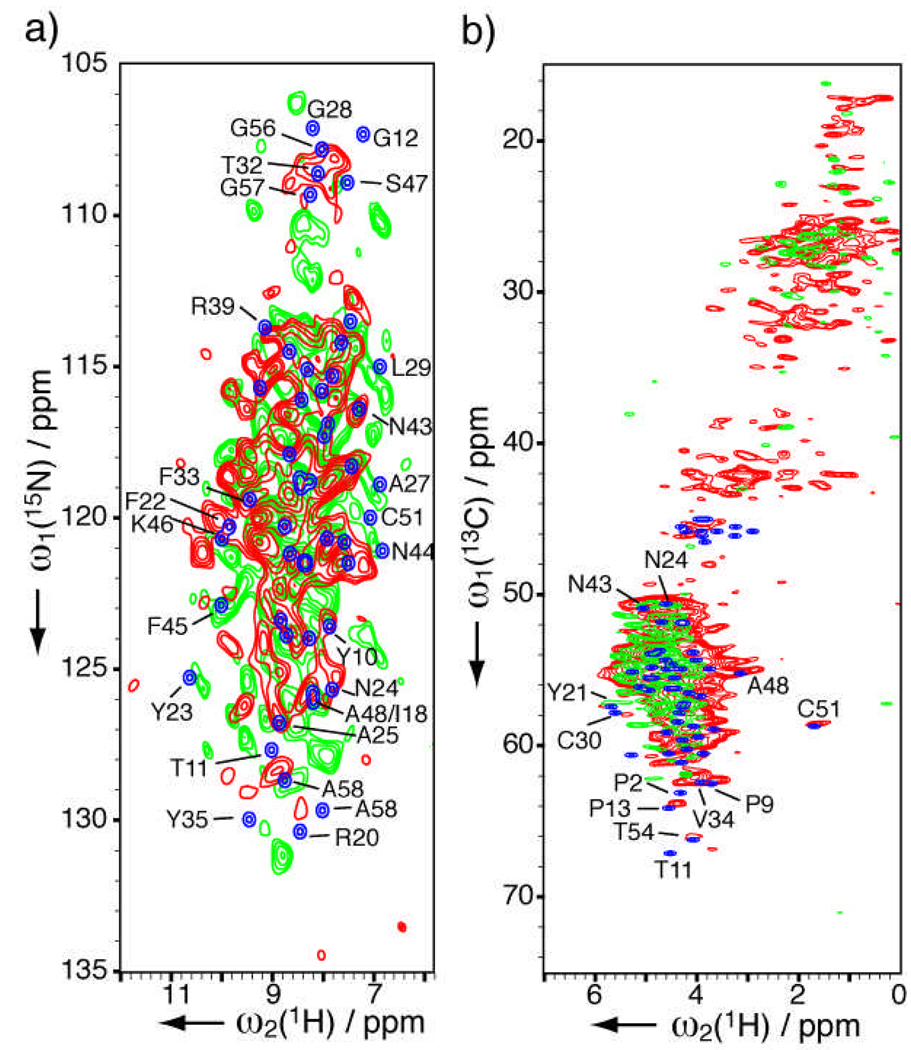
As a first demonstration, we examine lyophilized powders of bovine pancreatic trypsin inhibitor (BPTI, also known as aprotinin) from two suppliers. BPTI is a protease inhibitor that for many years has been administered (brand name Trasylol® from Bayer AG, Germany) to reduce blood loss in high risk cardiac surgeries until its recent temporary withdrawal from the market due to a suspected increase in mortality.[17] Most biopharmaceuticals, especially when initially marketed, are often lyophilized to maintain the long-term potency and reconstituted with aqueous diluent prior to administration.[18] Although Trasylol is pre-reconstituted, lyophilized aprotinin powders are commonly sold for laboratory use. 15N-1H and 13C-1H heteronuclear correlation (HETCOR) spectra are shown in Figures 1a and 1b respectively for sample A (in red) and B (in green); several slices are shown in Supporting Information Figure S1. Around 40 (50) peaks for sample A (B) can be identified for this 58-residue protein in the 15N-1H spectra. In rare cases where proton chemical shifts are assigned in the solid state (with enriched samples), such as protein GB1,[8] HETCOR peaks for natural abundance can be specifically identified by direct comparison (Supporting Information Figure S2). Since such information is not available for BPTI, HETCOR spectra were constructed from solution chemical shifts instead (in blue, Figure 1). For both samples, the overall distribution of peaks agrees well with those predicted from solution chemical shifts, indicating the protein is still folded in the lyophilized powders. Moreover for sample A, several peaks including A25, A48, I18, N24, Y10, N43, A58 in Figure 1a and C51, A48, Y21, T54 in Figure 1b seem to have very similar chemical shifts to solution state. For sample B, Y23, F45, A27, C51, N44, A58 in Figure 1a also have very similar chemical shifts to the solution state. However, sample B displays clear difference from sample A and solution state in these spectra. For instance, the 15N high-field region (106 to 112 ppm) that contains glycines, T32 and S47 is much more dispersed than the solution state and sample A (Figure 1a). This implies that the structure of sample B deviates more than sample A does from solution structure. We therefore expect HETCOR NMR to complement infrared, Raman, and mass spectroscopies in the study of protein lyophilization,[4] as well as the processes (e.g. milling, spray drying) used to prepare dry inhalable protein powders.[19]
Figure 1.
Solid-state HETCOR NMR spectra of natural abundance lyophilized aprotinin sample A (7.2 mg, in red) and B (3.5 mg, in green) from different suppliers. Spectra in blue are simulated from solution chemical shifts (BMRB database #5359). (a) 15N-1H 2D spectra acquired in 26 (31) h with 640 (1024) scans per row, t1max(15N) = 10 (7.5) ms and linear-predicted to 20 (15) ms, t2max(1H) = 3.4 (3.4) ms for sample A (B). Lorentzian-to-Gaussian apodization was applied (150-to-300 Hz for 1H, 15-to-30 Hz for 15N) followed by sine bell apodization (54° shift) for each dimension. (b) 13C-1H 2D spectra acquired in 19 h with 48 scans per row for both samples. t1max(13C) = 11 ms and linear-predicted to 22 ms, t2max(1H) = 3.4 ms. Lorentzian-to-Gaussian apodization was applied (150-to-300 Hz 1H, 40-to-80 Hz for 13C) followed by sine bell apodization (54° shift) for each dimension. Contours are drawn starting at 6 times the noise level, with a spacing factor 1.15.
As a second demonstration of the technique, experiments were performed on three recombinant human insulin samples: lyophilized powders (sample C), fibrils (D), and crystalline suspension formulation (E). Insulin, the hormone used to treat diabetes that afflicts over 170 million people worldwide, consists of two peptide chains (A and B having 21 and 30 residues, respectively) covalently linked by two disulfide bonds. During prolonged storage insulin is known to form insoluble fibrillar aggregates.[20] The NPH (neutral protamine Hagedorn) insulin is an important formulation that provides longer action than regular insulin. It is a suspension of microcrystallines co-crystallized in the presence of the positively charged peptide protamine as well as zinc.[21]
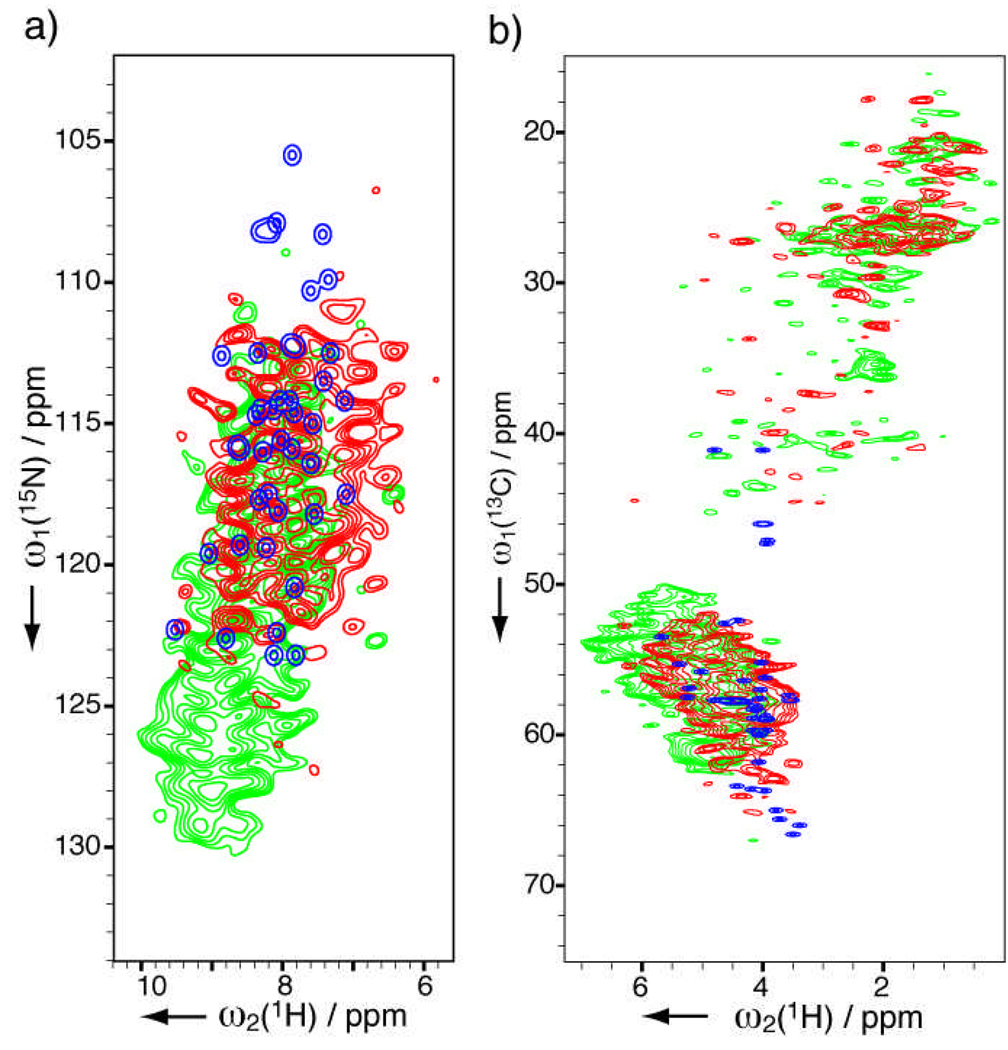
Figure 2 shows 15N-1H and 13C-1H spectra for the lyophilized (C) and fibril (D) insulin samples. Also shown in the figure are simulated spectra from solution chemical shifts for a mutant monomer (replacing F1, H10, Y16, T27 of the B chain with Glu and deleting T30 of B chain to avoid aggregation; for 15N and amide 1H shifts)[22] and a phenol-stabilized R6 hexamer (for 13C and 1Hα).[23] For the lyophilized sample C, most peaks in the 15N-1H spectrum (Figure 2a) are at least partially resolved for this 51-residue protein. This sample displays similar overall signal distribution with solution data in both 15N-1H and 13C-1H spectra, indicating a similar folding. In contrast, the fibril sample D displays dramatically different spectra. Its 15N-1H spectrum has strong low-field intensities (126 to 130 ppm in 15N) that are not observed in sample C. Its 1Hα in Figure 2b displace to lower field and 13Cα to higher field, in consistent with the fact that insulin fibrils consist mainly β-sheet structures.[24]
Figure 2.
Solid-state HETCOR NMR spectra of natural abundance recombinant human insulin samples C (4.8 mg lyophilized powder, in red) and D (5.7 mg fibrils, in green). Spectra in blue are simulated from solution chemical shifts (details in text). (a) 15N-1H 2D spectra acquired in 24 h with 640 scans per row. t1max(15N) = 10 ms and linear-predicted to 20 ms, t2max(1H) = 3.4 ms. (b) 13C-1H 2D spectra acquired in 19 h with 48 scans per row. t1max(13C) = 11 ms and linear-predicted to 22 ms, t2max(1H) = 3.4 ms. Apodization and contour display parameters are identical to Figure 1.
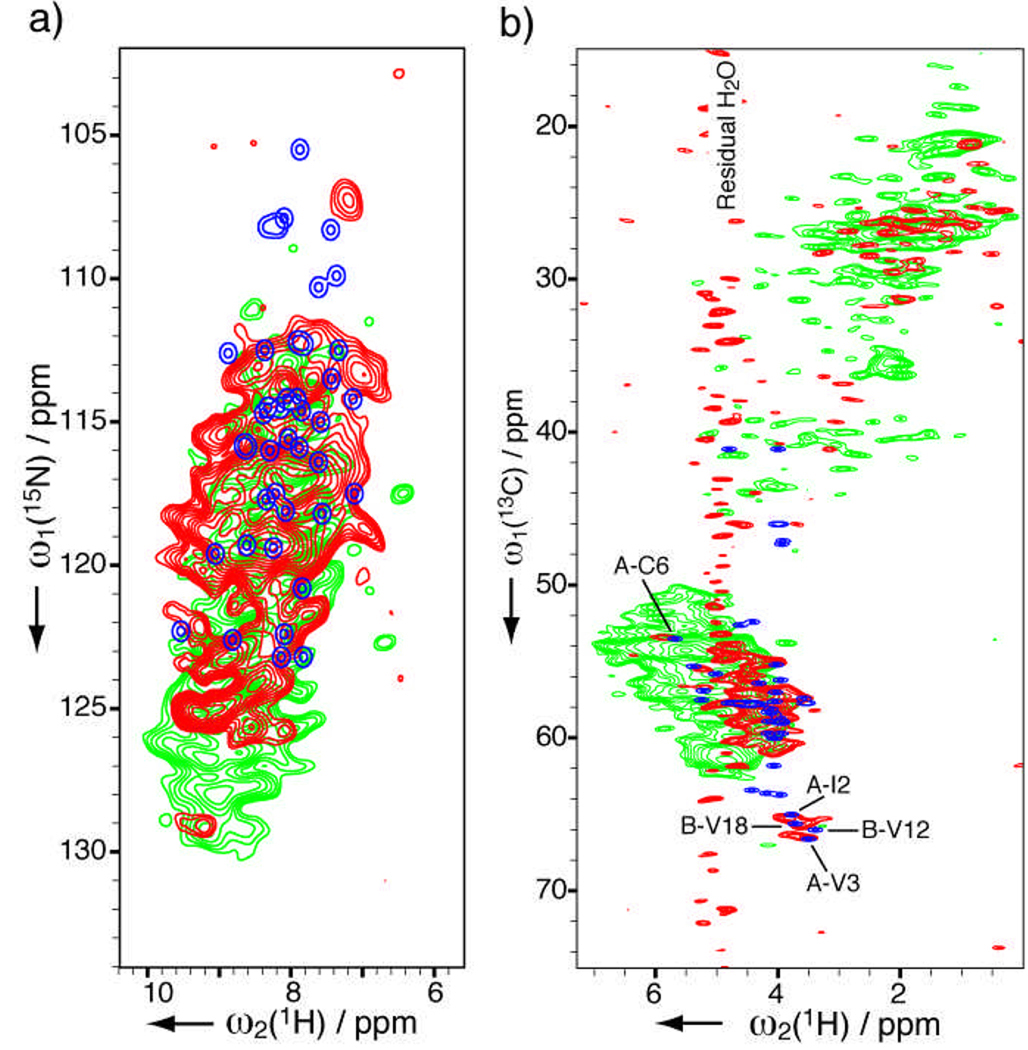
Figure 3 shows HETCOR spectra for crystalline suspension formulation insulin (sample E). The extreme challenge of solvent suppression for this hydrated sample that is amplified by the low natural abundance has been satisfactorily addressed by our recent MISSISSIPPI scheme;[10] its performance is compared with a previous method in the Supporting Information Figures S2a and S2b. The 15N-1H peak distribution in Figure 3a agrees in general with the monomer solution spectrum, meanwhile differences are evident in both low (124 to 130 ppm) and high (105 to 111 ppm) fields in the 15N dimension. The 13C-1H correlations in Figure 3b appear to agree very well with the solution spectrum. For example, residues C6, I2, V3 of the A chain and V12 and V18 of the B chain have very similar peak positions in the two states. This is in consistent with the fact that the protein exists as hexamers in both the crystalline formulation (zinc-stabilized T6 hexamers[25]) and the solution sample (phenol-stablized R6 hexamers[26]). The formulation sample is further compared with the fibril sample in Figure 3. Potential partial fibrillization in a formulation can be spotted from 126.5 to 128.5 ppm in 15N dimension of 15N-1H spectra, which are much more sensitive than one-dimensional 15N spectra. Fibrillization can also be detected from 5.5 to 7 ppm in the 1H dimension of 13C-1H spectrum.
Figure 3.
Solid-state HETCOR NMR spectra of formulated insulin (sample E containing 5 mg protein, in red). (a) 15N-1H 2D spectrum acquired in 27 h with 896 scans per row, t1max(15N) = 7.5 ms and linear-predicted to 15 ms, t2max(1H) = 3.4 ms. (b) 13C-1H 2D spectrum acquired in 7 h with 16 scans, t1max(13C) = 11 ms and linear-predicted to 22 ms, t2max(1H) = 3.4 ms. No post-acquisition solvent suppression was applied. Apodization and contour display parameters are identical to Figure 1. Also shown are the insulin fibril spectra (sample D, in green) as well as the simulated spectra (blue) from Fig. 2.
Although the chemical shifts of both insulin and BPTI cannot be uniquely assigned from these 2D spectra alone, the site resolution inherent to SSNMR enables a variety of statistical analysis methods to assess sameness, and as desired, full chemical shifts can be derived from separate, isotopically labeled samples. We anticipate further that homonuclear correlation schemes (e.g., 1H-1H 2D or 3D spectra), as well as technical advances—such as higher magnetic field, faster MAS spinners and digital receivers with enhanced dynamic range and digital filtering capabilities—will further enhance resolution and sensitivity of natural abundance SSNMR protein spectra.
Progress in this regard is particularly timely in the context of a rapidly expanding market for peptide and protein pharmaceuticals. Although there were only 40 synthetic peptide and 50 recombinant protein drugs on the market in 2001,[3] the total number of peptide drugs and candidates reached 720 in 2004.[27] In contrast to small molecule drugs, the therapeutic peptides and proteins are usually more potent and specific but less stable.[27] Thus the ability to assess chemical changes directly in the solid form is a particularly powerful tool for the pharmaceutical industry in development, manufacturing, and storage. Beyond pharmaceuticals, this approach can be applied to study all synthetic peptides, natural fibrous proteins (e.g. silk fibroins, hair keratin),[28, 29] as well as polymers.[30] Finally, in pushing the limits of high-sensitivity proton detection of solid proteins, we envision that such 2D spectra could be acquired in the same amount of time with less than 50 micrograms of isotopically enriched material (10 nanomoles of a 5 kDa protein).
Experimental Section
Sample Preparation
Two lyophilized aprotinin samples were used in this study as received. Sample A (7.2 mg packed in NMR sample rotor) is from Sigma-Aldrich (St. Louis, MO) and sample B (3.5 mg) from Calbiochem (San Diego, CA). Three recombinant insulin samples (C, D, E) were used in this study. Sample C is 4.8 mg lyophilized recombinant insulin (ProSpec-Tany TechonoGene Ltd., Rehovot, Israel) as received. Sample D is a fibril sample prepared by heating insulin solution (2 mM, pH 2.6) at 70 °C for 26 hours according to literature.[24] The gel formed was pelleted and dried under gentle N2 flow; 5.7 mg was packed for NMR experiments. Sample E is Humulin® N (Eli Lily, Indianapolis, IN) purchased over the counter with 100 unit/ml (~4 mg/ml) concentration in a 10 ml vial, from which 2 ml was drawn with a syringe and subsequently pelleted by centrifugation (3000 g for 3 min). After the supernatant was carefully removed with pipette, slightly more than half of the pellet was transferred to an NMR rotor. The 8.5-mg sample roughly consisted of 5 mg insulin, 0.5 mg protamine, 0.05 mg zinc, and 3 mg water.
NMR Experiments
The SSNMR experiments were performed at 7 °C (sample temperature calibrated with ethylene glycol)[10] on a 750 MHz Varian INOVA spectrometer (Varian, Inc., Palo Alto, CA) with a FastMAS™ 1H-13C-15N probe (Varian, Inc., Fort Collins, CO). Probe specifications have been published earlier along with the heteronuclear correlation pulse sequence that employed MISSISSIPPI solvent suppression.[10] Contact times were 1.6 and 0.6 ms for 1H to 15N and 15N to 1H cross polarization (CP) steps, respectively. Contact times were 1.2 and 0.25 ms for the 1H to 13C and 13C to 1H CP steps, respectively. The longer initial contact time maximizes total signal intensity on the 15N or 13C site, whereas the shorter second contact time primarily polarizes directly bonded protons. Experiments were performed at 36 kHz MAS rate.
Supplementary Material
Footnotes
This research was supported by the National Institutes of Health (R01 GM-75937 to C.M.R). We thank John A. Stringer and Mircea Cormos (Varian, Inc.) for advice on probe performance.
Supporting information for this article is available on the WWW under http://www.angewandte.org or from the author.
Contributor Information
Dr. Donghua H. Zhou, Department of Chemistry, University of Illinois at Urbana-Champaign, Urbana, IL 61801 (USA)
Gautam Shah, Department of Chemistry, University of Illinois at Urbana-Champaign, Urbana, IL 61801 (USA).
Charles Mullen, Varian, Inc, Fort Collins, CO.
Dennis Sandoz, Varian, Inc. Palo Alto, CA.
Dr. Chad M. Rienstra, Department of Chemistry, University of Illinois at Urbana-Champaign, Urbana, IL 61801 (USA).
References
- 1.Tishmack PA, Bugay DE, Byrn SR. J. Pharm. Sci. 2003;92:441–474. doi: 10.1002/jps.10307. [DOI] [PubMed] [Google Scholar]
- 2.Byrn S, Pfeiffer R, Ganey M, Hoiberg C, Poochikian G. Pharm. Res. 1995;12:945–954. doi: 10.1023/a:1016241927429. [DOI] [PubMed] [Google Scholar]
- 3.Loffet A. J. Pept. Sci. 2002;8:1–7. doi: 10.1002/psc.366. [DOI] [PubMed] [Google Scholar]
- 4.Wang W. Int. J. Pharm. 2000;203:1–60. doi: 10.1016/s0378-5173(00)00423-3. [DOI] [PubMed] [Google Scholar]
- 5.Castellani F, Rossum BV, Diehl A, Schubert M, Rehbein K, Oschkinat H. Nature. 2002;420:98–102. doi: 10.1038/nature01070. [DOI] [PubMed] [Google Scholar]
- 6.Ritter C, Maddelein ML, Siemer AB, Luhrs T, Ernst M, Meier BH, Saupe SJ, Riek R. Nature. 2005;435:844–848. doi: 10.1038/nature03793. [DOI] [PMC free article] [PubMed] [Google Scholar]
- 7.Banga AK. Therapeutic Peptides and Proteins: Formulation, Processing, and Delivery Systems. 2 ed. New York: CRC Press/Taylor & Francis; 2006. [Google Scholar]
- 8.Zhou DH, Shah G, Cormos M, Mullen C, Sandoz D, Rienstra CM. J. Am. Chem. Soc. 2007;129:11791–11801. doi: 10.1021/ja073462m. [DOI] [PubMed] [Google Scholar]
- 9.Zhou DH, Shea JJ, Nieuwkoop AJ, Franks WT, Wylie BJ, Mullen C, Sandoz D, Rienstra CM. Angew. Chem. Int. Ed. 2007;46:8380–8383. doi: 10.1002/anie.200702905. [DOI] [PMC free article] [PubMed] [Google Scholar]
- 10.Zhou DH, Rienstra CM. J. Magn. Reson. 2008;192:167–172. doi: 10.1016/j.jmr.2008.01.012. [DOI] [PMC free article] [PubMed] [Google Scholar]
- 11.Bodenhausen G, Ruben DJ. Chem. Phys. Lett. 1980;69:185–189. [Google Scholar]
- 12.Chevelkov V, van Rossum BJ, Castellani F, Rehbein K, Diehl A, Hohwy M, Steuernagel S, Engelke F, Oschkinat H, Reif B. J. Am. Chem. Soc. 2003;125:7788–7789. doi: 10.1021/ja029354b. [DOI] [PubMed] [Google Scholar]
- 13.Paulson EK, Morcombe CR, Gaponenko V, Dancheck B, Byrd RA, Zilm KW. J. Am. Chem. Soc. 2003;125:15831–15836. doi: 10.1021/ja037315+. [DOI] [PubMed] [Google Scholar]
- 14.Raw AS, Furness MS, Gill DS, Adams RC, Holcombe FO, Yu LX. Adv. Drug Deliv. Rev. 2004;56:397–414. doi: 10.1016/j.addr.2003.10.011. [DOI] [PubMed] [Google Scholar]
- 15.Layloff T. Pharm. Technol. 1991;15:146–148. [Google Scholar]
- 16.Zhou DH, Rienstra CM. Angew. Chem. Int. Ed. 2008 doi: 10.1002/anie.200802108. in press. [DOI] [PMC free article] [PubMed] [Google Scholar]
- 17.Sedrakyan A, Treasure T, Elefteriades JA. J. Thor. Card. Surg. 2004;128:442–448. doi: 10.1016/j.jtcvs.2004.03.041. [DOI] [PubMed] [Google Scholar]
- 18.Schwegman JJ, Hardwick LM, Akers MJ. Pharm. Dev. Tech. 2005;10:151–173. doi: 10.1081/pdt-56308. [DOI] [PubMed] [Google Scholar]
- 19.Johnson KA. Adv. Drug Deliv. Rev. 1997;26:3–15. doi: 10.1016/s0169-409x(97)00506-1. [DOI] [PubMed] [Google Scholar]
- 20.Brange J, Langkjoer L. Pharm. Biotechnol. 1993;5:315–350. doi: 10.1007/978-1-4899-1236-7_11. [DOI] [PubMed] [Google Scholar]
- 21.Norrman M, Hubalek F, Schluckebier G. Eur. J. Phar. Sci. 2007;30:414–423. doi: 10.1016/j.ejps.2007.01.003. [DOI] [PubMed] [Google Scholar]
- 22.Olsen HB. Roskilde University. Denmark: Roskilde; 1996. [Google Scholar]
- 23.Chang X, Jorgensen AMM, Bardrum P, Led JJ. Biochemistry. 1997;36:9409–9422. doi: 10.1021/bi9631069. [DOI] [PubMed] [Google Scholar]
- 24.Bouchard M, Zurdo J, Nettleton EJ, Dobson CM, Robinson CV. Protein Sci. 2000;9:1960–1967. doi: 10.1110/ps.9.10.1960. [DOI] [PMC free article] [PubMed] [Google Scholar]
- 25.Karlsson T, Popham JM, Long NOJR, Drobny GP. J. Am. Chem. Soc. 2003;125:7394–7407. doi: 10.1021/ja0294360. [DOI] [PubMed] [Google Scholar]
- 26.Kaarsholm NC, Ko HC, Dunn MF. Biochem. 1989;28:4427–4435. doi: 10.1021/bi00436a046. [DOI] [PubMed] [Google Scholar]
- 27.Marx V. Chem. Eng. News. 2005;83:17–24. [Google Scholar]
- 28.Nishikawa N, Horiguchi Y, Asakura T, Ando I. Polymer. 1999;40:2139–2144. [Google Scholar]
- 29.Shoji A. Modern Magnetic Resonance. 2006:587–600. [Google Scholar]
- 30.Ishii Y, Yesinowski JP, Tycko R. J. Am. Chem. Soc. 2001;123:2921–2922. doi: 10.1021/ja015505j. [DOI] [PubMed] [Google Scholar]
Associated Data
This section collects any data citations, data availability statements, or supplementary materials included in this article.


