

Abstract
Purpose
To evaluate whether pretreatment magnetic resonance imaging (MRI)/MR spectroscopic imaging (MRSI) findings and molecular markers in surgical specimens correlate with each other and with pretreatment clinical variables (biopsy Gleason score, clinical stage, and prostate-specific antigen level) and whether they contribute incremental value in predicting prostate cancer recurrence.
Experimental Design
Eighty-eight prostate cancer patients underwent MRI/MRSI before radical prostatectomy; imaging findings were scored on a scale of 1 to 7 (no tumor seen—lymph node metastasis). Ki-67, phospho-Akt, and androgen receptor expression in surgical specimens were assessed by immunohistochemistry. To examine correlations between markers and imaging scores, Spearman's correlation was used. To test whether markers and imaging scores differed by clinical stage or Gleason score, Wilcoxon's rank sum test was used. To examine time to recurrence, the methods of Kaplan-Meier were used. Cox proportional hazards models were built and their concordance indices (C-indices) were calculated to evaluate prediction of recurrence.
Results
All markers correlated moderately strongly with MRI/MRSI score (all correlation coefficients >0.5). Markers and MRI/MRSI score were strongly associated with clinical stage and biopsy Gleason score (P < 0.01 for all). At last follow-up, 27 patients had recurrence. C-indices for MRI/MRSI score and all markers were associated with time to recurrence and ranged from 0.78 to 0.89. A Cox model combining all clinical predictors had a C-index of 0.89; the C-index increased to 0.95 when MRI/MRSI score was added and to 0.97 when markers were also added.
Conclusions
MRI/MRSI findings and molecular markers correlated well with each other and contributed incremental value to clinical variables in predicting prostate cancer recurrence.
Prostate cancer is the most frequently diagnosed cancer in American men. The American Cancer Society estimated that in 2008, 186,320 new cases of prostate cancer would be diagnosed and 28,660 deaths would occur due to this disease (1). The prognosis and the choice of treatment are determined based on pretreatment clinical predictive variables, such as the clinical stage, the serum prostate-specific antigen (PSA) level, and the biopsy Gleason score (2). These variables are used in the standard clinical nomograms for prediction of prostate cancer recurrence (3–6). The biopsy Gleason score and the amount of cancer in each biopsy core are important predictors of the behavior of prostate cancer and its rate of progression (7–9). However, at biopsy, lesions are sometimes missed, and the Gleason score is frequently underestimated (10–13).
Several studies have suggested that magnetic resonance imaging (MRI) and MR spectroscopic imaging (MRSI) can help in the pretreatment evaluation of prostate cancer (14, 15). MRI clearly depicts the zonal anatomy of the prostate, whereas MRSI displays the relative concentrations of chemical metabolites within the gland and allows prostate cancer to be detected based on the identification of metabolic abnormalities. Cheng et al. (16) studied the clinical utility of endorectal MRI in determining PSA outcome for patients with biopsy Gleason score 7, PSA ≤10, and clinically localized prostate cancer and concluded that local therapy alone may be adequate for patients with MRI stage T2 disease. Pucar et al. (17) suggested that in patients with high-risk prostate cancer, the tumor stage as determined by MRI could indicate the likelihood of recurrence. Poulakis et al. (18) used clinical variables and MRI data in a model to predict biochemical recurrence and found that the new model was superior to a model that had clinical variables only.
Translational Relevance
Our study shows that magnetic resonance imaging (MRI)/MR spectroscopic imaging (MRSI) data and the levels of the molecular markers Ki-67, phospho-Akt, and androgen receptor correlate with each other and are moderately strongly associated with prostate cancer clinical stage and biopsy Gleason score. MRI/MRSI score and molecular markers may contribute incremental value to prostate-specific antigen, clinical stage, and biopsy Gleason score in predicting prostate cancer recurrence.
Recently, we introduced an approach called “systems pathology” to develop a model for predicting prostate cancer recurrence in patients treated with radical prostatectomy (19, 20). The model integrated clinicopathologic variables with histologic tumor characteristics and quantified biomarkers. The model proved to be highly accurate and, in the population studied, had a higher concordance index (C-index) than the standard postoperative nomogram for the prediction of recurrence (19).
MRI-guided biopsy followed by molecular profiling of biopsy cores could allow the advantages of MRI and systems pathology to be combined in the prediction of prostate cancer recurrence. The purpose of this study was to evaluate (a) whether pretreatment MRI/MRSI findings and molecular markers in surgical specimens correlate with each other and with pretreatment clinical variables (biopsy Gleason score, clinical stage, and PSA level) and (b) whether MRI/MRSI findings and molecular marker levels contribute incremental value to clinical variables in predicting prostate cancer recurrence. Three specific markers were selected for analysis based on their association with prostate cancer progression (19–27): Ki-67 (a proliferation marker), phospho-Akt (a serine-threonine kinase critical in signal transduction pathways involved in cell proliferation, apoptosis, and angiogenesis), and androgen receptor (AR; the phosphoprotein that mediates the actions of male sex hormones by acting as a transcription factor and interacting with the phosphatidylinositol 3-kinase pathway).
Materials and Methods
Patient demographics
From November 1999 to March 2004, 592 patients with prostate cancer were referred from the urology department (P.T.S.) for MRI before radical prostatectomy. Three hundred sixty-three of these patients underwent combined endorectal MRI/MRSI; of these, 89 patients [mean age, 63 y (SD, 6.58 y); range, 46-79 y; PSA range, 2.6-76.8 ng/mL; biopsy Gleason score range, 6-9] gave informed consent for tissue collection and molecular marker studies according to a research protocol approved by our institutional review board and were included in our study. All 89 patients had representative archived pathologic materials for immunohistochemical studies available. One of these 89 patients was lost to clinical follow-up; thus, our study included 88 patients. The institutional review board approved our retrospective review of MRI/MRSI studies, pathology data (from biopsy and surgical pathology), and clinical follow-up data and waived the informed consent requirement. This study was compliant with the Health Insurance Portability and Accountability Act. Patient data were collected and handled in accordance with institutional and federal guidelines.
Endorectal MRI/MRSI data acquisition and processing
Data were acquired on a 1.5 Tesla GE Signa Horizon scanner. MRI was done using a pelvic phased-array coil and an expandable endorectal coil; T1- and T2-weighted spin-echo MR images were obtained using a previously described standard prostate imaging protocol (total time, ∼30 min; refs. 28, 29). MR image acquisition was followed by a standard MRSI protocol with point-resolved spectroscopy (PRESS) voxel excitation and water and lipid suppression (total time, 17 min) in a voxel array and the SI dimension zero filled to 16 slices (3-mm resolution) with a voxel size of 0.12 to 0.16 cm3 (30, 31). MRSI data were overlaid on the corresponding T2-weighted images, including the raw spectra and the metabolic ratio (choline + creatine to citrate; refs. 30, 31).
Endorectal MRI/MRSI data interpretation
Two attendings, a radiologist with >10 y of experience in reading prostate endorectal MRI/MRSI and a physicist with >5 y of experience in reading prostate MRSI, retrospectively interpreted the imaging studies using established morphologic and metabolic criteria for the MRI and MRSI evaluation of prostate cancer in the peripheral and transition zones (14, 28, 32–34). Both of them were blinded to clinical data and surgical pathology. The spectroscopist evaluated the MRSI data set and provided the location and number of suspicious voxels to the radiologist, who integrated the MRSI information with the MRI data (as per routine clinical radiological practice at our institution) and provided a final reading for each study using a seven-point scoring system (developed in consensus by the institution's prostate cancer disease management team), with higher scores indicating greater predicted probabilities of recurrence. The combined MRI/MRSI scoring system was based on the tumor-node-metastasis staging system for prostate cancer and was as follows: 1, no tumor seen; 2, tumor seen, no extracapsular extension (ECE); 3, tumor seen, ECE cannot be ruled out; 4, unilateral ECE; 5, bilateral ECE; 6, seminal vesicle invasion; 7, lymph node metastasis. When multiple positive findings were seen on MRI, the highest applicable score was assigned.
On MRI, focal nodular regions of abnormal low T2-weighted signal were considered to be tumors, whereas focal nonnodular regions of abnormal low T2-weighted signal were considered to represent tumor or confounding factors, such as postbiopsy changes or prostatitis (35, 36). On MRSI, voxels in the prostate gland were considered suspicious based on elevated choline and reduced or no citrate (32, 34, 37). ECE was considered present on MRI if tumor abutted the prostate capsule and showed an irregular margin, obliteration of the rectoprostatic angle, or if there was asymmetry or direct involvement of the neurovascular bundle (34); on MRSI, ECE was identified based on tumor volume (number of contiguous voxels suspicious for cancer). Seminal vesicle, bladder, or rectal invasion was considered present if tumor was seen to extend into any part of these structures (14).
Pathology
Whole-mount transverse serial sections of the prostate were prepared as described previously (38). The primary and secondary Gleason grades as well as the pathologic tumor node stage were also determined. Tissue sections stained with H&E were examined by two uropathologists blinded to imaging and clinical data. They evaluated the histopathologic characteristics of each case, and then in consensus, they selected one representative section and block per case for the immunohistochemical analysis.
Immunohistochemistry
One pathologist did all of the immunohistochemistry. The following well-characterized antibodies and corresponding final working concentrations were used for this study (19, 39): phospho-Akt (Ser473) rabbit monoclonal antibody, clone 736E11 from Cell Signaling Technology at 1:50 dilution; AR, mouse monoclonal antibody, clone AR441 from DakoCytomation at 1:50 dilution; and Ki-67, mouse monoclonal antibody, clone MIB1 from DakoCytomation at 1:1,000 dilution. An avidin-biotin peroxidase method was used for immunohistochemical staining. Briefly, 6-μm whole-mount sections were deparaffinized in xylene and rehydrated in graded alcohol. Endogenous peroxidase was blocked by immersing slides in 0.1% PBS/H2O2 for 15 min. For antigen retrieval, slides were exposed to heating in a microwave oven and 0.01 mol/L citric acid (pH 6) for 15 min. After cooling to room temperature, appropriate blocking sera were applied for 30-min incubation followed by 4°C overnight incubation with primary antibodies. Optimal dilutions for each antibody were determined in previous experiments. After extensive washing, adequate secondary antibodies were applied for 30-min incubation followed by avidin-biotin complex for an additional 30 min. Diaminobenzidine was used as the final chromogen, and then the slides were counterstained with hematoxylin, dehydrated, and mounted.
For each molecular marker, expression was recorded as the percentage of tumor cells with positive immunostaining (25, 40). An exclusively nuclear immunoreaction was considered positive immunostaining for both AR and Ki-67, whereas phospho-Akt immunostaining was predominantly cytoplasmic and occasionally nuclear. For the phospho-Akt and AR indices, staining intensity was scored on a 0 to 2 scale (0, no or weak staining; 1, moderate staining; 2, strong staining), and the level of immunostaining was graded semiquantitatively as the product of the staining intensity score and the percentage of tumor cells with positive immunostaining (on a scale of 0-200).
Disease recurrence
Disease recurrence was defined as a serum PSA value of ≥0.4 ng/mL (confirmed by a second PSA value higher than the first by any amount), secondary therapy, or clinical recurrence (6, 41). This was the standard definition of recurrence after radical prostatectomy used at our institution (41).
Statistical analysis
To examine the correlation between the marker values, combined MRI/MRSI scores and PSA, Spearman's correlation coefficient was used. To test whether the distributions of marker values and MRI/MRSI scores were different based on clinical stage (T1 versus T2 and above) and Gleason score (6 versus 7 and above), Wilcoxon's rank sum test was used. Time to recurrence was estimated using the methods of Kaplan and Meier. To assess whether the molecular markers or combined MRI/MRSI score could accurately predict time to recurrence, we calculated the C-index using the rcorr function in the Hmisc library for R (42). Confidence intervals for the C-index were estimated from bootstrap percentile intervals using 2,000 bootstrap samples (43). To determine the incremental value of MRI/MRSI and the markers to known clinical predictors in predicting recurrence, multivariate Cox proportional hazards models were built. In the Cox models, we used the continuous data for MRI/MRSI score and all the markers. The differences between the C-indices of the various models were calculated and the confidence intervals were again estimated using 2,000 bootstrap replicate samples.
To explore potential cutoff values for each of the markers, threshold values were chosen using a minimum P value approach method similar to those described by Mazumdar and Glassman (44). For MRI/MRSI score, the cutpoint was chosen based on the most clinically useful sensitivity and specificity.
Analyses were done in Stata 9.0 for Windows (Stata Corp.) and R for Windows.7
Results
Table 1 summarizes the patient characteristics. Table 2 summarizes the relationship between the known clinical predictors (biopsy Gleason score, clinical stage, and PSA) and MRI/MRSI score and marker values. The correlation coefficients for MRI/MRSI score with each of the marker levels were 0.57 (Ki-67), 0.57 (AR), 0.64 (phospho-Akt), 0.56 (AR index), and 0.64 (phospho-Akt index), and the P values for all of these correlations were <0.0001. All of our coefficients were >0.50, indicating moderately strong correlation between the marker expression levels and MRI/MRSI score. The coefficients were also all >0, indicating a positive relationship between MRI/MRSI and the markers, meaning that as the MRI/MRSI score increased, the value of the markers also tended to increase. MRI/MRSI score and molecular markers displayed only weak associations with PSA, with correlation coefficients all below 0.30. The markers and MRI/MRSI score displayed strong associations with both clinical stage and biopsy Gleason score (P < 0.01 for all).
Table 1.
Clinical data for the 88 patients in the study
| Characteristic | n (%) |
|---|---|
| Biopsy primary Gleason grade | |
| 3 | 69 (78) |
| 4 | 18 (20) |
| 5 | 1 (1) |
| Biopsy secondary Gleason grade | |
| 3 | 68 (77) |
| 4 | 16 (18) |
| 5 | 4 (5) |
| Radical prostatectomy Gleason score | |
| No tumor | 1 (1) |
| 3+3 | 42 (48) |
| 3+4 | 18 (20) |
| 4+3 | 11 (13) |
| 4+4 | 8 (9) |
| 4+5 | 7 (8) |
| 5+4 | 1 (1) |
| Clinical stage | |
| T1C | 50(57) |
| T2A | 21 (24) |
| T2B | 9 (10) |
| T2C | 4 (4) |
| T3A | 3 (3) |
| T3B | 1 (1) |
| Median (range) | |
| Age (y) | 63 (46-79) |
| Pretreatment PSA (ng/mL) | 6.2 (2.6-76.8) |
Table 2.
Associations between MRI/MRSI, markers, and clinical predictors
| Biopsy Gleason 6 | Biopsy Gleason 7+ | |
|---|---|---|
| Median (range) | Median (range) | |
| Ki-67 | 2.5 (1-30) | 20 (2-50) |
| AR | 30 (0-90) | 70 (50-90) |
| Phospho-Akt | 20 (2-70) | 70 (40-90) |
| AR index | 30 (0-180) | 110 (50-180) |
| Phospho-Akt index | 20 (2-140) | 100 (40-160) |
| MRI/MRSI score | 2 (1-6) | 4 (3-7) |
| Low clinical stage (T1) | High clinical stage (≥T2) | |
| Ki-67 | 2 (1-30) | 20 (1-50) |
| AR | 35 (0-90) | 70 (10-90) |
| Phospho-Akt | 10 (2-70) | 60 (5-90) |
| AR index | 35 (0-180) | 80 (10-180) |
| Phospho-Akt index | 10 (2-140) | 70 (5-160) |
| MRI/MRSI score | 2 (1-4) | 4 (1-7) |
| Spearman's correlation coefficients | ||
| PSA | MRI/MRSI | |
| Ki-67 | 0.02 | 0.57 |
| AR | 0.18 | 0.57 |
| Phospho-Akt | 0.28 | 0.64 |
| AR index | 0.15 | 0.56 |
| Phospho-Akt index | 0.21 | 0.64 |
| MRI/MRSI score | 0.20 | — |
Twenty-seven (31%) patients had prostate cancer recurrence at the time of the last follow-up (Fig. 1). The median time to recurrence was not reached. The median follow-up for the patients without recurrence was 47 months. Ki-67, phospho-Akt, and AR expression levels and indices were generally higher (above the cutpoints) in patients whose cancers ultimately recurred (Table 3A-C). The C-indices for the markers ranged from 0.78 (for Ki-67) to 0.85 (for AR; Table 3B). Figure 2A to E illustrates the Kaplan-Meier curves for prediction of time to recurrence by Ki-67, AR, and phospho-Akt using selected cutpoints (the cutpoint for Ki-67 was 15%, and both AR and phospho-Akt had a cutpoint of 60%; Table 4).
Fig. 1.
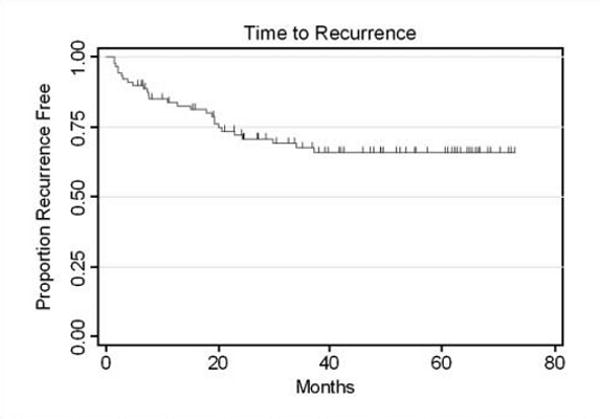
Kaplan-Meier graph showing time to recurrence.
Table 3.
Molecular marker expression levels and C-indices for molecular markers and MRI/MRSI score
| A. Medians (ranges) of marker level | ||
|---|---|---|
| Median (range) | ||
| Ki-67* | 5 (1-50) | |
| AR* | 50 (0-90) | |
| Phospho-Akt* | 40 (2-90) | |
| AR (index)† | 50 (0-180) | |
| Phospho-Akt (index)† | 40 (2-160) | |
| B. C-index for the molecular markers and MRI/MRSI | ||
| C-index (95% CI) | ||
| Ki-67 | 0.78 (0.69-0.86) | |
| AR | 0.85 (0.79-0.90) | |
| Phospho-Akt | 0.81 (0.72-0.88) | |
| AR (index) | 0.82 (0.74-0.88) | |
| Phospho-Akt (index) | 0.80 (0.72-0.88) | |
| MRI/MRSI score | 0.89 (0.86-0.93) | |
| C. C-indices from multivariate models combining MRI/MRSI score and markers | ||
| C-index (95% CI) | ||
| Model 1: PSA, stage, biopsy Gleason | 0.89 (0.82-0.96) | |
| Model 2: PSA, stage, biopsy Gleason, MRI/MRSI | 0.95 (0.89-0.97) | |
| Model 3: PSA, stage, biopsy Gleason, Ki-67, AR, phospho-Akt | 0.94 (0.89-0.97) | |
| Model 4: PSA, stage, biopsy Gleason, MRI/MRSI, Ki-67, AR, phospho-Akt | 0.97 (0.92-0.99) | |
Marker levels are recorded as the percentage of tumor cells with positive immunostaining.
Marker levels are recorded as the product of the percentage of tumor cells with positive immunostaining and the staining intensity score (on a scale of 0-200).
Fig. 2.
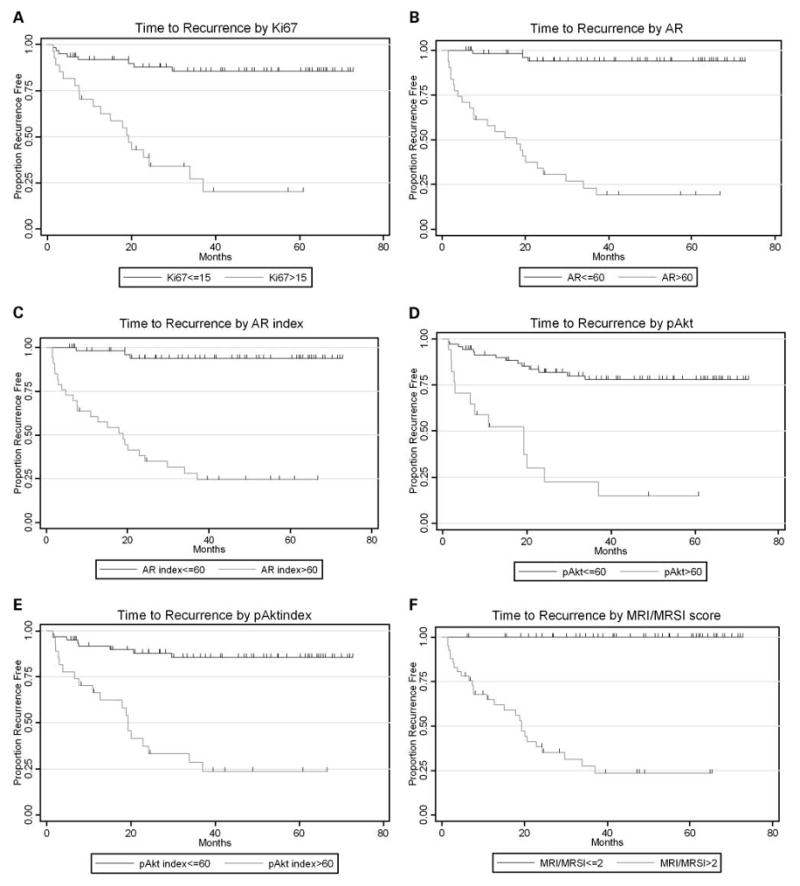
Kaplan-Meier graphs showing time to recurrence by Ki-67 expression values using cutoff of 15% positive immunohistochemical staining (A), time to recurrence by AR expression values using cutoff of 60% positive immunohistochemical staining (B), time to recurrence by AR indexing values using cutoff of 60 on the scale of 0 to 200 for immunohistochemical staining (C), time to recurrence by phospho-Akt (pAkt) expression values using cutoff of 60% positive immunohistochemical staining (D), time to recurrence by phospho-Akt indexing values using cutoff of 60 on the scale of 0 to 200 for immunohistochemical staining (E), and time to recurrence by MRI/MRSI scores (F).
Table 4.
Select cutpoints for markers and MRI/MRSI
| Marker | Cutpoint chosen* | n | Recur | Median time to recurrence (mo) |
|---|---|---|---|---|
| Ki-67 | ≤15 | 61 | 8 | N/A† |
| >15 | 27 | 19 | 19 (8-34) | |
| AR | ≤60 | 57 | 3 | N/A |
| >60 | 31 | 24 | 18 (7-24) | |
| Phospho-Akt | <60 | 71 | 14 | N/A |
| >60 | 17 | 13 | 19 (3-24) | |
| AR index | ≤60 | 55 | 3 | N/A |
| >60 | 33 | 24 | 19 (8-30) | |
| Phospho-Akt index | ≤60 | 61 | 8 | N/A |
| >60 | 27 | 19 | 19 (8-34) | |
| MRI/MRSI score | ≤2 | 47 | 0 | N/A |
| >2 | 41 | 27 | 19 (11-30) |
For Ki-67, AR, and phospho-Akt, numbers indicate the percentage of tumor cells with positive immunostaining. For AR index and phospho-Akt index, numbers represent the product of the percentage of tumor cells with positive immunostaining and the staining intensity score (on a scale of 0-200).
Median time to recurrence was not reached.
The MRI/MRSI score showed slightly better predictive accuracy than any of the molecular markers, although all the markers had fairly high C-indices (Table 3B). Figure 2F illustrates the Kaplan-Meier curves for prediction of time to recurrence by MRI/MRSI.
A Cox proportional hazards model was built to assess the incremental value of MRI/MRSI and markers to known clinical predictors. MRI/MRSI score remained an independent predictor of time to recurrence (P = 0.007); however, none of the markers achieved statistical significance at the P < 0.05 level.
The C-index for a Cox model combining the three known clinical predictors was 0.89 [95% confidence interval (95% CI), 0.82-0.96]. The C-index for the Cox model combining clinical predictors with MRI/MRSI score was 0.95 (95% CI, 0.89-0.97); when molecular markers were added to the model, the C-index increased to 0.97 (95% CI, 0.92-0.99; Table 3C). The difference between the two models containing MRI/MRSI score was very small (0.02), and the confidence interval contained zero, indicating that the addition of the markers to the MRI/MRSI score did not significantly improve prediction of recurrence.
Discussion
The ability to determine before treatment whether a patient has a high risk of recurrence after radical prostatectomy is critical for appropriate patient-specific treatment selection. Numerous elegant algorithms have been designed to predict outcome for patients with prostate cancer, including a recent preoperative nomogram predicting the 10-year probability of prostate cancer recurrence after radical prostatectomy (3–6). Inclusion of quantitatively assessed features of the actual tumor sample in such models could allow better prediction of the prognosis of the individual patient.
The role of MRI/MRSI has evolved and now includes tumor detection, staging, and treatment follow-up for patients with prostate cancer (14, 15). Cheng et al. (16) assessed the clinical utility of endorectal MRI in determining PSA outcome for patients with biopsy Gleason score 7, PSA ≤10, and clinically localized prostate cancer and found that local therapy alone seemed to be adequate for the patients with MRI stage T2 disease. On the other hand, their data suggested that more aggressive therapy was warranted in the patients with MRI T3 disease. Using artificial neural networks, Poulakis et al. (18) designed a model for predicting prostate cancer recurrence after surgery that included preoperative variables and MRI data. This model was superior to nomograms with only clinical variables but has yet to be validated. Our study provides further evidence that MRI is a powerful tool for the prediction of patient outcome.
Our studies and others have shown the importance of molecular profiles, which can be obtained from tissue samples acquired at biopsy or surgery, for understanding the biology of the tumor and predicting the outcome of treatment (19, 21, 26, 45–48). Gaston et al. (49) have shown that tissue print technologies can provide a general platform for the generation of marker maps that can be superimposed directly onto histopathologic and radiological images, permitting molecular identification and classification of individual malignant lesions.
All the markers evaluated in our study (i.e., Ki-67, phospho-Akt, and AR) showed significant predictive value for recurrence. Akt is a well-known regulator of cell survival, promoting both proliferation and antiapoptotic responses (22, 25, 27, 39). Significantly increased activation (phosphorylation) of Akt is associated with high Gleason grade prostate cancers and also with prostate cancer progression to androgen independence and poor clinical outcome (22, 25, 27, 39).
In our study, the cell proliferation antigen Ki-67 was also a good predictor of recurrence, although slightly weaker than phospho-Akt. Ki-67 has been reported to be a marker of proliferation in prostate cancer (21, 23–25, 48). Any indicator of proliferation may be expected to be a good predictor of clinical outcome because aggressive tumors have a higher proliferation rate compared with insignificant tumors. However, the rate of proliferation alone does not determine the rate of tumor growth. In the normal adult prostate, the rate of proliferation is balanced by an equal rate of apoptosis. In prostate cancer, there is increased proliferation or decreased apoptosis, or both, so that the cell number increases.
The AR is a nuclear transcription factor that mediates the actions of many steroidal hormones (21, 23, 25). The efficacy of androgen deprivation therapy seems to be mediated through the inhibition of androgen-regulated gene expression. AR staining is seen predominantly in the nuclei of epithelial and stromal cells in the normal prostate. Neoplastic areas tend to have an intermingling of AR-positive and AR-negative cells. Data from our group suggest that AR expression levels in tumor cells are important in prostate cancer growth and survival (19). In the present study, to assess the incremental value of the markers and MRI/MRSI data to clinical variables, we built Cox proportional hazards models; the model combining markers MRI/MRSI data and clinical variables had a higher C-index than the model that included only clinical variables.
We would like to point out that two of our methods of cancer assessment included evaluation of the whole prostate (step-section pathology with H&E staining and MRI), whereas one of our methods (immunohistochemical staining for molecular markers) was based on a representative sample of the gland (i.e., a single tissue section from the prostatectomy specimen). The selected section assessed by immunohistochemical staining contained either the index tumor identified on H&E staining or, if the cancer was insignificant and no index tumor could be identified, a representative tumor focus as judged by the molecular pathologist (C.C.C.).
A limitation of the study is that we do not know for certain whether the specific tumor(s) assessed by immunohistochemistry was actually identified on imaging. Nevertheless, our data show that as the MRI/MRSI score increased, so did molecular marker expression in the representative tumor lesion assessed. Our study was not about assessing tumor localization by MRI/MRSI; rather, it concerned the incremental value of MRI/MRSI and molecular markers to clinical predictors for making an overall prediction of cancer recurrence.
Our study has several other limitations. First, it was retrospective. Second, although the scoring system used was based on tumor-node-metastasis staging and developed by consensus, the development and use of a weighted scoring system would have been preferable. Third, immunohistochemical analysis was done on surgical specimens rather than biopsy samples. The use of biopsy samples was not possible, as >90% of the patients in our study had their biopsies done outside our institution. Fourth, the combined MRI/MRSI scores were given by a single radiologist who had considerable experience. A study at our own institution showed that in the detection of ECE on MRI, radiologists who specialized in genitourinary MRI did significantly better than radiologists who practiced general body MRI (50). Thus, if the radiologist interpreting MRI results in our study had been less experienced, we might have found that molecular markers contributed significant incremental value to MRI/MRSI and known clinical predictors in the Cox proportional hazards model. In addition, because our sample size was limited by the number of surgical specimens available for immunohistochemical analysis, we were not able to detect modest improvements in predictive accuracy. Fifth, there is verification bias in this study as the decision to proceed to radical prostatectomy may depend in part on the results of the MRI/MRSI. Finally, our study is limited by its clinical end point, as the natural history of biochemical recurrence after radical prostatectomy is variable and can be long (51). Freedland et al. (51) did a retrospective study of 379 men who had biochemical recurrence after radical prostatectomy and were followed for a mean of 10.3 years; their results showed that clinical parameters (PSA doubling time, pathologic Gleason score, and time from surgery to biochemical recurrence) could help risk stratify patients for prostate cancer–specific mortality following biochemical recurrence after radical prostatectomy.
In conclusion, our study shows that MRI/MRSI data and the levels of the molecular markers Ki-67, phospho-Akt, and AR correlate with each other and are moderately strongly associated with prostate cancer clinical stage and biopsy Gleason score. MRI/MRSI score and molecular markers may contribute incremental value to PSA, clinical stage, and biopsy Gleason score in predicting prostate cancer recurrence.
Acknowledgments
We thank Ada Muellner for editing the manuscript.
Grant support: NIH grant R01 CA76423.
Footnotes
Disclosure of Potential Conflicts of Interest: No potential conflicts of interest were disclosed.
References
- 1.American Cancer Society. Cancer facts and figures 2008. Atlanta (GA): American Cancer Society; 2008. [Google Scholar]
- 2.Mohler J, Babaian RJ, Bahnson RR, et al. Prostate cancer. Clinical practice guidelines in oncology. J Natl Compr Cancer Network. 2007;5:650–83. [PubMed] [Google Scholar]
- 3.Bianco FJ, Jr, Kattan MW, Scardino PT, Powell IJ, Pontes JE, Wood DP., Jr Radical prostatectomy nomograms in black American men: accuracy and applicability. J Urol. 2003;170:73–6. doi: 10.1097/01.ju.0000068037.57553.54. discussion 6-7. [DOI] [PubMed] [Google Scholar]
- 4.Graefen M, Karakiewicz PI, Cagiannos I, et al. Validation study of the accuracy of a postoperative nomogram for recurrence after radical prostatectomy for localized prostate cancer. J Clin Oncol. 2002;20:951–6. doi: 10.1200/JCO.2002.20.4.951. [DOI] [PubMed] [Google Scholar]
- 5.Kattan MW, Eastham JA, Stapleton AM, Wheeler TM, Scardino PT. A preoperative nomogram for disease recurrence following radical prostatectomy for prostate cancer. J Natl Cancer Inst. 1998;90:766–71. doi: 10.1093/jnci/90.10.766. [DOI] [PubMed] [Google Scholar]
- 6.Stephenson AJ, Scardino PT, Eastham JA, et al. Preoperative nomogram predicting the 10-year probability of prostate cancer recurrence after radical prostatectomy. J Natl Cancer Inst. 2006;98:715–7. doi: 10.1093/jnci/djj190. [DOI] [PMC free article] [PubMed] [Google Scholar]
- 7.Epstein JI. What's new in prostate cancer disease assessment in 2006? Curr Opin Urol. 2006;16:146–51. doi: 10.1097/01.mou.0000193389.31727.9b. [DOI] [PubMed] [Google Scholar]
- 8.Hayashi N, Urashima M, Kuruma H, et al. The maximum tumour length in biopsy cores as a predictor of outcome after radical prostatectomy. BJU Int. 2008;101:175–80. doi: 10.1111/j.1464-410X.2007.07189.x. [DOI] [PubMed] [Google Scholar]
- 9.Park EA, Lee HJ, Kim KG, Kim SH, Lee SE, Choe GY. Prediction of pathological stages before prostatectomy in prostate cancer patients: analysis of 12 systematic prostate needle biopsy specimens. Int J Urol. 2007;14:704–8. doi: 10.1111/j.1442-2042.2007.01795.x. [DOI] [PubMed] [Google Scholar]
- 10.Bak JB, Landas SK, Haas GP. Characterization of prostate cancer missed by sextant biopsy. Clin Prostate Cancer. 2003;2:115–8. doi: 10.3816/cgc.2003.n.019. [DOI] [PubMed] [Google Scholar]
- 11.Brat DJ, Wills ML, Lecksell KL, Epstein JI. How often are diagnostic features missed with less extensive histologic sampling of prostate needle biopsy specimens? Am J Surg Pathol. 1999;23:257–62. doi: 10.1097/00000478-199903000-00002. [DOI] [PubMed] [Google Scholar]
- 12.King CR, Long JP. Prostate biopsy grading errors: a sampling problem? Int J Cancer. 2000;90:326–30. doi: 10.1002/1097-0215(20001220)90:6<326::aid-ijc3>3.0.co;2-j. [DOI] [PubMed] [Google Scholar]
- 13.Winkler MH, Kulinskaya E, Gillatt DA. Prediction of prostate cancer in extended-field biopsies of the prostate. BJU Int. 2004;93:516–21. doi: 10.1111/j.1464-410x.2003.04670.x. [DOI] [PubMed] [Google Scholar]
- 14.Carroll PR, Coakley FV, Kurhanewicz J. Magnetic resonance imaging and spectroscopy of prostate cancer. Rev Urol. 2006;8 1:S4–10. [PMC free article] [PubMed] [Google Scholar]
- 15.Katz S, Rosen M. MR imaging and MR spectroscopy in prostate cancer management. Radiol Clin North Am. 2006;44:723–34. viii. doi: 10.1016/j.rcl.2006.07.008. [DOI] [PubMed] [Google Scholar]
- 16.Cheng GC, Chen MH, Whittington R, et al. Clinical utility of endorectal MRI in determining PSA outcome for patients with biopsy Gleason score 7, PSA < or = 10, and clinically localized prostate cancer. Int J Radiat Oncol Biol Phys. 2003;55:64–70. doi: 10.1016/s0360-3016(02)03820-8. [DOI] [PubMed] [Google Scholar]
- 17.Pucar D, Koutcher JA, Shah A, et al. Preliminary assessment of magnetic resonance spectroscopic imaging in predicting treatment outcome in patients with prostate cancer at high risk for relapse. Clin Prostate Cancer. 2004;3:174–81. doi: 10.3816/cgc.2004.n.028. [DOI] [PubMed] [Google Scholar]
- 18.Poulakis V, Witzsch U, de Vries R, et al. Preoperative neural network using combined magnetic resonance imaging variables, prostate-specific antigen, and Gleason score for predicting prostate cancer biochemical recurrence after radical prostatectomy. Urology. 2004;64:1165–70. doi: 10.1016/j.urology.2004.06.030. [DOI] [PubMed] [Google Scholar]
- 19.Cordon-Cardo C, Kotsianti A, Verbel DA, et al. Improved prediction of prostate cancer recurrence through systems pathology. J Clin Invest. 2007;117:1876–83. doi: 10.1172/JCI31399. [DOI] [PMC free article] [PubMed] [Google Scholar]
- 20.Saidi O, Cordon-Cardo C, Costa J. Technology insight: will systems pathology replace the pathologist? Nat Clin Pract Urol. 2007;4:39–45. doi: 10.1038/ncpuro0669. [DOI] [PubMed] [Google Scholar]
- 21.Kumar-Sinha C, Chinnaiyan AM. Molecular markers to identify patients at risk for recurrence after primary treatment for prostate cancer. Urology. 2003;62 1:19–35. doi: 10.1016/j.urology.2003.10.007. [DOI] [PubMed] [Google Scholar]
- 22.Malik SN, Brattain M, Ghosh PM, et al. Immunohistochemical demonstration of phospho-Akt in high Gleason grade prostate cancer. Clin Cancer Res. 2002;8:1168–71. [PubMed] [Google Scholar]
- 23.Quinn DI, Henshall SM, Sutherland RL. Molecular markers of prostate cancer outcome. Eur J Cancer. 2005;41:858–87. doi: 10.1016/j.ejca.2004.12.035. [DOI] [PubMed] [Google Scholar]
- 24.Rubio J, Ramos D, Lopez-Guerrero JA, et al. Immunohistochemical expression of Ki-67 antigen, cox-2 and Bax/Bcl-2 in prostate cancer; prognostic value in biopsies and radical prostatectomy specimens. Eur Urol. 2005;48:745–51. doi: 10.1016/j.eururo.2005.06.014. [DOI] [PubMed] [Google Scholar]
- 25.Shimizu Y, Segawa T, Inoue T, et al. Increased Akt and phosphorylated Akt expression are associated with malignant biological features of prostate cancer in Japanese men. BJU Int. 2007;100:685–90. doi: 10.1111/j.1464-410X.2007.07014.x. [DOI] [PubMed] [Google Scholar]
- 26.Troyer DA, Mubiru J, Leach RJ, Naylor SL. Promise and challenge: markers of prostate cancer detection, diagnosis and prognosis. Dis Markers. 2004;20:117–28. doi: 10.1155/2004/509276. [DOI] [PMC free article] [PubMed] [Google Scholar]
- 27.Wendel HG, De Stanchina E, Fridman JS, et al. Survival signalling by Akt and eIF4E in oncogenesis and cancer therapy. Nature. 2004;428:332–7. doi: 10.1038/nature02369. [DOI] [PubMed] [Google Scholar]
- 28.Akin O, Sala E, Moskowitz CS, et al. Transition zone prostate cancers: features, detection, localization, and staging at endorectal MR imaging. Radiology. 2006;239:784–92. doi: 10.1148/radiol.2392050949. [DOI] [PubMed] [Google Scholar]
- 29.Wang L, Hricak H, Kattan MW, Chen HN, Scardino PT, Kuroiwa K. Prediction of organ-confined prostate cancer: incremental value of MR imaging and MR spectroscopic imaging to staging nomograms. Radiology. 2006;238:597–603. doi: 10.1148/radiol.2382041905. [DOI] [PubMed] [Google Scholar]
- 30.Shukla-Dave A, Hricak H, Moskowitz C, et al. Detection of prostate cancer with MR spectroscopic imaging: an expanded paradigm incorporating polyamines. Radiology. 2007;245:499–506. doi: 10.1148/radiol.2452062201. [DOI] [PubMed] [Google Scholar]
- 31.Zakian KL, Sircar K, Hricak H, et al. Correlation of proton MR spectroscopic imaging with Gleason score based on step-section pathologic analysis after radical prostatectomy. Radiology. 2005;234:804–14. doi: 10.1148/radiol.2343040363. [DOI] [PubMed] [Google Scholar]
- 32.Kurhanewicz J, Vigneron DB, Hricak H, Narayan P, Carroll P, Nelson SJ. Three-dimensional H-1 MR spectroscopic imaging of the in situ human prostate with high (0.24-0. 7-cm3) spatial resolution Radiology. 1996;198:795–805. doi: 10.1148/radiology.198.3.8628874. [DOI] [PubMed] [Google Scholar]
- 33.Males RG, Vigneron DB, Star-Lack J, et al. Clinical application of BASING and spectral/spatial water and lipid suppression pulses for prostate cancer staging and localization by in vivo 3D 1H magnetic resonance spectroscopic imaging. Magn Reson Med. 2000;43:17–22. doi: 10.1002/(sici)1522-2594(200001)43:1<17::aid-mrm3>3.0.co;2-6. [DOI] [PubMed] [Google Scholar]
- 34.Yu KK, Scheidler J, Hricak H, et al. Prostate cancer: prediction of extracapsular extension with endorectal MR imaging and three-dimensional proton MR spectroscopic imaging. Radiology. 1999;213:481–8. doi: 10.1148/radiology.213.2.r99nv26481. [DOI] [PubMed] [Google Scholar]
- 35.Qayyum A, Coakley FV, Lu Y, et al. Organ-confined prostate cancer: effect of prior transrectal biopsy on endorectal MRI and MR spectroscopic imaging. AJR Am J Roentgenol. 2004;183:1079–83. doi: 10.2214/ajr.183.4.1831079. [DOI] [PubMed] [Google Scholar]
- 36.Shukla-Dave A, Hricak H, Eberhardt SC, et al. Chronic prostatitis: MR imaging and 1H MR spectroscopic imaging findings–initial observations. Radiology. 2004;231:717–24. doi: 10.1148/radiol.2313031391. [DOI] [PubMed] [Google Scholar]
- 37.Zakian KL, Eberhardt S, Hricak H, et al. Transition zone prostate cancer: metabolic characteristics at 1H MR spectroscopic imaging–initial results. Radiology. 2003;229:241–7. doi: 10.1148/radiol.2291021383. [DOI] [PubMed] [Google Scholar]
- 38.Aihara M, Wheeler TM, Ohori M, Scardino PT. Heterogeneity of prostate cancer in radical prostatectomy specimens. Urology. 1994;43:60–6. doi: 10.1016/s0090-4295(94)80264-5. discussion 6-7. [DOI] [PubMed] [Google Scholar]
- 39.Hernando E, Charytonowicz E, Dudas ME, et al. The AKT-mTOR pathway plays a critical role in the development of leiomyosarcomas. Nat Med. 2007;13:748–53. doi: 10.1038/nm1560. [DOI] [PubMed] [Google Scholar]
- 40.Drobnjak M, Melamed J, Taneja S, et al. Altered expression of p27 and Skp2 proteins in prostate cancer of African-American patients. Clin Cancer Res. 2003;9:2613–9. [PubMed] [Google Scholar]
- 41.Stephenson AJ, Kattan MW, Eastham JA, et al. Defining biochemical recurrence of prostate cancer after radical prostatectomy: a proposal for a standardized definition. J Clin Oncol. 2006;24:3973–8. doi: 10.1200/JCO.2005.04.0756. [DOI] [PubMed] [Google Scholar]
- 42.Harrell FE, Jr, Califf RM, Pryor DB, Lee KL, Rosati RA. Evaluating the yield of medical tests. JAMA. 1982;247:2543–6. [PubMed] [Google Scholar]
- 43.Efron B, Tibshirani RJ. An introduction to the bootstrap. New York: Chapman & Hall/CRC; 1993. [Google Scholar]
- 44.Mazumdar M, Glassman JR. Categorizing a prognostic variable: review of methods, code for easy implementation and applications to decision-making about cancer treatments. Stat Med. 2000;19:113–32. doi: 10.1002/(sici)1097-0258(20000115)19:1<113::aid-sim245>3.0.co;2-o. [DOI] [PubMed] [Google Scholar]
- 45.Cohen BL, Gomez P, Omori Y, et al. Cyclooxygenase-2 (COX-2) expression is an independent predictor of prostate cancer recurrence. Int J Cancer. 2006;119:1082–7. doi: 10.1002/ijc.21749. [DOI] [PubMed] [Google Scholar]
- 46.de la Taille A, Buttyan R, Benson MC, Katz AE. The role of tumor biomarkers as predictors of serum PSA recurrence after radical prostatectomy. Semin Urol Oncol. 1998;16:137–44. [PubMed] [Google Scholar]
- 47.Revelos K, Petraki C, Gregorakis A, Scorilas A, Papanastasiou P, Koutsilieris M. Immunohistochemical expression of Bcl2 is an independent predictor of time-to-biochemical failure in patients with clinically localized prostate cancer following radical prostatectomy. Anticancer Res. 2005;25:3123–33. [PubMed] [Google Scholar]
- 48.Revelos K, Petraki C, Gregorakis A, et al. p27 (kip1) and Ki-67 (MIB1) immunohistochemical expression in radical prostatectomy specimens of patients with clinically localized prostate cancer. In Vivo. 2005;19:911–20. [PubMed] [Google Scholar]
- 49.Gaston SM, Soares MA, Siddiqui MM, et al. Tissue-print and print-phoresis as platform technologies for the molecular analysis of human surgical specimens: mapping tumor invasion of the prostate capsule. Nat Med. 2005;11:95–101. doi: 10.1038/nm1169. [DOI] [PubMed] [Google Scholar]
- 50.Mullerad M, Hricak H, Wang L, Chen HN, Kattan MW, Scardino PT. Prostate cancer: detection of extracapsular extension by genitourinary and general body radiologists at MR imaging. Radiology. 2004;232:140–6. doi: 10.1148/radiol.2321031254. [DOI] [PubMed] [Google Scholar]
- 51.Freedland SJ, Humphreys EB, Mangold LA, et al. Risk of prostate cancer-specific mortality following biochemical recurrence after radical prostatectomy. JAMA. 2005;294:433–9. doi: 10.1001/jama.294.4.433. [DOI] [PubMed] [Google Scholar]