Abstract
The medical linear accelerator (linac) integrated with a kilovoltage (kV) flat-panel imager has been emerging as an important piece of equipment for image-guided radiation therapy. Due to the sagging of the linac head and the flexing of the robotic arms that mount the x-ray tube and flat-panel detector, geometric nonidealities generally exist in the imaging geometry no matter whether it is for the two-dimensional projection image or three-dimensional cone-beam computed tomography. Normally, the geometric parameters are established during the commissioning and incorporated in correction software in respective image formation or reconstruction. A prudent use of an on-board imaging system necessitates a routine surveillance of the geometric accuracy of the system like the position of the x-ray source, imager position and orientation, isocenter, rotation trajectory, and source-to-imager distance. Here we describe a purposely built phantom and a data analysis software for monitoring these important parameters of the system in an efficient and automated way. The developed tool works equally well for the megavoltage (MV) electronic portal imaging device and hence allows us to measure the coincidence of the isocenters of the MV and kV beams of the linac. This QA tool can detect an angular uncertainty of 0.1° of the x-ray source. For spatial uncertainties, such as the source position, the imager position, or the kV∕MV isocenter misalignment, the demonstrated accuracy of this tool was better than 1.6 mm. The developed tool provides us with a simple, robust, and objective way to probe and monitor the geometric status of an imaging system in a fully automatic process and facilitate routine QA workflow in a clinic.
INTRODUCTION
The integration of on-board kilovoltage (kV) flat-panel imager to a medical linear accelerator has recently been realized by linac vendors1, 2, 3, 4 for image-guided radiation therapy (IGRT). These on-board imagers are mounted on robotic arms with an axis orthogonal to the megavoltage beam.5 An on-board imager offers three modes of acquisitions namely: (1) Two-dimensional (2D) planar projection image (radiographic acquisition); (2) 2D planar fluoroscopic image (fluoroscopic acquisition); and (3) three-dimensional (3D) cone-beam computed tomography (CBCT). The radiographic acquisition is used for 2D-2D matching with the digital reconstructed radiograph (DRR) for setup verification based on the bony landmarks or implanted fiducials.1, 6 The fluoroscopic acquisition is employed for verifying the gating threshold or target position prior to a respiratory-gated treatment.7 The CBCT is used for 3D-3D matching with the planning CT for setup verification.8, 9, 10, 11 The geometric information of a patient derived from any of these modes relies on the configuration of the imager geometry, such as the position of the x-ray source, imager position and orientation, isocenter, and focus-to-imager distance. The functionality of the system depends heavily on the mechanical integrity and stability of the imaging device (the x-ray tube, imager and robotic arms) and the linac (on which the imaging system is mounted) at various gantry angles. This is particularly crucial for the flat-panel based CBCT that is mounted on an already laden gantry of a linac. The gantry sagging, together with the flexing of the imaging system, results in geometric nonidealities during the gantry rotation in CBCT acquisition.10, 12 The accurate reconstruction of transaxial slices of a 3D object from a set of 2D projections requires the x-ray source position and the detector orientation to be known precisely in 3D space in the rotation trajectory during the CBCT reconstruction.10, 13, 14, 15 These geometric parameters are generally established through a geometrical calibration process done during the commissioning of the new machine and incorporated in image formation or reconstruction for correction.10, 16 A prudent use of an on-board imaging system necessitates a routine surveillance of geometric accuracy of the system. This echoes to what Yoo et al.17 have pointed out that the most crucial part of a comprehensive QA program on an on-board imager would be those tests monitoring the geometric accuracy and stability of the imaging system. The recommendation by Yoo et al.17 on these tests is based on imaging a small cube phantom embedded with a central fiducial at orthogonal gantry angles and manually measuring the discrepancy between the recorded position of the fiducial and the digital graticule. This method is straightforward yet subjective due to the manual measurement. Furthermore, it is unable to give a full picture of the geometric status of the imaging system.
In research involving micro-CBCT, several geometric phantoms and associated analysis software have been developed for the geometric calibration and QA.14, 18 A modification and an extension of its methodology might be warranted for the geometric QA of the on-board imaging system. Studies have also reported on the use of projection images of simple phantoms embedded with multiple fiducials to estimate the geometric parameters of the on-board imaging system,12, 19 however the geometric parameters that can be estimated implicitly from the projection images have not been fully extracted due to the limitations in the design of the phantoms or associated data analysis software.
The purpose of the present work is to design a geometric QA phantom and develop an automated data analysis software to assess the geometric accuracy of an on-board imager, including the x-ray source position, the detector position and orientation, the isocenter, the rotation trajectory, and the source-to-imager distance (SID), from the projection images of the phantom. The developed phantom and analysis software apply equally well to the geometric QA of the MV electronic portal imaging device (EPID), and allow us to measure the coincidence of the isocenters of the MV and kV beams, which is an important parameter in ensuring that the treatment beam is targeting to where the imaging is guiding. The geometric QA procedure using this phantom, together with the automation of the data analysis, greatly facilitates the QA workflow and eliminates the subjectivity incurred in the manual measurement and result interpretation.
METHODS AND MATERIALS
Phantom design
An in-house software developed with the MatLab (MathWorks, Inc., Natick, MA) was used to simulate the projection image of an object with designated imaging geometry defined by the position of the source, position and orientation of the imager, and source-to-imager distance at any gantry angle. Virtual cubic phantoms (instead of physical phantoms) of various dimensions from 10 to 25 cm with 9, 13, 17 fiducials arranged in a helical trajectory at the surfaces were designed. These virtual phantoms served as inputs into the simulation program to simulate the projection images obtained at different gantry angles. The helical arrangement of the fiducials was chosen because it gave a good distribution of the fiducials in 3D space and offered the least superposition of the fiducials in the projection images obtained from different gantry angles for easy detection and identification. Nonuniform helical increments (pitches) along the helical axis were used to further spare the fiducial projections.
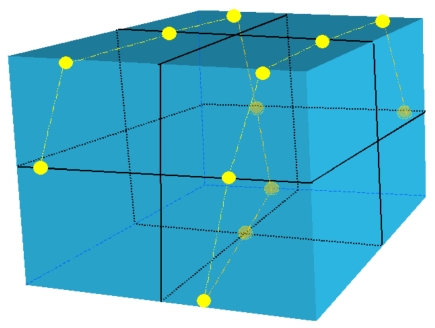
Simulated projection images were created for each virtual phantom at every 30° of gantry angles. The phantom design, including the size and fiducial locations, was determined by maximizing the detection efficiency and sensitivity of fiducials to a change in imaging geometry. Based on the findings from the simulation, a cubic phantom measuring 18×18×18 cm3 with 13 steel ball bearings (BBs) of diameter 4.76 mm was fabricated. The BBs were embedded in the surface of the phantom in a skewed helical trajectory as shown in Fig. 1. The outside surface of every BB was tangential to the surface of the phantom ensuring that all BBs were protected from possible displacement or wearing during setup or handling. Orthogonal lines were scribed on the surfaces of the phantom to indicate the center of the cube at the intersection of these lines. This phantom was termed as gQA phantom hereafter for easy reference.
Figure 1.
The gQA phantom with 13 steel ball bearings (BBs) mounted on the surfaces in a skewed helical trajectory.
Reference coordinate system
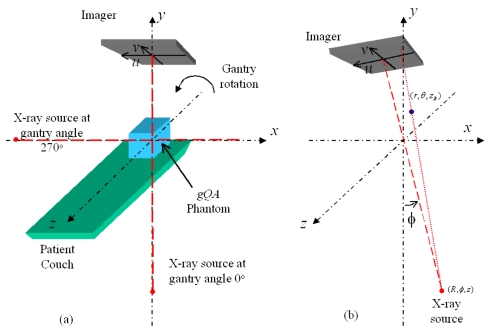
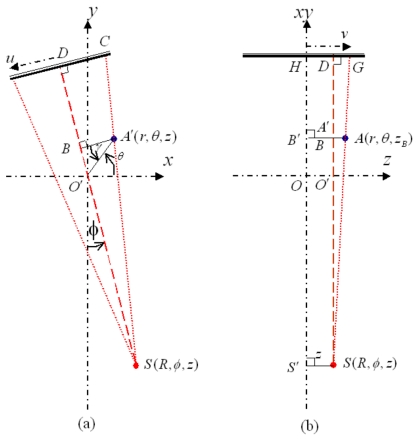
To describe the geometry of the imaging system, a Cartesian phantom coordinate system was introduced. This coordinate system is attached to the phantom and aligned in space to an ideal linac with a rotating gantry. The z axis is along the rotation axis of the gantry, the x axis is horizontal, and y axis is vertical [Fig. 2a]. The origin is referred to the intersection of the laser alignments.
Figure 2.
Schematic representation of the phantom coordinate system (a), and the position of the x-ray source and a fiducial in the cylindrical coordinate system (b).
For a gantry angle ϕ (which also indicates the x-ray source angle), the position of the x-ray source (R,ϕ,z) is conveniently defined in a phantom fixed cylindrical coordinate which has the same origin and z axis of the phantom coordinate system, where R is the radius of the source rotation circle or the source-to-axis distance (SAD). A fiducial at (r,θ,zB) is projected on the imager (u,v) [Fig. 2b] with
| (1) |
| (2) |
where (u,v) defines an imager fixed coordinate system which rotates with the gantry. The imager center is the origin of the uv plane. The focal distance (F) is the SID. Details on how to derive Eqs. 1, 2 are summarized in Appendix A. Considering the variations (Δϕ, ΔR, ΔF, Δu, and Δv) of the geometric parameters (ϕ, R, F, u, and v), the projections become
| (3) |
| (4) |
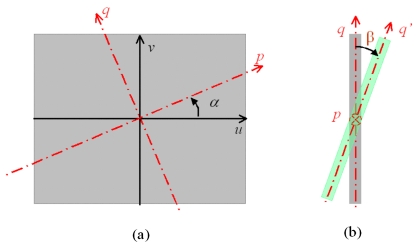
Assuming that the imager might be tilted along an imaginary axis p, which is at an angle α with u axis, the imaginary axes are defined as p and q, respectively, on the uv plane as shown in Fig. 3a. The transformation between coordinates (p,q) and (u,v) is
| (5) |
Figure 3.
Schematic diagram showing the tilting of the imager. The imager (uv plane) tilts along an imaginary axis p (a) and the tilting angle is defined as β (b).
Further taking the tilted angle β into consideration [Fig. 3b], a new axis q′ is defined accordingly with
| (6) |
In obtaining the above equation, it was assumed that the tilting angle is small (<15°). Please refer to Appendix B for the derivation of Eq. 6.
It follows that the new projected coordinates (uI,vI) of the fiducial on a tilted imager are
| (7) |
Automated analysis software
From a projected image of the fiducials at a given gantry angle, eight geometric parameters could be quantitatively evaluated. These are: (1) Three parameters for the x-ray source position, namely the deviation of the gantry angle (Δϕ), the deviation of rotation radius (ΔR), and the deviation from the rotation plane (Δz); (2) three parameters for the position of the imager center, namely the deviation of the focal distance (ΔF), and the two translational offsets (Δu and Δv) in the uv plane; (3) two angular parameters (α and β) for the imager orientation.
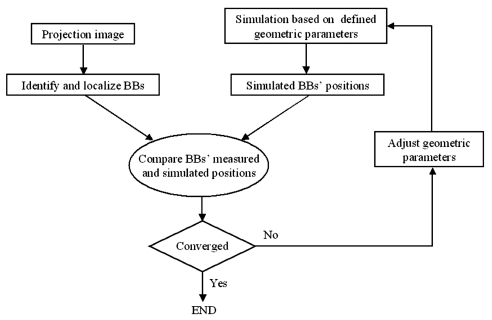
An analysis software in C language was developed to estimate the eight parameters at any given gantry angle by comparing the measured and simulated BB locations in an iterative manner. The newly adjusted geometric parameters for the simulated BB location served as the inputs for the iteration (Fig. 4). The analysis software first identified and measured the BB locations from the projection image in the presence of random background noise by intensity weighted averaging using
| (8) |
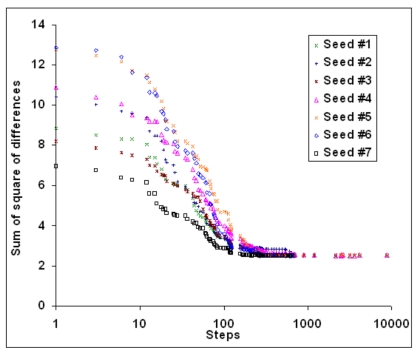
where Ii was the signal intensity of the pixel number i.20 The software then determined the geometric parameters by minimizing the difference between the BBs measured and simulated locations from the simulation results based on Eqs. 3, 4, 5, 6, 7. For this purpose, the distance between the positions of the measured BB and its corresponding simulated BB was computed. The summation of these distances for all the BBs was used as the converging criterion for the optimization process. A hybrid optimization algorithm was adopted for this eight-parameter nonlinear optimization problem. Exhaustive search was applied first and possible solutions were compared in order to find the best 1000 seeds of parameter combinations for the simulated annealing algorithm to start with. Each step of the simulated annealing algorithm replaced the current solution by a random “nearby” solution chosen with a probability that depends on the difference between the corresponding function value and a global parameter (called the annealing temperature).21, 22, 23, 24 The annealing temperature gradually decreased during the process. Finally the progress converged to the best estimate of the geometric parameters. Figure 5 illustrates several converging curves during the simulated annealing processes in analyzing a typical projection. This tool took about half a minute to analyze one projection image on a personal computer (DELL Precision 470 Workstation, 3.4 GHz CPU and 4 GB RAM). Typically, the sum of square distance differences converged to about 2.5 mm2. The average discrepancy for one fiducial was about 0.44 mm , which was around the size of an imager pixel.
Figure 4.
Flow chart showing the algorithm of the analysis software.
Figure 5.
Typical optimization converging curves.
Experimental evaluation
The developed gQA phantom and the automated analysis software (collectively called the gQA tool) were tested on a Varian Trilogy linac (Varian Medical Systems, Palo Alto, CA). The Trilogy is equipped with two image acquisition systems (IAS3): (1) MV EPID and (2) kV on-board imaging system (OBI). Both systems have a flat-panel detector with a matrix dimension of 1024×768. The physical pixel sizes of the MV and kV imagers are 0.392 and 0.388 mm, respectively. The Trilogy is routinely maintained, and all the operating parameters are monitored and assured through a comprehensive QA program as suggested by TG 40.25 The center of the gQA phantom was positioned at the nominal treatment isocenter as indicated by the room lasers. The relationship between the intersection of the room lasers and the mechanic isocenter of the linac was assumed to be maintained and calibrated in accordance with the routine QA practice.25
Reproducibility of the analysis results
Projection images were acquired for MV EPID at a gantry angle of 0° (Varian convention) and at a SID of 1500 mm, the values were nominal. To ensure the gQA tool functions properly in the worst-case scenario, the MV EPID was chosen here because the image quality of the MV acquisition was relatively inferior compared to that of the kV OBI. A 6 MV beam and 25 monitor units were used. The field size was 26×20 cm2. Twenty-one projections, 1 min apart, were made with the same imaging geometry and fed into the analysis software tool to estimate the geometric parameters of the imaging system. Although the 21 projection images were acquired under the same condition, they were associated with different random background noise. The purpose of this evaluation was to assess the reproducibility of the analysis results under different noisy environments.
Minimum detectable change in gantry angle
With the same setup, four projection images at nominal gantry angles of 0°, 0.1°, 0.2°, and 0.5° were taken. The projection images at nominal gantry angles of 0.1°, 0.2°, and 0.5° were subtracted from the one of 0° gantry angle to show the difference between the projection images made at slightly different angles. The purpose of this evaluation was to demonstrate the minimum change in gantry angle that could be detected from the projection image of the BBs.
Gantry angle offset
Further projection images were taken at nominal gantry angles of 0°, ±0.1°, ±0.2°, ±0.3°, ±0.5°, and ±1.0°. This narrow range of gantry angle was chosen because an offset would affect a small gantry angle more than a large one. These images were then analyzed. The discrepancies between the nominal and estimated gantry angles were then compared in order to determine the gantry angle offset.
SID offset
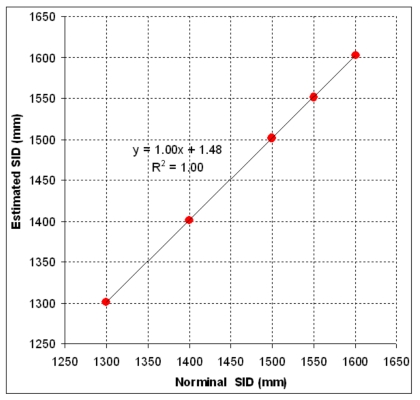
Projection images were further acquired for MV EPID at a gantry angle of 180° but at different nominal SID of 1300, 1400, 1500, 1550, and 1600 mm. The best estimate of the SID was found by the analysis software. The discrepancies between the nominal and estimated SID were then compared in order to determine the SID offset.
Imager center offset
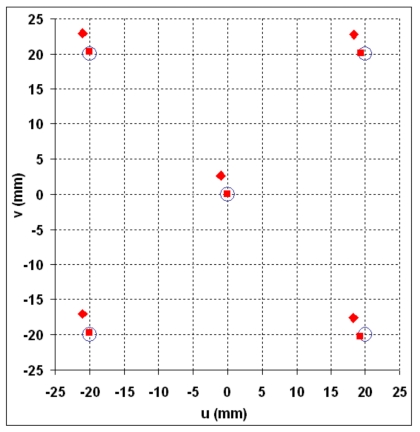
With the SID reset to 1500 mm, projection images were acquired with the imager center at (0, 0) and offset to (20, 20), (20,−20), (−20,−20), and (−20,20) mm in the uv plane. The best estimate of the detector shift was found by the analysis software. The discrepancies between the actual and estimated offsets with and without systematic drift correction were then compared in order to determine the imager center offset.
Phantom positional shift
With the imager center reset to the origin, the gQA phantom was displaced −5.0 mm in each of the x, y, and z directions simultaneously. This was to mimic a condition where there were spatial drifts in the imaging geometry (ΔR,Δz,ΔF,Δu,Δv) in 3D space. When the phantom position was shifted, the whole imaging system, including the source and imager position, was shifted in the opposite direction from the phantom’s point of view. Projection images were then acquired at a SID of 1500 mm with gantry angles at 0°, 90°, 180°, and 270°. The same set of projection images was repeated with the phantom displaced 5.0 mm in the x,y,z direction and 10.0 mm in the same direction as well. The geometric parameters corresponding to these changes were estimated by the analysis software. The purpose of this evaluation was to demonstrate the accuracy of the gQA tool in detecting the variations in the imaging geometry.
Coincidence of the isocenters for the MV and kV beams
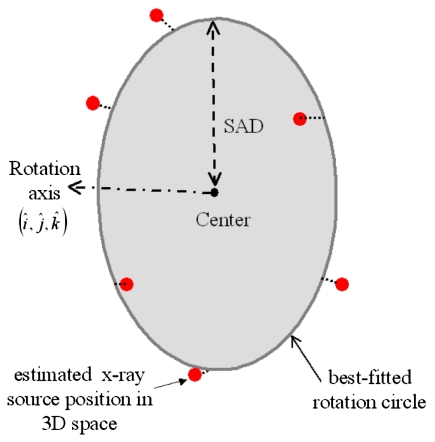
The center of the gQA phantom was repositioned at the nominal treatment isocenter as indicated by the room lasers. Projection images were acquired for MV EPID at every 10° of gantry angle for 360° and at a SID of 1500 mm resulting in 36 projection images in total. Projection images were also acquired for the OBI at every 0.56° of gantry angle for 360° and at a SID of 1500 mm resulting in 640 projection images in total (i.e. CBCT acquisition mode). The exposure factors were 125 kVp, 2 mAs, and the field size was 26×20 cm2 for the OBI projection image. The eight geometric parameters for each series of projected images were estimated and the variation of each parameter for the full gantry rotation was examined. For each series of data, a best-fitted rotation circle was found such that it had the shortest distances (the least sum distance square) from all estimated x-ray sources in 3D space. The direction of the rotation circle was denoted by the unit vectors , and its radius (SAD) was calculated. The rotation circle was taken as the rotation trajectory of the imaging system and its center as the isocenter (Fig. 6). The isocenters for the MV and kV beams were then found and compared.
Figure 6.
Schematic diagram showing a best fitted rotation circle that has the shortest distances (the least sum distance square) from all the estimated x-ray sources in 3D space. The center of this circle is taken as the isocenter of the gantry rotation.
Relationship among various geometric parameters
A change in one geometric parameter, for instance, the gantry angle, might affect other parameters of the imaging system as the whole imaging assembly is mounted on a laden gantry and robotic arms. There might be a subtle relationship between these parameters depending on the actual configuration and position of the imaging system. We studied this issue by scrutinizing the data obtained in Sec. 2D7 in which the projection images were acquired at different gantry angles. The aim was to see the changes in other parameters brought by the change in the gantry angle. We limited the studied range to be in ±45° because, beyond this range, the sagging of the gantry might overwhelm the subtle relationship amongst the different parameters. Furthermore, we studied the changes in parameters brought about by the specific parameter we varied in other evaluations such as in SID offset and imager off center (Secs. 2D4, 2D5). All the results were compiled in a table to show the changes.
RESULTS
Reproducibility of the analysis results
Table 1 shows the variations of each of the eight geometric parameters of the MV imaging system for the 21 projection images with different background noise. The small standard deviation of each estimated geometric parameter indicated a good agreement of the data and the analysis results were highly reproducible. The imager center offset (Δu,Δv) was up to (−0.63 mm,1.67 mm), which was due to a systematic drift of the MV imager.
Table 1.
The variations of each of the eight geometric parameters of the imaging system for the 21 projection images with different background noise. Δϕ, ΔR, and Δz are the deviations of the gantry angle, rotation radius and deviation from the rotation plane, respectively. ΔF, Δu, and Δv are the deviations of the source-to-detector distance, and the two translational offsets of the detector in the uv plane, respectively; a and β describe the orientation of the imager.
| Δϕ (°) | ΔR (mm) | Δz (mm) | ΔF (mm) | Δu (mm) | Δv (mm) | α (°) | β (°) | |
|---|---|---|---|---|---|---|---|---|
| Min. | −0.39 | −0.69 | 0.03 | −0.48 | −0.65 | 1.63 | −0.28 | −1.00 |
| Max. | −0.35 | −0.52 | 0.10 | −0.24 | −0.61 | 1.71 | −0.11 | −0.92 |
| Mean | −0.37 | −0.59 | 0.06 | −0.37 | −0.63 | 1.67 | −0.22 | −0.98 |
| SD | 0.01 | 0.04 | 0.02 | 0.06 | 0.01 | 0.02 | 0.05 | 0.02 |
Minimum detectable change in gantry angle
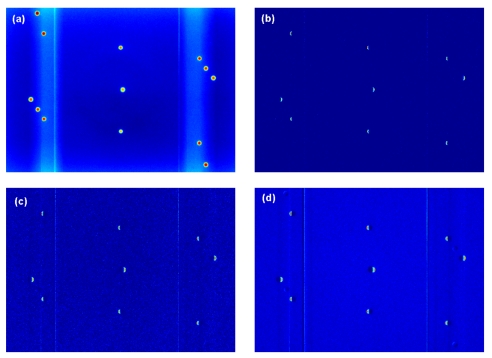
Figure 7a shows the projection image at gantry angle 0°. Figures 7b, 7c, 7d show the image subtractions of the projection images at the gantry angles 0.1°, 0.2°, and 0.5° from that at 0°, respectively. From the subtraction images, 9 out of 13 BBs’ locations showed residual values indicating that 4 BBs were not differentiated by the projections made with small gantry angle changes and were totally subtracted out. In other words, there still remained 9 BBs that were “sensitive” enough to show the gantry change down to 0.1°.
Figure 7.
(a) The projection image of the gQA phantom at gantry angle 0°. (b)–(d) show the image subtractions of the projection images at gantry angles 0.1°, 0.2°, and 0.5° from that at gantry angle 0°, respectively.
Gantry angle offset
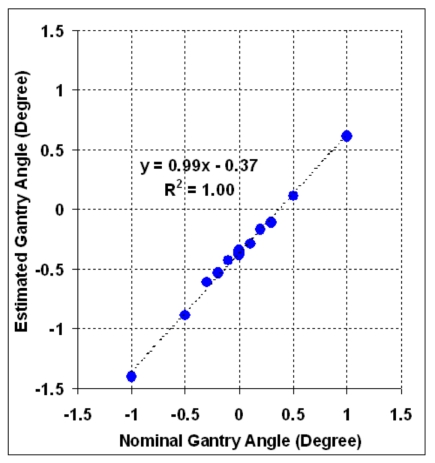
Figure 8 depicts the correlation of the nominal and estimated gantry angles in the range of ±1°. The coefficient of determination (R2) of 1.00 shows a very good correlation between the two angles. From the regression line, a residual angle offset of 0.37° is evident for the nominal value of the gantry angle in the range studied.
Figure 8.
The correlation of the nominal and estimated gantry angles in the range of ±1°.
SID offset
Figure 9 shows the correlation of the nominal and estimated SID in the range of 1300–1600 mm. The R2 of 1.00 shows an almost perfect linearity between nominal and estimated SID. The regression line indicates that there is a consistent offset of 1.48 mm to the nominal SID in the range studied.
Figure 9.
The correlation of the nominal and estimated source-to-imager distance (SID) at a gantry angle of 180°.
Imager center offset
Figure 10 shows the actual and estimated offset positions of the MV imager center on the (u,v) imager coordinate plane. A systematic drift of the detector was noted as observed in the previous evaluation II.D.1. If this systematic drift was corrected, the net estimated offset positions of the imager were close to the actual offsets within ±1 mm.
Figure 10.
The estimated shift (◆) and estimated shift after the correction of the systematic drift (◼) compared to the actual offset of imager center (○) on the (u,v) imager coordinate plane.
Phantom positional shift
Table 2 lists the estimated relative shifts of the imaging geometry for the displaced phantoms with different magnitudes of displacement at the four principal orthogonal gantry angles. Depending on the gantry angle, ΔR, Δz, ΔF, Δu, and Δv reflected the displacement of the phantom in each of the x,y,z directions. The signs of the variations depend on the relative position between the phantom and the imaging system governed by the gantry angle. The maximum discrepancy between the actual and estimated shift was less than 1.6 mm (1.6=|10−8.4|), which came from the differences between phantom shift of 10 mm and the estimated ΔR.
Table 2.
The estimated relative drifts of the imaging geometry for the displaced phantoms with different magnitudes of displacement at four principal orthogonal gantry angles. ΔR, Δz, and ΔF are the deviation of the rotation radius, deviation from the rotation plane and deviations of the source-to-detector distance, respectively. Δu and Δv are the two translational offsets of the detector in the uv plane, respectively.
| Phantom shift (mm) | Gantry angle (°) | ΔR (mm) | Δz (mm) | ΔF (mm) | Δu (mm) | Δv (mm) |
|---|---|---|---|---|---|---|
| Δx=−5.0 Δy=−5.0 Δz=−5.0 | 0 | 3.7 | −5.4 | −0.2 | 4.6 | 5.3 |
| 90 | 4.5 | −5.1 | 0.0 | −3.9 | 5.4 | |
| 180 | −4.2 | −5.4 | −0.2 | −4.5 | 5.3 | |
| 270 | −4.6 | −5.6 | 0.1 | 4.0 | 5.2 | |
| Δx=5.0 Δy=5.0 Δz=5.0 | 0 | −5.6 | 4.6 | 0.0 | −4.6 | −4.8 |
| 90 | −4.5 | 4.8 | 0.0 | 5.6 | −4.8 | |
| 180 | 5.4 | 4.8 | −0.2 | 4.7 | −4.8 | |
| 270 | 4.9 | 4.7 | 0.2 | −5.5 | −4.8 | |
| Δx=10.0 Δy=10.0 Δz=10.0 | 0 | −8.4 | 9.7 | 0.0 | −9.7 | −9.9 |
| 90 | −9.2 | 10.2 | 0.2 | 8.6 | −9.8 | |
| 180 | 8.4 | 10.4 | −0.3 | 9.5 | −9.6 | |
| 270 | 9.9 | 8.9 | −0.4 | −8.4 | −10.4 |
Coincidence of the isocenters for the MV and kV beams
Table 3 lists the variation of each of the eight geometric parameters estimated for the MV EPID and kV OBI for a complete gantry rotation. The standard deviation of each estimated geometric parameter for the MV EPID and kV OBI were small indicating a good agreement of the same geometric parameter at different gantry angles. The orientations of the MV and kV rotation plane were found to be (0.00010, 0.00006, 1.00000) and (0.00030, 0.00001, 1.00000), respectively. The estimated isocenters for the MV and kV beams were at (−0.95,−0.84,−0.25) mm and (−0.97,−1.21,−0.13) mm in the reference coordinate. The coincidence of the two isocenters was well within 0.5 mm.
Table 3.
The variations of each of the eight geometric parameters of the MV∕kV imaging systems from projections acquired through a complete gantry rotation. Δϕ, ΔR, and Δz are the deviations of the gantry angle, rotation radius and deviation from the rotation plane, respectively. ΔF, Δu, and Δv are the deviations of the focal distance, and the two translational offsets of the detector in the uv plane, respectively.
| Δϕ (°) | ΔR (mm) | Δz (mm) | ΔF (mm) | Δu (mm) | Δv (mm) | α (°) | β (°) | ||
|---|---|---|---|---|---|---|---|---|---|
| MV | Min. | −0.4 | −1.2 | −0.8 | −2.3 | −1.0 | 1.3 | −0.3 | −1.4 |
| Max. | 0.0 | 2.7 | 0.1 | 2.5 | −0.5 | 2.2 | 0.3 | −0.6 | |
| Mean | −0.2 | 0.5 | −0.3 | 0.2 | −0.8 | 1.7 | 0.0 | −1.0 | |
| SD | 0.1 | 1.4 | 0.3 | 1.8 | 0.2 | 0.3 | 0.2 | 0.2 | |
| kV | Min. | −0.3 | 0.2 | −0.8 | −2.2 | −1.2 | 1.3 | −0.3 | −2.4 |
| Max. | 0.1 | 4.9 | 0.2 | 2.3 | 0.9 | 2.5 | 0.4 | −0.7 | |
| Mean | −0.1 | 2.2 | −0.2 | −0.1 | −0.1 | 1.9 | 0.0 | −1.3 | |
| SD | 0.1 | 1.5 | 0.3 | 1.6 | 0.7 | 0.4 | 0.2 | 0.5 |
Relationship among various geometric parameters
Table 4 lists the changes of geometric parameters of the imaging system brought about by the specific parameters varied in different evaluations. A change in one specific parameter could, to a certain extent, cause changes in other parameters depending on the actual configuration or the position of the imaging system, however, these changes were small and assumed not to affect the results of the experimental evaluations.
Table 4.
The changes of geometric parameters of the imaging system brought about by the specific parameters varied in different evaluations. Δϕ, ΔR, and Δz are the changes in the gantry angle, rotation radius and distance from the rotation plane, respectively. ΔF, Δu, and Δv are the changes of the focal distance, and the two translational offsets of the imager in the uv plane, respectively; α and β describe the changes in the tilting of the imager.
| Evaluation | Parameter varied | Range varied | Δϕ (°) | ΔR (mm) | Δz (mm) | ΔF (mm) | Δu (mm) | Δv (mm) | α (°) | β (°) |
|---|---|---|---|---|---|---|---|---|---|---|
| II.D.4 | SID | 1300–1600 mm | 0.01 | 1.06 | 0.08 | ⋯ | 0.23 | 0.75 | 0.34 | 0.13 |
| II.D.5 | Imager off center | ±20 mm | 0.00 | 0.27 | 0.08 | 0.12 | ⋯ | ⋯ | 0.61 | 0.25 |
| II.D.7 | Gantry angle | ±45° | ⋯ | 0.28 | 0.05 | 0.50 | 0.02 | 0.06 | 0.13 | 0.05 |
DISCUSSION
We have designed a geometric QA phantom tailoring to an automated analysis to successfully estimate the geometric parameters of an on-board imaging system with a reasonable accuracy. The size of the phantom and the helical arrangement of the fiducials on the surface ensure the projected positions of the fiducials are well spaced on a detector area at any gantry angle for easy detection and identification. In principle, the more the number of the fiducials is, the more information that can be extracted for estimating the geometric parameters, but there will be higher chances of superposition among the fiducial projections. There is a trade-off between the number of fiducials and the minimum distance between the fiducial projections. Based on the result from the evaluation II.D.2, we concluded that 13 BBs were adequate for the present application and this gQA tool can detect an angular uncertainty of 0.1°.
Concerning the analysis software, the direct relationship between the 2D projected position of a fiducial and the idealized geometric parameters of an imaging system was used in an optimal manner for determining the geometric parameters. Theoretically, eight equations (from four fiducials’ 2D projections) might be enough to solve this type of eight-parameter problem in a perfect mathematical model. In reality, the system is not perfect and several imperfect factors might occur: (1) The x-ray source is not a real geometry point and has a finite size, which leads to geometric penumbra; (2) the accuracy of the spatial location of the fiducial is limited by measurement; and (3) the imager pixel has a finite size and is associated with noise. These imperfections render us to summon more equations in solving the problem. This proposed analysis tool takes all fiducial projections into account in the optimization. In addition, Eqs. 3, 4, 5, 6, 7 indicate that this is a nonlinear problem and multiple local minima might possibly coexist with the global minimum. While it is not clear whether the estimation results from some image-based optimization approaches19 would be trapped in the local minimum, we adopted to use a global optimization algorithm of simulated annealing for our software to ensure a global minimum is always achievable. Moreover, the exhaustive search at the beginning of the process warrants well-distributed seeds for the simulated annealing and, in turn, saves optimization time significantly.
We have evaluated the gQA tool by estimating the geometric parameters of the imaging system under various imaging geometries. The results were highly reproducible and showed that the developed tool was responsive to all the changes introduced in the evaluation such as SID, detector offset, and phantom shift. The best estimates of these spatial parameters in different situations were well within 1.6 mm.
The estimation of the rotation plane and the isocenter by a series of projection images of the gQA phantom through a full gantry rotation is extremely useful in monitoring the geometric parameters pertinent to the flat-panel based CBCT and the coincidence of the MV and kV beams. We found that the coincidence of the MV∕kV beam isocenters were 0.5 mm comparable to the value of 0.8 mm which was obtained by the routine OBI QA exercise on the Trilogy. Comparing to the existing OBI QA exercise, our tool is more comprehensive giving a full picture of the geometric status and details on the rotation trajectories of both the x-ray sources (MV∕kV) and their orientation of the rotation planes. Yoo et al.17 pointed out that their recommendation did not include a separate geometric QA measurement for the OBI CBCT, the developed tool would be a good choice to fill it this gap because of its simplicity, easy implementation and full automation of the analysis.
Just like any other phantom-based QA studies,13, 14, 15, 19 one limitation of the present work lies on the mechanical imprecision in the positions of the BBs since the simulation of the BBs position assumes a perfect alignment of the BBs in the designated skewed helical trajectory. The BBs in the present gQA phantom are accurate to within 0.5 mm in their designated position and is considered adequate for the current application.
A simple guideline is recommended here on how to use this gQA tool in a clinic. First, set up the phantom to the room lasers, which is used to provide a reference to the room coordinates. A level can be used or even embedded in the phantom to assure its geometric setup. Second, kV and∕or MV projection images are acquired at a designated angle. Each (kV or MV) imaging system is described by the eight geometric parameters. To obtain the eight parameters of the imaging system (kV or MV) at a designated angle, in principle, a single projection measurement at that angle is sufficient. Last, the projection image is fed to the analysis software to calculate the geometric parameters. A more comprehensive approach would be acquiring the projections during a continuous gantry rotation (kV CBCT∕MV arc mode delivery). In that case, the geometric parameters at different gantry angles could be evaluated. Furthermore, the isocenters of the imaging system could also be calculated by the software if three or more projections are available.
CONCLUSIONS
A new geometric QA phantom and an automated analysis software have been developed to estimate the geometric status of a MV or kV on-board imager. This provides us a simple, robust and objective way to probe and monitor the geometric status of an imaging system in a fully automatic process, and facilitate routine QA workflow in a clinic.
ACKNOWLEDGMENTS
This work was supported in part by grants from the Department of Defense (PC040282), the National Cancer Institute (1R01 CA104205), and the Komen Breast Cancer Foundation (BCTR0504071). Support from the Sir Robert Black Postdoctoral Fellowship and the Hong Kong Hospital Authority Overseas Training Allowance for the second author are also gratefully acknowledged.
APPENDIX A: DERIVATION OF THE FIDUCIAL LOCATION (u,v)
When the x-ray source S (R,ϕ,z) is at a gantry angle of ϕ, an arbitrary object A(r,θ,zB) is projected to C on imager u axis centering at D. Figure 11a provides a 2D view on an xy plane where the source S locates (z). A′(r,θ,z) is the projection of A on this plane. Using the similar triangle relationship between the triangles SA′B and SCD, we have Eq. A1
| (A1) |
while |A′B|=r cos γ is the distance from A′ to the projection central line (SO′) and SD is the source-to-imager distance (F). SB is the distance from source to the projection on the central line. It is calculated by Eq. A2
| (A2) |
given
| (A3) |
So we have
or
The negative sign was added due to the definition of u axis.
Figure 11.
Geometric relationship between a fiducial’s 3D position and its projection on the imager.
A side view perpendicular to the beam axis is shown in Fig. 11b. Now A′ and B are overlapped on this view. Based on the similarity between triangles SAB and SGD, the magnification factor is
while |AB|=|AB′|−|SS′|=zB−z, |SD|=F, |SB|=R+r sin γ.
So the projection on the v axis is
APPENDIX B: DERIVATION OF THE TILTED AXIS q′
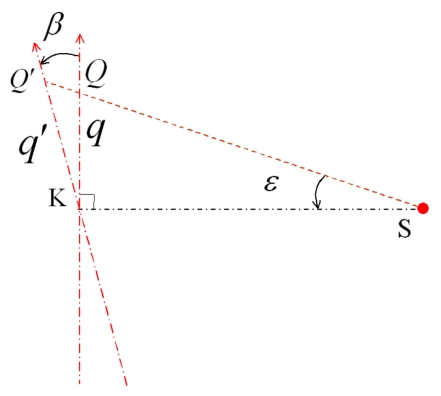
After a tilting of β, the projection at Q moved to Q′, and the coordinate on q axis becomes a coordinate on q′ axis. As shown in Fig. 12, from the triangle KQQ′, we have
Because
and
so
Use small angle approximation, cos(ε)≈1−1∕2ε2 and cos(β+ε)≈1−1∕2(β+ε)2,
Approximately, ε≈q∕F.
Figure 12.
Schematic diagram showing the tilting of the imager upon the p axis.
So
References
- Sorcini B. and Tilikidis A., “Clinical application of image-guided radiotherapy, IGRT (on the Varian OBI platform),” Cancer Radiother 10, 252–257 (2006). [DOI] [PubMed] [Google Scholar]
- McBain C. A., Henry A. M., Sykes J., Amer A., Marchant T., Moore C. M., Davies J., Stratford J., McCarthy C., Porritt B., Williams P., Khoo V. S., and Price P., “X-ray volumetric imaging in image-guided radiotherapy: The new standard in on-treatment imaging,” Int. J. Radiat. Oncol., Biol., Phys. 10.1016/j.ijrobp.2005.09.018 64, 625–634 (2006). [DOI] [PubMed] [Google Scholar]
- Xing L., Thorndyke B., Schreibmann E., Yang Y., Li T. F., Kim G. Y., Luxton G., and Koong A., “Overview of image-guided radiation therapy,” Med. Dosim. 31, 91–112 (2006). [DOI] [PubMed] [Google Scholar]
- Yang Y., Schreibmann E., Li T., Wang C., and Xing L., “Evaluation of on-board kV cone beam CT (CBCT)-based dose calculation,” Phys. Med. Biol. 10.1088/0031-9155/52/3/011 52, 685–705 (2007). [DOI] [PubMed] [Google Scholar]
- Letourneau D., Wong J. W., Oldham M., Gulam M., Watt L., Jaffray D. A., Siewerdsen J. H., and Martinez A. A., “Cone-beam-CT guided radiation therapy: Technical implementation,” Radiother. Oncol. 10.1016/j.radonc.2005.03.001 75, 279–286 (2005). [DOI] [PubMed] [Google Scholar]
- Mao W., Li T., Wink N., and Xing L., “CT image registration in sinogram space,” Med. Phys. 10.1118/1.2767402 34, 3596–3602 (2007). [DOI] [PubMed] [Google Scholar]
- Huntzinger C., Munro P., Johnson S., Miettinen M., Zankowski C., Ahlstrom G., Glettig R., Filliberti R., Kaissl W., Kamber M., Amstutz M., Bouchet L., Klebanov D., Mostafavi H., and Stark R., “Dynamic targeting image-guided radiotherapy,” Med. Dosim. 31, 113–125 (2006). [DOI] [PubMed] [Google Scholar]
- Li T., Xing L., Munro P., McGuinness C., Chao M., Yang Y., Loo B., and Koong A., “Four-dimensional cone-beam computed tomography using an on-board imager,” Med. Phys. 10.1118/1.2349692 33, 3825–3833 (2006). [DOI] [PubMed] [Google Scholar]
- Oldham M., Letourneau D., Watt L., Hugo G., Yan D., Lockman D., Kim L. H., Chen P. Y., Martinez A., and Wong J. W., “Cone-beam-CT guided radiation therapy: A model for on-line application,” Radiother. Oncol. 10.1016/j.radonc.2005.03.026 75, 271–278 (2005). [DOI] [PubMed] [Google Scholar]
- Jaffray D. A., Siewerdsen J. H., Wong J. W., and Martinez A. A., “Flat-panel cone-beam computed tomography for image-guided radiation therapy,” Int. J. Radiat. Oncol., Biol., Phys. 10.1016/S0360-3016(02)02884-5 53, 1337–1349 (2002). [DOI] [PubMed] [Google Scholar]
- Lu J., Guerrero T. M., Munro P., Jeung A., Chi P.-C. M., Balter P., Zhu X. R., Mohan R., and Pan T., “Four-dimensional cone beam CT with adaptive gantry rotation and adaptive data sampling,” Med. Phys. 10.1118/1.2767145 34, 3520–3529 (2007). [DOI] [PubMed] [Google Scholar]
- Sharpe M. B., Moseley D. J., Purdie T. G., Islam M., Siewerdsen J. H., and Jaffray D. A., “The stability of mechanical calibration for a kV cone beam computed tomography system integrated with linear accelerator,” Med. Phys. 10.1118/1.2143141 33, 136–144 (2006). [DOI] [PubMed] [Google Scholar]
- Claus B. E. H., presented at the Proceedings of SPIE, 2006. (unpublished).
- Cho Y., Moseley D. J., Siewerdsen J. H., and Jaffray D. A., “Accurate technique for complete geometric calibration of cone-beam computed tomography systems,” Med. Phys. 10.1118/1.1869652 32, 968–983 (2005). [DOI] [PubMed] [Google Scholar]
- Rougee A., Picard C., Ponchut C., and Trousset Y., “Geometrical calibration of x-ray imaging chains for three-dimensional reconstruction,” Comput. Med. Imaging Graph. 10.1016/0895-6111(93)90020-N 17, 295–300 (1993). [DOI] [PubMed] [Google Scholar]
- Fahrig R. and Holdsworth D. W., “Three-dimensional computed tomographic reconstruction using a C-arm mounted XRII: Image-based correction of gantry motion nonidealities,” Med. Phys. 10.1118/1.598854 27, 30–38 (2000). [DOI] [PubMed] [Google Scholar]
- Yoo S., Kim G. Y., Hammoud R., Elder E., Pawlicki T., Guan H., Fox T., Luxton G., Yin F. F., and Munro P., “A quality assurance program for the on-board imagers,” Med. Phys. 10.1118/1.2362872 33, 4431–4447 (2006). [DOI] [PubMed] [Google Scholar]
- Yang K., Kwan A. L., Miller D. F., and Boone J. M., “A geometric calibration method for cone beam CT systems,” Med. Phys. 10.1118/1.2198187 33, 1695–1706 (2006). [DOI] [PMC free article] [PubMed] [Google Scholar]
- Mamalui-Hunter M., Li H., and Low D. A., presented at the AAPM 49th Annual Meeting, Minneapolis, MN, 2007. (unpublished).
- Dong L., Shiu A., Tung S., and Boyer A., “Verification of radiosurgery target point alignment with an electronic portal imaging device (EPID),” Med. Phys. 10.1118/1.598070 24, 263–267 (1997). [DOI] [PubMed] [Google Scholar]
- Webb S., “Optimization of conformal radiotherapy dose distributions by simulated annealing,” Phys. Med. Biol. 10.1088/0031-9155/34/10/002 34, 1349–1370 (1989). [DOI] [PubMed] [Google Scholar]
- Pugachev A. and Xing L., “Incorporating prior knowledge into beam orientation optimization in IMRT,” Int. J. Radiat. Oncol., Biol., Phys. 10.1016/S0360-3016(02)03917-2 54, 1565–1574 (2002). [DOI] [PubMed] [Google Scholar]
- Rosen I. I., Lam K. S., Lane R. G., Langer M., and Morrill S. M., “Comparison of simulated annealing algorithms for conformal therapy treatment planning,” Int. J. Radiat. Oncol., Biol., Phys. 10.1016/0360-3016(95)02031-4 33, 1091–1099 (1995). [DOI] [PubMed] [Google Scholar]
- Li J. G., Boyer A. L., and Xing L., “Clinical implementation of wedge filter optimization in three-dimensional radiotherapy treatment planning,” Radiother. Oncol. 10.1016/S0167-8140(99)00142-5 53, 257–264 (1999). [DOI] [PubMed] [Google Scholar]
- Kutcher G. J. et al. , “Comprehensive QA for radiation oncology: Report of AAPM Radiation Therapy Committee Task Group 40,” Med. Phys. 10.1118/1.597316 21, 581–618 (1994). [DOI] [PubMed] [Google Scholar]


