Abstract
In a practical classifier design problem, the true population is generally unknown and the available sample is finite-sized. A common approach is to use a resampling technique to estimate the performance of the classifier that will be trained with the available sample. We conducted a Monte Carlo simulation study to compare the ability of the different resampling techniques in training the classifier and predicting its performance under the constraint of a finite-sized sample. The true population for the two classes was assumed to be multivariate normal distributions with known covariance matrices. Finite sets of sample vectors were drawn from the population. The true performance of the classifier is defined as the area under the receiver operating characteristic curve (AUC) when the classifier designed with the specific sample is applied to the true population. We investigated methods based on the Fukunaga–Hayes and the leave-one-out techniques, as well as three different types of bootstrap methods, namely, the ordinary, 0.632, and 0.632+ bootstrap. The Fisher’s linear discriminant analysis was used as the classifier. The dimensionality of the feature space was varied from 3 to 15. The sample size n2 from the positive class was varied between 25 and 60, while the number of cases from the negative class was either equal to n2 or 3n2. Each experiment was performed with an independent dataset randomly drawn from the true population. Using a total of 1000 experiments for each simulation condition, we compared the bias, the variance, and the root-mean-squared error (RMSE) of the AUC estimated using the different resampling techniques relative to the true AUC (obtained from training on a finite dataset and testing on the population). Our results indicated that, under the study conditions, there can be a large difference in the RMSE obtained using different resampling methods, especially when the feature space dimensionality is relatively large and the sample size is small. Under this type of conditions, the 0.632 and 0.632+ bootstrap methods have the lowest RMSE, indicating that the difference between the estimated and the true performances obtained using the 0.632 and 0.632+ bootstrap will be statistically smaller than those obtained using the other three resampling methods. Of the three bootstrap methods, the 0.632+ bootstrap provides the lowest bias. Although this investigation is performed under some specific conditions, it reveals important trends for the problem of classifier performance prediction under the constraint of a limited dataset.
Keywords: classifier performance, resampling, bootstrap, finite sample size
INTRODUCTION
Computer-aided diagnosis (CAD) continues to be an active area of research. Regardless of whether one considers the more established areas, such as lesion detection and characterization for mammography, or newer areas such as lesion detection in thoracic CT volumes or CT colonography, the performances of the CAD systems are not ideal. One major roadblock for CAD development in medical applications is the limited patient samples with ground truth available for training the CAD systems.
Classifiers are used in most CAD applications. In computer-aided characterization of lesions as malignant or benign, the classifier is the main component of the CAD system. In computer-aided lesion detection, a common strategy is to first prescreen for regions of interest (ROIs) that may contain a lesion, and then to employ a classifier to characterize the ROI as a real lesion or a false-positive. To understand how finite sample size affects CAD development, it is important to analyze the effect of sample size on classifier performance.
An important question in CAD is what kind of penalty one has to pay for the finite sample size. To answer this question in the context of classifier design, one may investigate the difference between the mean performance of a classifier designed with a finite training set and tested using the true population and the optimal performance that may be obtained using an infinite training set. In this type of comparison, the reference is the ideal classifier performance that is obtained by training and testing with infinite sample sets drawn from the true population. We have previously investigated this topic.1
In practical situations, the CAD developer not only has to design a classifier with a finite sample size of N cases, but also has to provide an estimate as to how the designed classifier will generalize to the true population. In other words, the developer needs to indicate the level of performance that a user may expect from the classifier when the system is applied to the population at large. Since a larger sample is more representative of the population, it is preferable to design the classifier with all the available cases N. When all cases are used for classifier design, one has to use a resampling technique to estimate the performance of the designed classifier when it is applied to the true population. A resampling technique essentially has to (i) use part of the available sample to design a classifier, (ii) use part of the available sample to test the performance of the classifier designed in (i), and (iii) estimate the generalization ability of the classifier that is designed using the entire available sample of N cases. Thus, the finite sample of size N needs to be used not only for training the classifier, but also to predict its performance in unknown cases from the true population. This “problem of predicting classifier performance under the constraint of a limited dataset” is the focus of the current study. Note that in this problem, the true performance is that of the classifier trained with the given set of N cases and applied to the true population. In other words, the goal in performance prediction with a limited dataset is to inform the users of the performance level of a specific classifier, the one designed given the specific sample when it is applied to unknown test cases, and not the average performance of classifiers that might be designed using different samples of size N.
Classifier performance estimation has been addressed for many decades in a number of contexts. The most commonly used measure for classifier performance estimation is the error rate, i.e., the percentage of misclassified cases. Estimation of the error rate of a classifier was described as one of the most important problems in pattern recognition more than three decades ago,2 and continues to be an active area of research today. Earlier methods of error rate estimation primarily relied on classical resampling techniques such as resubstitution, hold-out, leave-one-out (LOO), and cross-validation,2 while later work has seen an explosion of bootstrap methods.3, 4 Two review articles summarize the research that has been devoted to classifier error rate estimation using a variety of estimators and resampling methods.5, 6
In the context of CAD, and more generally that of medical decision making, error rate is frequently an inadequate performance measure. For example, a classifier that is useless for diagnosing a disease can have near zero error rate if it is applied to a population in which the prevalence of the disease is very low. To avoid the dependence of the performance measure on the prevalence, one may consider the misclassification percentages for the two classes separately, or, equivalently, as is commonly done in medical applications, use sensitivity and specificity as the measure. However, assigning a case into one of the two classes by a decision threshold usually requires knowledge of the costs of different classification errors, and the costs are often difficult to determine. The area under the receiver operating characteristics (ROC) curve, AUC, is a commonly used performance measure under this type of conditions. AUC can be interpreted as the average sensitivity over all specificities, and therefore does not evaluate the classifier at a single decision threshold. Despite the popularity of AUC as a performance measure, only a few studies to date have investigated the effect of different resampling schemes for the prediction of the AUC of a classifier under the constraint of a limited dataset.
Tourassi et al.7 investigated the use of cross validation, LOO and bootstrap methods on limited clinical datasets to develop and predict the AUC of artificial neural networks (ANNs) for the estimation of the likelihood of breast cancer and pulmonary embolism. Arana et al.8 used cross-validation, LOO, and bootstrap methods on a limited clinical dataset of calvarial lesions to develop and predict the AUC of ANNs and logistic regression (LR) models in the task of differentiating malignant and benign lesions. Although these two studies compared the relative means and standard deviations (or confidence intervals) of three different resampling methods, no assessment could be made as to which of the three methods was more accurate because the true population performance was not known. Steyerberg et al.9 used a large dataset of 40 830 patients with acute myocardial infarction to predict 30-day mortality using an LR model. Random subsets were selected from the large dataset to serve as the “available sample,” and the remaining cases constituted an independent test set, which presumably was large enough to represent the general population. Hold-out, cross-validation, and bootstrapping methods were used with the available sample to predict the AUC and other performance measures, which were then compared to the performance of the LR classifier designed on the available sample and applied to the independent test set. Yousef et al.10 investigated the effectiveness of different bootstrap techniques in a Monte Carlo simulation study. Neither of the last two studies systematically investigated the effect of feature space dimensionality, class separability, or the performance of LOO and Fukunaga–Hayes (F–H) resampling methods. The study by Sahiner et al. covered some of the latter conditions on a limited scale.11 The current study extends this previous work by including the 0.632+ and F–H resampling methods and additional feature spaces.
As indicated before, studies conducted so far to investigate resampling techniques for prediction of the AUC under the constraint of a finite sample size have been limited. The purpose of this study was to perform a Monte Carlo simulation experiment to compare the behavior of five types of resampling methods under different conditions for class distributions, class separability, number of available samples from each class, and feature space dimensionality.
METHODS
Five resampling methods were compared, including three variations of the bootstrap method, namely, the ordinary, 0.632 and 0.632+ bootstrap, the (F–H), and the LOO methods. In the following, each of these methods is briefly discussed.
The ordinary bootstrap
The bootstrap technique is a data-based simulation approach to estimate some unknown quantity from the available data. It is completely data-driven, and does not use any a priori information about the true distribution F of the data. Given a random sample x=(x1,x2,…,xN) of size N from the true distribution F, an empirical distribution is defined as the discrete distribution that assigns a probability of 1∕N to each data vector (or case) xi, i=1,…,N, where the boldface letter x denotes a set of cases (i.e., a sample), and the italic letter x denotes a data vector (i.e., a case). In a CAD problem, for example, the data vector xi can be a feature vector associated with an ROI that needs to be evaluated for its likelihood of being a lesion, and x is the set of feature vectors from all available ROIs.
An important concept in the bootstrap technique is the bootstrap sample, which is defined as a sample x*=(x1*,x2*,…,xN*) randomly drawn from the empirical distribution . From the definition of , it is seen that the bootstrap sample is nothing but a random sample of size N drawn with replacement from the available dataset x. Some of the original data vectors xi may appear 0 times in x*, some of them may appear once, some may appear twice, etc. The bootstrap sample can be thought of as a simulated dataset, and a large number of such bootstrap samples can be drawn from to estimate the quantity of interest.
In classifier performance evaluation, the common use of the bootstrap method involves the estimation of the bias of the resubstitution method, and the removal of this bias from the resubstitution performance to get an estimate of the true performance.3 Application to the estimation of the test AUC is described next.
Let AUC(Strain,Stest) denote the test AUC value, obtained when the classifier trained on the set Strain is applied to the test set Stest. Let w denote the bias of the resubstitution method. Using the bootstrap technique, one generates B bootstrap samples, x*1,x*2,…,x*B, where each sample x*b=(x1*b,x2*b,…,xN*b) is obtained by randomly drawing N data vectors, with replacement, from the original dataset x. In the ordinary bootstrap method, the bias of the resubstitution method is estimated from the bootstrap sample x*b as
| (1) |
In this equation, AUC(x*b,x*b) can be thought of as the resubstitution AUC value in the so-called “bootstrap world,”12 whereas AUC(x*b,x) can be thought of as the test AUC value in the bootstrap world. Hence, their difference, averaged over B bootstrap samples, will provide an estimate for the bias of the resubstitution method:
| (2) |
This estimate is then subtracted from the true resubstitution AUC value, obtained by training and testing on the set of all available data, to correct for the bias
| (3) |
The 0.632 bootstrap
The reasoning behind the 0.632 bootstrap estimator proposed by Efron3 can be explained as follows for our application where the AUC is used as the performance measure. The resubstitution estimate AUC(x,x) is biased because it is the area under the ROC curve for data that are at a zero distance from the training set x, whereas the true AUC is the area under the curve for testing the classifier on the entire population, where many of the data are at some distance away from x. As discussed before, when a bootstrap sample x*b is drawn, some of the original data vectors xi may not appear in x*b. Let x*b(0) denote this set of original data vectors that do not appear in x*b. Using a probabilistic argument, Efron demonstrates that AUC[x*b,x*b(0)] is pessimistically biased, because x*b(0) are farther away from x than a typical test sample randomly drawn from the true population. On the average, the ratio of the distances from these two groups [i.e., x*b(0) and a sample randomly drawn from the true population] to x is 1∕(1−e−1)=1∕0.632. The bias of the resubstitution method is estimated from the bootstrap sample x*b as
| (4) |
The estimate for the bias for the 0.632 method, , is found by averaging Eq. 4 over B bootstrap samples. The AUC value estimated from the 0.632 method is then given by
| (5) |
The 0.632+ bootstrap
The 0.632+ estimator was designed by Efron to address the issue of the bias of the 0.632 estimator. Starting with the example of a classification problem in which the classifier is useless (AUC=0.5), Efron shows that for overtrained classifiers, the 0.632 estimator for the classifier performance can be optimistically biased. The original definition of the 0.632+ estimator can be found in the literature.4 In this study, the AUC value estimated from the 0.632+ method is defined as
| (6) |
where
| (7) |
| (8) |
and
| (9) |
Notice that the 0.632 estimate [Eq. 5] can be thought of as a special case of the 0.632+ estimate with α=0.632 and AUC′[x*b,x*b(0)]=AUC[x*b,x*b(0)]. This definition is slightly different from that used by Efron and Tibshirani4 in that the relative overfitting rate R and the weight α are calculated for each bootstrap replication. Also, the definition in Eq. 9 for the overfitting rate contains an additional condition related to whether AUC[x*b,x*b(0)] is smaller than the chance (no-information) AUC value of 0.5, which was not included by Efron and Tibshirani.4
The Fukunaga–Hayes method
One method to estimate the performance of a classifier that can be designed with N cases is to partition them into a training group of Ntrain cases and a test group of Ntest=N−Ntrain cases. One can repeat the partitioning process P times, and use the average test AUC as the performance estimate. One disadvantage of this method is that since Ntrain<N, the designed classifier may have a lower performance than one trained with N cases. Fukunaga and Hayes studied the dependence of the classifier performance on the training sample size Ntrain, and showed that under a wide range of conditions, the probability of misclassification (PMC) error varies linearly with 1∕Ntrain.13 Based on this observation, they suggested that one can vary Ntrain<N in a range of values, obtain a linear regression to the PMC, and then extrapolate to find the PMC for Ntrain⩾N. In our previous work, we applied this method for performance estimation using the AUC. For various classifiers and Gaussian sample distributions, it was observed that the dependence of the AUC value can be closely approximated by a linear relationship in a sample size range where higher-order terms 1∕Ntrain can be neglected.1 The implementation in the current study uses four values of Ntrain<N for finding the linear regression, and P training-test partitioning sets at each of these values to obtain the F–H prediction of at Ntrain=N for the classification performance.
The LOO method
In the LOO technique, given a sample x=(x1,x2,…,xN), one designs N classifiers; in the design of the ith classifier, all cases are used except case xi, which is reserved as a test case. Since each classifier is designed using N−1 cases, the number of trainers is very close to the number of available cases. In our application, we accumulated all N test results and computed the predicted for the LOO method.
Classifier
Many types of classifiers have been used in CAD. Because the focus of this study is to compare different resampling methods in classifier training and performance prediction, we chose only one commonly used classifier, the Fisher’s linear discriminant analysis (LDA), for the evaluation. Let and denote the mean vectors of Class 1 (the negative, or normal, class in ROC analysis) and class 2 (the positive, or abnormal, class in ROC analysis), estimated from the training set, respectively. Let and denote the estimated covariance matrices, and n1 and n2 denote the number of cases from Class 1 and Class 2, respectively. Using the pooled covariance matrix ,14 the LDA output for data vector x is defined as15
| (10) |
where
| (11) |
Summary measures of prediction accuracy
As discussed in the introduction, our goal is to predict the performance of the classifier trained with the given set of N cases when it is applied to the true population. The true performance is therefore AUC(x,F). In a real CAD problem, F is not available and thus AUC(x,F) is unknown. In our study, we simulated different class distributions F, as discussed next. We define one experiment E as the selection of a sample x from F. The true performance AUCj(x,F) for the jth experiment is obtained by training the classifier with x, drawing an additional random test sample of 5000 cases from the distribution of each class, and testing the designed classifier with this data set of 10 000 test cases. The number of test cases, 10 000, is chosen to be large enough so that its distribution is essentially F. The AUC is calculated using the LABROC program,16 which uses a maximum likelihood estimation algorithm to fit a binormal ROC curve to the classifier output after proper binning. Note that the true performance AUCj(x,F) depends on x, and therefore changes in each experiment. The prediction error for a resampling method for the jth experiment was then defined as
| (12) |
where r stands for one of the five different sampling methods, i.e., the ordinary bootstrap, 0.632 bootstrap, 0.632+ bootstrap, F–H, or LOO, and denotes the predicted AUC for experiment j using the resampling method r. For each condition discussed next, we performed J=1000 experiments.
We are interested in how different the predicted and true performances are when a sample x is drawn from F. To quantify this difference over J experiments, we used the root-mean-squared error (RMSE)
| (13) |
We also found the mean, standard deviation, and the bias of the predicted AUC:
| (14) |
| (15) |
| (16) |
Note that the bias provides an indication of the average deviation of the predicted from the true performance, whereas the RMSE provides an indication about the squared difference between the predicted and true performances. A large RMSE for a resampling method indicates that this difference is large for a given sample x and, therefore, the resampling method may be inappropriate, even if the bias is small.
Feature spaces and sample sizes
The probability density functions of the data vectors were assumed to follow multivariate normal distributions. We investigated two conditions: in the first condition the two classes are different only in their means [the equal covariance (EqC) condition] and in the second condition the two classes are different both in their means and the covariance matrices [the unequal covariance (NEqC) condition]. It has been shown in the literature17 that for both conditions, the covariance matrices can be simultaneously diagonalized without affecting the analysis. We therefore used an identity matrix for the covariance of both classes in the EqC condition. In the NEqC condition, the covariance matrix of Class 1 was the identity matrix, and the covariance matrix of Class 2 was a diagonal matrix, where the first diagonal entry was 1, the last diagonal entry was 10, and the remaining entries were equally spaced between 1 and 10 with an increment of 9∕k, where k denotes the dimensionality of the feature space. We assumed that the mean difference in each feature between the two classes was equal, i.e., Δμ=(μ1−μ2)=[c1,c2,…,ck]T, where c1=c2=⋯=ck=c. Two different values were investigated for c, corresponding to a medium and a medium-high separation between the two classes, respectively. For medium separation, the value of c was chosen such that the AUC of an LDA classifier designed and tested with an infinite sample size, referred to as AUC(∞) next, was approximately 0.8, and for medium-high separation, c was chosen such that AUC(∞) was 0.89. The dimensionality of the feature space, k, was varied from 3 to 15. These specific class distributions are chosen to be demonstrative, with a dimensionality and an AUC in the range that may be encountered in CAD applications. The relative effectiveness of the resampling methods can then be compared under these representative conditions.
Two conditions of the sample sizes from the two classes were studied: EqS n1=n2 and NEqS n1≠n2. Under both conditions, the number of cases from the positive class, n2, was varied between 25 and 60, simulating conditions in which a classifier is designed using a relatively small dataset. Under the NEqS condition, we assumed that n1=3⋅n2, approximately simulating the proportion of malignant and benign lesions recommended for biopsy in breast imaging.
RESULTS
Equal covariance matrices and equal class sample sizes
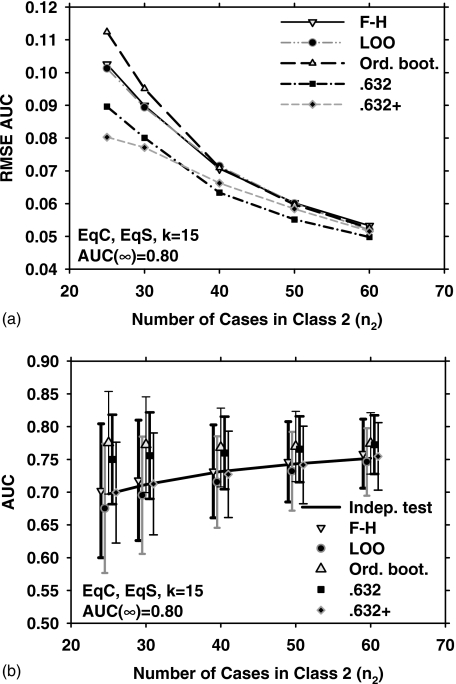
Figure 1 shows the results obtained with the five different resampling methods and five sample sizes (n2=25, 30, 40, 50, and 60) for the EqC and EqS conditions, k=15 (15-dimensional feature space), and medium class separation [AUC(∞)=0.80]. Figure 1a shows the dependence of RMSE on the number of cases in class 2. In Fig. 1b, the error bars indicate , and the data points and error bars are slightly offset, for a given value of n2, to prevent them from overlapping with each other. The solid line is the average of AUC(x,F) over J=1000 experiments. The standard deviation of AUC(x,F) is not shown for clarity. From Fig. 1b, it is observed that the F–H and the 0.632+ bootstrap methods have the lowest bias for this condition. However, the 0.632+ bootstrap performs substantially better than the F–H method in terms of RMSE, as shown in Fig. 1a. This is explained partly by noting that the 0.632+ bootstrap has a lower variance than the F–H method [Fig. 1b]. A more detailed analysis of the relationship between RMSE,, and is provided in the Discussion section. Figure 1a also indicates that for small n2, the ordinary bootstrap has the highest RMSE. This may be attributed partly to the fact [Fig. 1b] that the ordinary bootstrap has the highest bias under these conditions.
Figure 1.
Simulation results for the condition of 15-dimensional feature space, equal covariance matrices, equal sample sizes from both classes, and AUC(∞)=0.80. (a) The root mean-squared error (RMSE) of the AUC estimated with the five resampling techniques, using 1000 independent experiments. (b) The mean of the AUC and ±(standard deviation), shown as error bars. The solid line is the average of the true AUC, the standard deviation of which is not shown for the clarity of the figure. The symbols are plotted slightly offset, centered around a given value of n2 to prevent the marks and error bars from overlapping with each other. F–H: Fukunaga–Hayes method, LOO: Leave-one-out, Ord. boot.: ordinary bootstrap, 0.632: 0.632 bootstrap, and 0.632+: 0.632+ bootstrap.
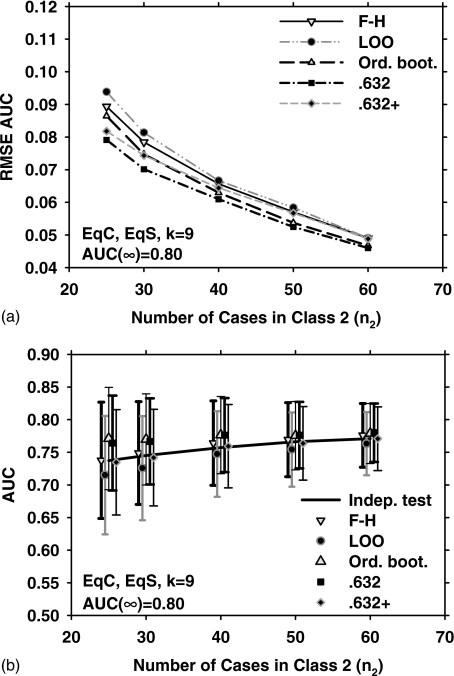
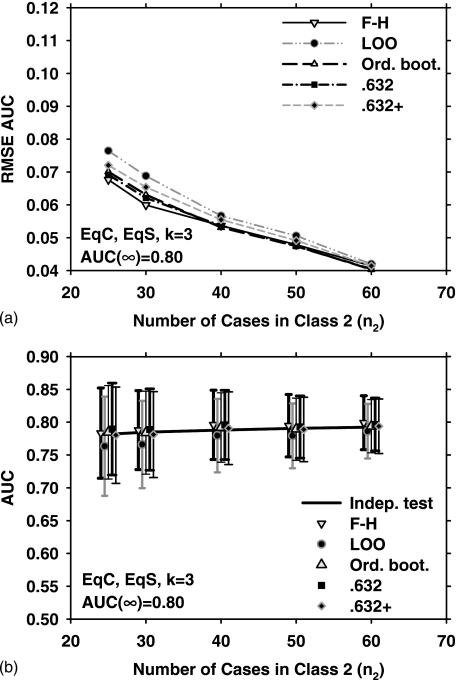
Figure 2 shows the results for EqC, EqS, AUC(∞)=0.80, but for k=9. Under these conditions, the three bootstrap methods outperform the LOO and F–H methods in terms of the RMSE [Fig. 2a]. The mean and standard deviation of the estimated AUC over 1000 experiments, and , for the five resampling methods are plotted in Fig. 2b. Figures 3a, 3b show the RMSE, , and for EqC, EqS, AUC(∞)=0.80, and k=3. A comparison of Figs. 1a, 2a, 3a indicates that if the feature dimensionality is increased while all other conditions are unchanged, the RMSE increases for all resampling methods. We therefore plot only the two extremes (k=3 and k=15) for the remaining discussions.
Figure 2.
Simulation results for the condition of nine-dimensional feature space, equal covariance matrices, equal sample sizes from both classes, and AUC(∞)=0.80. Results shown in (a) and (b) correspond to those in Figs. 1a, 1b, respectively.
Figure 3.
Simulation results for the condition of three-dimensional feature space, equal covariance matrices, equal sample sizes from both classes, and AUC(∞)=0.80. Results shown in (a) and (b) correspond to those in Figs. 1a, 1b, respectively.
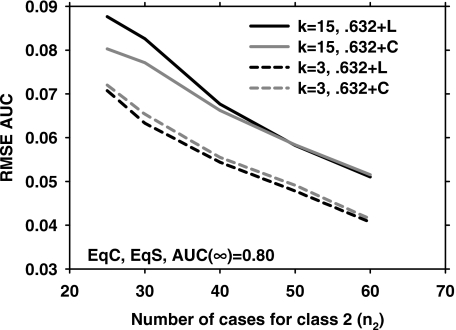
As discussed in the Methods section, our definition of the 0.632+ bootstrap is slightly different from that used in the literature4, 10 in that we calculate the relative overfitting rate R and the weight α for each bootstrap replication. Figure 4 compares the RMSE results using our definition to those of the conventional method that first computes the average result from B bootstrap replications and then uses a nonlinear equation similar to Eq. 8 to define the overfitting rate R.10 Two pairs of curves are shown (k=3 and k=15) for EqC, EqS, AUC(∞)=0.80. The difference between the two methods is small for this condition. There is a small but consistent difference at k=3 in favor of the method used in the literature, while there is a relatively larger difference at low sample size at k=15 in favor of the method used in our study. Comparisons for other conditions (NEqC and NEqS) also showed a small difference between the two techniques.
Figure 4.
Comparison of the RMSE of the 0.632+ bootstrap version used in our article (0.632+C) and that used in the literature (0.632+L) for EqC, EqS, AUC(∞)=0.80. Two feature space dimensionalities, k=3 and k=15, are shown.
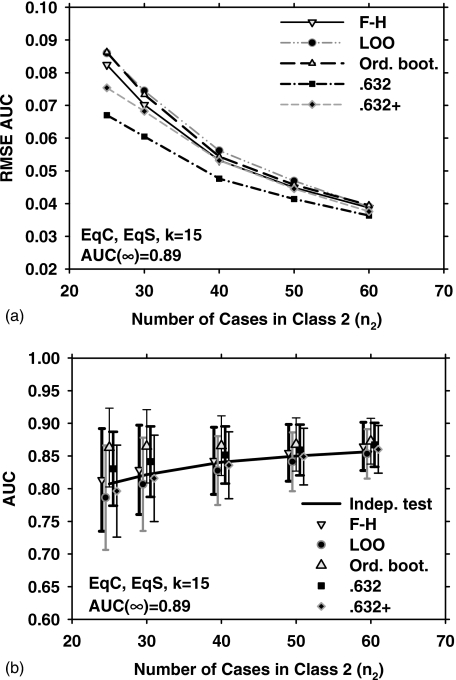
Figures 5a, 5b show results parallel to Fig. 1 (EqC, EqS, k=15) but with a medium-high class separation [AUC(∞)=0.89]. Compared to Fig. 1a, the trends in Fig.5a are similar, except that the order of 0.632 and 0.632+ bootstrap are reversed for small sample size, i.e., for medium-high class separation, 0.632 bootstrap has the lowest RMSE and 0.632+ has the second lowest RMSE.
Figure 5.
Simulation results for the condition of 15-dimensional feature space, equal covariance matrices, equal sample sizes from both classes, and AUC(∞)=0.89. Results shown in (a) and (b) correspond to those in Figs. 1a, 1b, respectively.
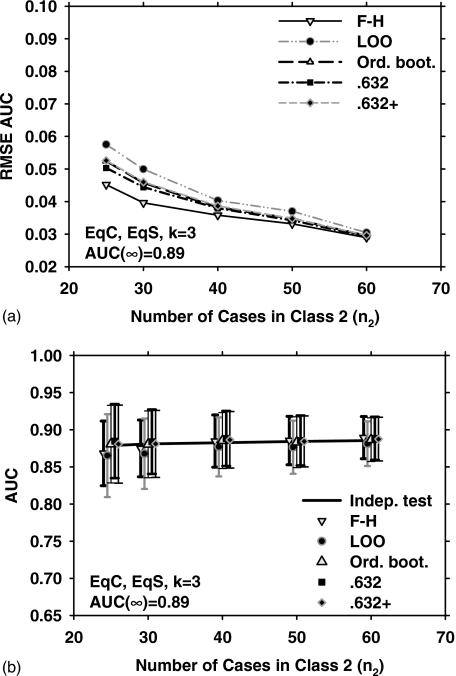
In terms of the closeness of the average of the resampling method to the true mean, 0.632+ bootstrap again performs better than other bootstrap methods. The corresponding results for k=3 are shown in Figs. 6a, 6b. It can be observed that all three bootstrap methods have a similar RMSE under this condition, while the F–H method has a slight advantage over the bootstrap methods. Since the trends for medium-high and medium class separation were similar, only results for medium class separation are shown in the remaining discussions.
Figure 6.
Simulation results for the condition of three-dimensional feature space, equal covariance matrices, equal sample sizes from both classes, and AUC(∞)=0.89. Results shown in (a) and (b) correspond to those in Figs. 1a, 1b, respectively.
Equal covariance matrices and unequal class sample sizes
Figures 7a, 7b show the RMSE, , and for EqC, NEqS, k=15, and AUC(∞)=0.80. The values of n2 are kept the same as those studied for Figs. 123456, while n1 are increased, n1=3⋅n2. Because of the larger number of cases from Class 1, the magnitudes of bias of the resampling methods are lower than those observed in Fig. 1b. Figure 7a indicates that the three bootstrap methods outperform the LOO and F–H methods in terms of the RMSE, similar to the observation from Fig. 1a. The results for EqC, NEqS, and k=3 are shown in Fig. 8. The RMSE and of all resampling methods are very close to one another, although the LOO method is slightly inferior to the other four methods.
Figure 7.
Simulation results for the condition of 15-dimensional feature space, equal covariance matrices for both classes, and AUC(∞)=0.80. The number of cases from the negative class, n1, was three times that from the positive class, n2. Results shown in (a) and (b) correspond to those in Figs. 1a, 1b, respectively.
Figure 8.
Simulation results for the condition of three-dimensional feature space, equal covariance matrices for both classes, and AUC(∞)=0.80. The number of cases from the negative class, n1, was three times that from the positive class, n2. Results shown in (a) and (b) correspond to those in Figs. 1a, 1b, respectively.
Unequal covariance matrices and equal class sample sizes
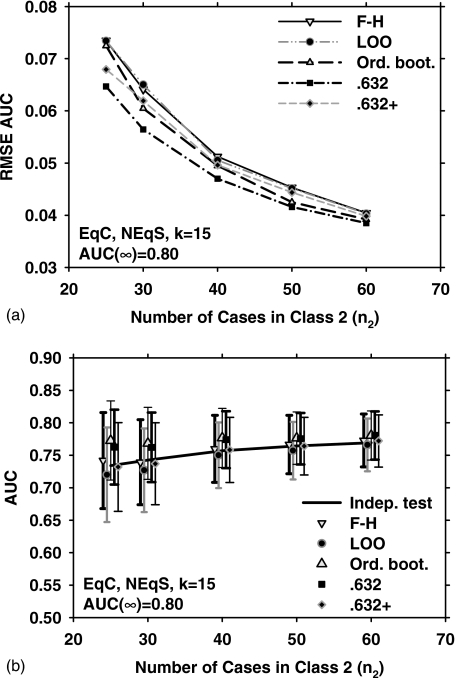
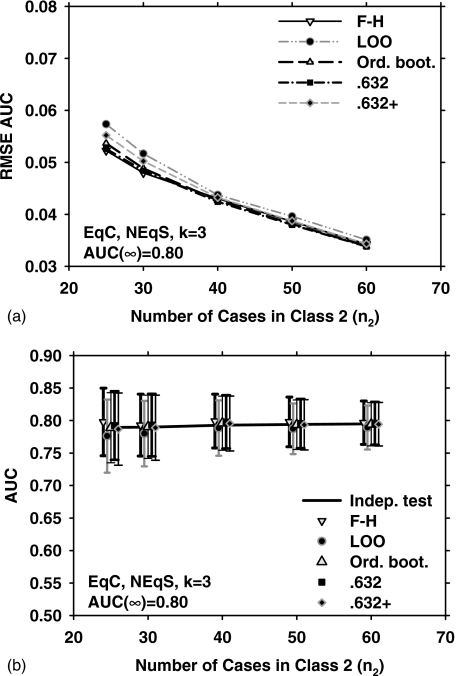
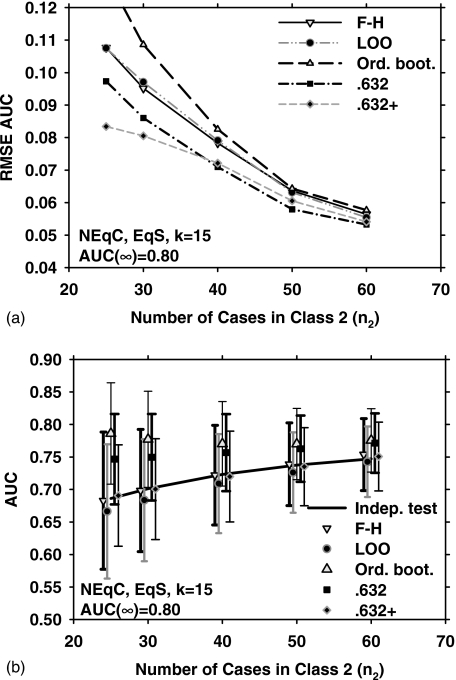
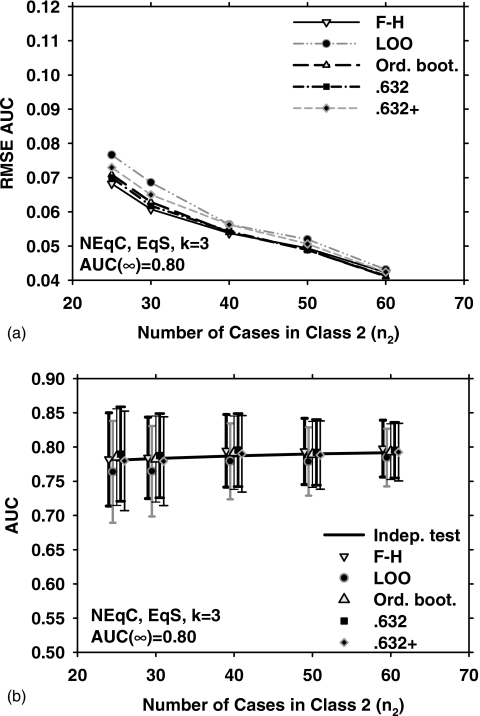
Figures 9a, 9b show the RMSE, , and for NEqC, EqS, k=15, and AUC(∞)=0.80. The relative trends of the performance measures are similar to those in Figs. 1a, 1b, although the magnitude of the RMSE is generally larger in Fig. 9a compared to Fig. 1a and the bias is slightly larger for some resampling methods (e.g., the ordinary bootstrap) in Fig. 9b compared to Fig. 1b. Figures 10a, 10b show the comparisons for k=3. Similar to the results for k=3 under the other conditions, the RMSE of all resampling methods in Fig. 10a are very close to each other
Figure 9.
Simulation results for the condition of 15-dimensional feature space, unequal covariance matrices for the two classes, equal class sample sizes from both classes, and AUC(∞)=0.80. Results shown in (a) and (b) correspond to those in Figs. 1a, 1b, respectively.
Figure 10.
Simulation results for the condition of three-dimensional feature space, unequal covariance matrices for the two classes, equal class sample sizes from both classes, and AUC(∞)=0.80. Results shown in (a) and (b) correspond to those in Figs. 1a, 1b, respectively.
DISCUSSION
In the range of the variables investigated in our simulation study, the difference in the RMSE obtained using different resampling methods can be large, especially when the feature space dimensionality is large and the number of available samples is small. Examples of these can be found on the left portions of Figs. 1a, 5a, 7a, 9a. Under this type of conditions, the 0.632 and 0.632+ bootstrap methods have the lowest RMSE. A smaller RMSE means that, when only one sample set is available, one has a higher chance to obtain an estimate that is closer to the true performance. It therefore appears that given a small sample with high feature space dimensionality, it may be advantageous to use the 0.632 or 0.632+ bootstrap method to estimate the performance of the classifier designed using the available sample. When the feature space dimensionality is small, or when the available sample size is relatively large, most of the resampling methods result in a similar RMSE and . This can be observed from the right portions of Figs. 36810, where k=3 and N is large. For n2=60, the largest difference of the RMSE values obtained using different resampling methods under these three conditions was 0.002 [Fig. 10a, between LOO and ordinary bootstrap].
When all other variables were held constant, the true AUC value, AUC(x,F), decreased when the sample size decreased. The dependence of classifier performance on design sample size has been discussed in the literature,1, 13 and is demonstrated by the positive slope of the solid line in the plots of AUC in the figures. As also expected, a higher feature space dimensionality resulted in a stronger dependence (larger slope). All resampling methods, except for the ordinary bootstrap, followed the trend that the estimated AUC value decreases with decreasing sample size. The AUC values estimated using the ordinary bootstrap method showed relatively small variation with n2, and under a few conditions, such as those for Figs. 1b, 7b, 9b, increased slightly when n2 decreased. The AUC estimated from the ordinary bootstrap method had a positive bias in high dimensional feature spaces, even for the largest sample size studied (n2=60), and the bias increased when the sample size decreased.
Figures 1b, 2b, 5b, 7b, 9b also demonstrate that the bias of the 0.632 bootstrap method can be similar to that of the ordinary bootstrap but higher than those of the other resampling methods. The bias of the 0.632+ method, on the other hand, seems to be lower than those of the other bootstrap techniques, and had the smallest RMSE under a large number of conditions.
Despite its relatively large bias, the 0.632 bootstrap method had a smaller RMSE than the F–H and LOO methods under most conditions. To investigate the relationship between RMSE and the bias, one can make use of the identity
| (17) |
where x and y are random variables, , , and . We therefore can express the RMSE of the resampling method r as
| (18) |
Equation 18 indicates that both the bias and the standard deviation of the resampling method contribute to the RMSE. SD2[AUC(x,F)] is a constant term that is independent of the resampling method. For the 0.632 bootstrap method, the small standard deviation of the estimated AUC value, shown as error bars in the graphs, is one of the factors contributing to the small RMSE.
A comparison of parts of Figs. 1a, 7a provides information on the effect of the ratio of cases from the two classes. The right-most point on Fig. 1a is obtained using a total of 120 cases, with 60 cases from each class. The RMSE for this condition is between 0.050 and 0.055, depending on the resampling method used. The conditions used for Fig. 7a are identical to those in Fig. 1a, except that n1=3⋅n2. A total of 120 cases thus correspond to n2=30, for which RMSE is between 0.055 and 0.065 [Fig. 7a], depending on the resampling method used. The true and the estimated average AUC obtained with n1=n2 [Fig. 1b] are also higher than the corresponding AUCs obtained with n1=3⋅n2 [Fig. 7b] for a total of 120 cases. Therefore, under this simula-tion condition, using equal sample sizes from the two classes provides a slight advantage in performance estimation. This appears to be consistent with the recommendation for design of observer experiment in ROC studies that, in the absence of any prior knowledge about the difference in variability within the positive and negative groups, using an approximately equal number of positive and negative cases may achieve a higher statistical power for a given total number of cases to be used in the experiment. The effect of the ratio of cases from the two classes will be an interesting topic of future study.
In a previous study, Steyerberg et al.9 used a large clinical dataset to study the performance of different resampling schemes for AUC estimation. They found that the ordinary bootstrap method performs similarly to the 0.632 and 0.632+ bootstrap methods, and described this finding as puzzling in their Discussion section. In our study, we found that these three methods perform similarly for small feature space dimensionality, e.g., k=3, whereas the performance of the ordinary bootstrap method is substantially poorer for k=15. We believe that this difference can be explained by considering the amount of bias in the resubstitution estimate. In the study of Steyerberg et al., the bias of the resubstitution estimate was small, e.g., between 0.01 and 0.02 for the examples shown. In our simulation studies, the bias of the resubstitution estimate (not shown in the graphs) was also small for k=3, e.g., between 0.04 and 0.02 for the conditions in Fig. 3 and between 0.02 and 0.01 for the conditions in Fig. 6. For k=15, on the other hand, the bias of the resubstitution estimate was large, e.g., between .10 and .21 for the conditions in Fig. 1 and between 0.07 and 0.15 for the conditions in Fig. 5. Efron observed that ordinary bootstrap gives an estimate of the misclassification rate with a possibly large downward bias, particularly in highly overfitted situations.3 A downward bias for the error rate will typically correspond to an upward bias for the AUC, which is observed for the ordinary bootstrap method in Figs. 1a, 5a. Our observations are therefore consistent with Efron’s finding for highly overtrained classifiers, as well as the observation by Steyerberg et al. that, when the overtraining is small, the three bootstrap methods perform similarly, as shown in Figs. 3a, 6a.
Although the AUC has been described as one of the best summary measures to evaluate a classifier’s performance,18 we believe that it would be interesting to evaluate the effect of different resampling schemes for the prediction of other summary measures. The AUC measure uses only the relative ranks of the classifier scores, as implied by the Mann–Whitney statistics. Other measures that not only use the ranks but also the values of the classifier scores may be of particular interest. Two such measures are the Brier score,19 which uses a quadratic loss function to penalize large deviations of the classifier score from the desired class label, and the scored AUC method, which combines the rankings with the actual classifier scores.20 The previous study by Steyerberg et al.9 indicated that for both the AUC and Brier score measures, the bootstrap techniques were more accurate than twofold cross-validation.
We have used the LABROC method, which is a parametric maximum likelihood technique, to estimate the AUC in this investigation. Another widely used technique to estimate the AUC is the Mann–Whitney statistic, which is nonparametric. An extensive simulation study21 indicated that the biases in both the LABROC and the Wilcoxon–Mann–Whitney estimates of the AUC were for all practical purposes negligible, and concluded that concern about bias or precision of the estimates of the AUC should not be a major factor in choosing between the nonparametric and parametric approaches. However, the numbers of positive and negative cases used in some of our simulation conditions are smaller than those used in the previous study. Whether the relative performances of the resampling methods would change if the Wilcoxon–Mann–Whitney estimate of the AUC was used instead of LABROC estimate may warrant further investigations.
The conditions included in our simulation study were limited. The data vectors from the two classes were assumed to follow multivariate normal distributions, which is often violated in classification problems encountered in CAD. Only the LDA classifier was used, and feature selection was not included as a part of the classifier design problem. The largest feature space dimensionality in our simulations was k=15. The ratio of the number of cases from the two classes was either 1 or 3, which may be a realistic assumption for some lesion characterization problems, but may be too low for lesion detection problems. Finally, while the variability of the AUC estimate was investigated using a Monte Carlo method, our study does not answer the question of how this variability may be estimated in a practical situation. Yousef et al. have been developing methods to estimate this variability based on the available dataset.22 Despite these limitations, we believe that our study reveals important trends for the problem of classifier performance prediction under the constraint of a limited sample.
CONCLUSION
We compared the effectiveness of using different resampling techniques for classifier performance estimation in terms of the AUC, when a specific finite-sized sample is available for classifier design. The question we are interested in is “given a data sample x, what is the best method for predicting the performance of the classifier designed using x?”. We conducted a Monte Carlo simulation study and used the RMSE to measure the prediction error for different resampling techniques. Our results indicated that when the feature space dimensionality is relatively large (e.g., k=15), and the available sample size is small (e.g., total number of cases around 60), the difference in the RMSE obtained using different resampling methods can be large, indicating that the choice of resampling technique is important in classifier performance estimation. For the simulation conditions in our study, the 0.632+ bootstrap technique appeared to be superior to the others because it had a small bias and RMSE under conditions in which there were large differences between different techniques. When the feature space dimensionality was relatively small (e.g., k=3), all resampling techniques had a similar RMSE and relatively small bias in the range of sample sizes studied, indicating that none of them had a substantial advantage. The understanding of bias, variance, and RMSE issues in classifier performance estimation will provide us a useful guide to reduce errors in the assessment of classifier performance.
ACKNOWLEDGMENTS
This work is supported by USPHS Grant Nos. CA095153 and CA118305. The authors are grateful to Charles E. Metz, Ph.D. for the LABROC program.
References
- Chan H. P., Sahiner B., Wagner R. F., and Petrick N., “Classifier design for computer-aided diagnosis: Effects of finite sample size on the mean performance of classical and neural network classifiers,” Med. Phys. 10.1118/1.598805 26, 2654–2668 (1999). [DOI] [PubMed] [Google Scholar]
- Toussaint G. T., “Bibliography on estimation of misclassification,” IEEE Trans. Inf. Theory IT20, 472–479 (1974). [Google Scholar]
- Efron B., “Estimating the error rate of a prediction rule: Improvement on cross-validation,” J. Am. Stat. Assoc. 78, 316–331 (1983). [Google Scholar]
- Efron B. and Tibshirani R., “Improvements on cross-validation: The 0.632+ bootstrap method,” J. Am. Stat. Assoc. 10.2307/2965703 92, 548–560 (1997). [DOI] [Google Scholar]
- Hand D. J., “Recent advances in error rate estimation,” Pattern Recogn. Lett. 4, 335–346 (1986). [Google Scholar]
- Schiavo R. A. and Hand D. J., “Ten more years of error rate research,” Int. Statist. Rev. 68, 295–310 (2000). [Google Scholar]
- Tourassi G. D. and Floyd C. E., “The effect of data sampling on the performance evaluation of artificial neural networks in medical diagnosis,” Med. Decis Making 17, 186–192 (1997). [DOI] [PubMed] [Google Scholar]
- Arana E., Delicado P., and Marti-Bonmati L., “Validation procedures in radiologic diagnostic models: Neural network and logistic regression,” Invest. Radiol. 34, 636–642 (1999). [DOI] [PubMed] [Google Scholar]
- Steyerberg E. W., Harrell F. E., Borsboom G., Eijkemans M. J. C., Vergouwe Y., and Habbema J. D. F., “Internal validation of predictive models: Efficiency of some procedures for logistic regression analysis,” J. Clin. Epidemiol. 54, 774–781 (2001). [DOI] [PubMed] [Google Scholar]
- Yousef W. A., Wagner R. F., and Loew M. H., “Comparison of nonparametric methods for assessing classifier performance in terms of ROC parameters,” in Proceedings of the 33rd Applied Imagery Pattern Recognition Workshop (IEEE, 2004), pp. 190–195.
- Sahiner B., Chan H. P., Petrick N., Hadjiiski L. M., Paquerault S., and Gurcan M. N., “Resampling schemes for estimating the accuracy of a classifier designed with a limited data set,” Presented at the Medical Image Perception Conference IX, Airlie Conference Center, Warrenton, VA, September 20–23, 2001.
- Boos D. D., “Introduction to the bootstrap world,” Stat. Sci. 18, 168–174 (2003). [Google Scholar]
- Fukunaga K. and Hayes R. R., “Effects of sample size on classifier design,” IEEE Trans. Pattern Anal. Mach. Intell. 10.1109/34.31448 11, 873–885 (1989). [DOI] [Google Scholar]
- Lachenbruch P. A., “An almost unbiased method of obtaining confidence intervals for the probability of misclassification in discriminant analysis,” Biometrics 10.2307/2528418 23, 639–645 (1967). [DOI] [PubMed] [Google Scholar]
- Lachenbruch P. A., Discriminant Analysis (Hafner Press, New York, 1975). [Google Scholar]
- Metz C. E., Herman B. A., and Shen J. H., “Maximum-likelihood estimation of receiver operating characteristic (ROC) curves from continuously-distributed data,” Stat. Med. 17, 1033–1053 (1998). [DOI] [PubMed] [Google Scholar]
- Fukunaga K., Introduction to Statistical Pattern Recognition, 2nd ed. (Academic Press, New York, 1990). [Google Scholar]
- Bradley A. P., “The use of the area under the ROC curve in the evaluation of machine learning algorithms,” Pattern Recogn. 10.1016/S0031-3203(96)00142-2 30, 1145–1159 (1997). [DOI] [Google Scholar]
- Brier G. W., “Verification of forecasts expressed in terms of probability,” Mon. Weather Rev. 75, 1–3 (1950). [Google Scholar]
- Wu S. and Flach P., “A scored AUC metric for classifier evaluation and selection,” Proceedings of the ICML 2005 Workshop on ROC Analysis in Machine Learning (International Machine Learning Society, Bonn, Germany, 2005).
- Hajian-Tilaki K. O., Hanley J. A., Joseph L., and Collet J. P., “A comparison of parametric and nonparametric approaches to ROC analysis of quantitative diagnostic tests,” Med. Decis Making 17, 94–102 (1997). [DOI] [PubMed] [Google Scholar]
- Yousef W. A., Wagner R. F., and Loew M. H., “Estimating the uncertainty in the estimated mean area under the ROC curve of a classifier,” Pattern Recogn. Lett. 10.1016/j.patrec.2005.06.006 26, 2600–2610 (2005). [DOI] [Google Scholar]


