

Abstract
The calyx of Held is a morphologically complex nerve terminal containing hundreds to thousands of active zones. The calyx must support high rates of transient, sound-evoked vesicular release superimposed on a background of sustained release, due to the high spontaneous rates of some afferent fibers. One means of distributing vesicle release in space and time is to have heterogeneous release probabilities (Pr) at distinct active zones, which has been observed at several CNS synapses including the calyx of Held. Pr may be modulated by vesicle proximity to Ca2+ channels, by Ca2+ buffers, by changes in phosphorylation state of proteins involved in the release process, or by local variations in Ca2+ influx. In this study, we explore the idea that the complex geometry of the calyx also contributes to heterogeneous Pr by impeding equal propagation of action potentials through all calyx compartments. Given the difficulty of probing ion channel distribution and recording from adult calyces, we undertook a structural and modeling approach based on computerized reconstructions of calyces labeled in adult cats. We were thus able to manipulate placement of conductances and test their effects on Ca2+ concentration in all regions of the calyx following an evoked action potential in the calyceal axon. Our results indicate that with a non-uniform distribution of Na+ and K+ channels, action potentials do not propagate uniformly into the calyx, Ca2+ influx varies across different release sites, and latency for these events varies among calyx compartments. We suggest that the electrotonic structure of the calyx of Held, which our modeling efforts indicate is very sensitive to the axial resistivity of cytoplasm, may contribute to variations in release probability within the calyx.
Keywords: Synaptic transmission, release probability, computational neuroscience, auditory brainstem, electrotonic and active action potential propagation, axial resistance
The calyx of Held, perhaps the largest nerve terminal in the CNS, occupies a pivotal position in binaural circuits that process interaural temporal delay and intensity cues for sound localization (Held, 1893; Stotler, 1953; Harrison and Warr, 1962; Warr, 1966, 1972; Goldberg and Brown, 1969; Guinan et al., 1972; Elverland, 1977). Sound-evoked activity in globular bushy cells, which give rise to the calyx, can exceed 500 spikes/sec and is characterized by high temporal precision that tracks the acoustic fine structure of low frequency sound and amplitude modulation of high frequency sound (Pfeiffer, 1966; Blackburn and Sachs, 1990; Spirou et al, 1990; Smith et al., 1991; Joris et al, 1994). These activity patterns are sustained during long duration acoustic stimuli. Corollary in vitro studies reveal reliable invasion of the calyx terminal and generation of postsynaptic currents during high frequency stimulation of the calyceal axon (Wu and Kelly, 1993; Taschenberger and von Gersdorff, 2000).
Each calyx contains many active zones, ranging from several hundred to thousands (rodent: 300–700; cat: 2400) and the number of docked vesicles per active zone ranges from 2–4 at ages older than postnatal (P) day 9 (Rowland et al. 2000; Satzler et al., 2002; Taschenberger et al., 2002). A single action potential is estimated to cause fusion of 150–250 vesicles in rat calyx (Borst and Sakmann, 1996; Schneggenburger et al., 1999). Therefore, mechanisms exist to distribute vesicle fusion among release sites and provide for rapid re-loading of sites during periods of high activity (Wang and Kaczmarek, 1998; Kushmerick et al., 2006). One means of distributing release is to have heterogeneous release probabilities (Pr) at distinct active zones. Heterogeneous Pr has been observed across synapses of the same neuron and during stimulus trains in the CNS (Hessler et al., 1993; Rosenmund et al., 1993; Moulder and Mennerick, 2005), including the calyx of Held (Sakaba et al., 2002). Sites of low Pr can maintain a readily releasable vesicle pool of sufficient size to sustain vesicle fusion over seconds by avoiding premature pool depletion, especially if Pr is modulated during ongoing activity (Trommershauser et al., 2003). Pr could vary among vesicles at the same active zone or among neighboring active zones through variation in Ca2+ channel location or vesicle membrane proteins or active zone proteins that mediate each stage of vesicle docking, priming, and fusion (Wolfel et al., 2007).
More global features of the calyx could also result in different release probabilities among its structural elements. Calyces exhibit complex geometry, whereby large and small branches link through narrow necks to sequences of swellings of variable size (Morest, 1968; Rowland et al., 2000), so that action potentials may not propagate equally through all compartments. The distribution of ionic conductances within the calyx and its proximal axon is in the early stages of exploration and is another important determinant of electrical transmission to distal calyx elements. Na+ channels are sequestered into the proximal axonal heminode, perhaps to prevent Na+ loading of the calyx cytoplasm during ongoing activity (Leao et al., 2005). Low-voltage activated K+ channels (Kv1.1 and Kv1.2) also are located in the proximal heminode but not on the calyx, whereas high-voltage activated K+ channels (Kv3.1) are located exclusively on the calyx terminal (Dodson et al., 2003). To date, little is known about microdomain variation in Ca2+ signals in the adult calyx of Held, because manipulation and measurement of these signals has been performed mostly in relatively young calyces, which lack the geometric complexity of mature structures (Morest, 1968; Kandler and Friauf, 1993). Furthermore, these studies lack spatial and temporal resolution to isolate calyx elements and signals from single active zones. Given the difficulty of probing ion channel distribution and recording from adult calyces, we undertook a structural and modeling approach based on computerized reconstructions of calyces labeled in adult cats. As a result, we were able to manipulate placement of conductances and test their effects on Ca2+ concentration in all regions of the calyx following an evoked action potential in the calyceal axon.
Experimental Procedures
Surgical Procedures
Two adult cats were used in these anatomical reconstructions. All animal protocols were approved by the Institutional Animal Care and Use Committee at West Virginia University according to international guidelines. Procedures were designed to minimize the number of animals used in and pain during experiments. Animals were colony-raised (Harlan Sprague-Dawley, Minneapolis, MN, USA) and were free from ear infections and mites. They were decerebrated by aspiration through the rostral superior colliculus, verified visually, under ketamine (10 mg/kg; Fort Dodge Animal Health, Fort Dodge, IA, USA) anesthesia after receiving xylazine (10 mg; Phoenix Pharmaceuticals, St. Joseph, MO, USA) as a tranquilizer. No additional anesthetic was given after the decerebration. A tracheal cannula was inserted to maintain a clear airway and the bulla was vented with a length of small-bore polyethylene tubing. Temperature was maintained at 36–38°C and lactated Ringer’s solution was given regularly to preserve fluid volume. The animal was secured in a stereotaxic frame, and the floor of the fourth ventricle was exposed by partial aspiration of cerebellum. Electrodes were directed into the medial nucleus of the trapezoid body (MNTB) using surface landmarks of the brainstem. The exposure was infiltrated with 1% agar dissolved in normal saline to maintain integrity and temperature of the brainstem surface and preserve the surgical opening. Following determination that evoked activity was driven by contralateral sound, low molecular weight biotinylated dextran amine (BDA; 10% in normal saline; Vector Laboratories, Burlingame, CA, USA) was iontophoresed at the recording site (0.4 – 1.2 µA positive current, alternating 7 secs on and 7 secs off for 10 minutes). After three days the animal was deeply anesthetized with Nembutal (40 mg/kg; Abbott Laboratories, North Chicago, IL, USA) and perfused transcardially. Vascular rinse was accomplished by perfusion with 500 ml of a Ca2+-free variant Ringer's solution, pH 7.2, at room temperature (RT; all chemicals from Sigma, St. Louis, MO, USA, unless otherwise noted)‥ The mixed aldehyde fixative was composed of 4% freshly depolymerized paraformaldehyde and 0.2% and 0.2% glutaraldehyde (Polysciences, Warrington, PA, USA) in 0.12M sodium phosphate buffer (2 l; pH 7.2). Following perfusion the head was placed under ice for one hour, then kept in fixative overnight at 4°C. The brain was dissected from the skull, blocked in the transverse plane, hemisected and stored in cryoprotectant (30% sucrose) for 3 days.
Tissue Processing
Tissue was sectioned in the transverse plane at 45 µm thickness on a freezing microtome. Sections were collected in 0.5M Tris-HCl buffer pH 7.6, preincubated in hydrogen peroxide and methanol to reduce endogenous peroxidase activity, rinsed in Tris and washed in Tris-Triton to permeabilize cell membranes. BDA was visualized using an Elite ABC kit (Vector Laboratories) and incubated for up to 30 minutes in hydrogen peroxide and diaminobenzidine, intensified by the heavy metals nickel and cobalt. After rinsing in Tris buffer, all sections were dry mounted from a gelatin alcohol solution. Sections were counterstained with cresyl violet; every eighth section was not counterstained so that all areas of labeling could be identified easily.
Calyx Morphology
The three-dimensional morphologies of labeled calyces were reconstructed using Neurolucida software (MicroBrightfield, Williston, VT), interfaced with a motorized stage and Z-position readout on an upright microscope. Calyces were chosen for analysis if they were contained within single tissue sections. In order to represent morphological details accurately, small steps (typically 0.3 µm) were taken along the axis of calyx structures and the diameter of the structure at each location was registered.
Several analysis procedures were employed. The complexity of calyx branching was quantified by measuring fractal dimension. The box-counting method was employed for fractal analysis, as implemented by Neurolucida and double checked using independent freely–available software (Fractal Dimension Calculator, http://local.wasp.uwa.edu.au/~pbourke/fractals/fracdim/). The procedure is to count the number (N) of squares (boxes) in a square grid contacted by the calyx components as grids with decreasing square size are placed over the cell. Fractal dimension (D) is given by the relationship between increasing N and decreasing square size (s): , with larger numbers indicating increased complexity. We also performed quantification of the numbers of intersections of a spherical surface with the calyx structure as the radius of the sphere increases, which forms the basis of the Sholl analysis (Sholl, 1953) and is incorporated into the Neurolucida software. Spheres were centered at the base of the calyx, defined as the first branch point of the axon leading into the calyx. The maximum number of intersections and the radius at which this number occurred were determined (Ristanovic et al., 2006). Furthermore, the shape of the intersection number vs. radius plot was compared across calyces to determine the distance over which they maintained their complexity, quantified by measuring the half-width. Data were smoothed using Bezier functions (Gnuplot, version 3.7; http://www.gnuplot.info) and fitted with cubic splines prior to determining the half width of the plot. We did not perform log or semilog analyses of normalized (by area) intersection number vs. radius, as is typically performed in the Sholl analysis, because the structure of calyces, unlike dendrites, is constrained to the surface of the MNTB cell.
NEURON models
One calyx was chosen (see Results) to model electrical transmission of action potentials throughout the calyx geometry and the presynaptic Ca2+ currents induced by these signals. The calyx structure was converted by CVAPP (http://www.compneuro.org/CDROM/docs/cvapp.htm) software into hoc code for import into NEURON. The hoc code was inspected for its correspondence with the Neurolucida rendering and the calyx structure was verified by visual inspection using the CellBuilder option after its import into NEURON. Next, using custom software, calyx sub-structures were renamed according to terminology defined in Rowland et al. (2000) and the Results section to facilitate evaluation of model results.
Simulations were carried out in NEURON, version 6.01 (http://www.neuron.yale.edu/). The reconstructed morphology of the calyx was segmented into the axon, heminode, stalks, stems, swellings, necks, and swelling tips, which were treated as separate entities in NEURON. A MATLAB program was then used to reassemble the calyx, inserting new sections as necessary. In this way, each part of the calyx could be assigned separate biophysical mechanisms (ion channels, pumps, and passive properties) and conductance magnitudes. Portions of the calyx that appeared to contribute to specific electrotonic decrements were visually reinvestigated to confirm structure diameters, and these were manually readjusted if necessary in the final morphology file. At the start of each simulation, the spatial grid was adjusted both to incorporate an odd number of segments per calyx section, and to increase the number of segments (nseg) as necessary to assure computational stability (Hines and Carnevale, 2001). Due to the fine-grained nature of the initial reconstruction, this only yielded one or two more segments than were already described in the model. Simulations with the number of segments for each reconstructed section set to 11 did not alter the results, indicating that the spatial discretization was sufficient for numerical stability.
As described in the results, the distribution and density of ion channels in the calyx was a key manipulation in the model. We characterized the calyx in four different model variants: Standard, Uniform, High Ca2+ channel density, and High stalk Na+ channel density. For the standard model, the axonal heminode was populated with Na+ channels having a rapid recovery from inactivation (Rothman et al., 1993; Leao et al., 2005), and low-voltage activated K+ channels (Rothman and Manis, 2003b). The Na+ channels and low-voltage activated K+ channels (Kv1.1/Kv1.2/Kv1.6) are absent from the calyx itself (Dodson et al., 2003; Leao et al., 2005). However, the calyx was populated with high-voltage activated K+ channels (Kv3.1; Dodson et al., 2003, Elezegari et al., 2003) and Ca2+ channels (in adults, P-type; see Kajikawa et al., 2001 and Ishikawa et al., 2005). The uniform model had an even density for each conductance in all calyx compartments. The high Ca2+ channel density model was a variation of the standard model with, as indicated by its name, higher Ca2+ conductance within the calyx. The high stalk Na+ channel density model involved adding Na+ channels to calyx stalks, and is in essence a hybrid of the standard and uniform models.
The Kv3.1 model used the kinetic description of the high-voltage activated K+ channels from the cell bodies of bushy cells (the parent cell of the calyceal axon) by Rothman and Manis, (2003a, b). The P-type Ca2+ channel that predominates in the terminal was taken from the kinetic measurements in the calyx of Held by Borst and Sakmann (1998). Similar current descriptions of P-type Ca2+ channels from Purkinje cells (Khaliq et al., 2003), with modifications to the activation parameters so that they agreed with measurements made at the calyx (Cuttle et al., 1998), were also used in some simulations and yielded similar overall results. A Ca2+ pump mechanism (Hines and Carnevale, 2006) was also included in the calyx itself, but not in the axon. To simplify the simulations, Na+/Ca2+ exchangers and Na+/K+-ATPase pumps were not included in the model. The detailed equations used in the model are listed in the Appendix.
The magnitudes of the conductances were adjusted according to published measurements from calyx recordings as follows. Because the calyx geometry is complex, conductances were set by evaluating the calyx model in voltage clamp with an electrode at the junction of the axonal heminode and the calyx proper. All models were run at 37° C. Specific currents were isolated by setting all other conductances to 0, except for the leak conductance (glk), which was set to 10 µS/cm2 (for these simulations only; different leak conductances were used in each of the other formulations of the model as described below). The specific membrane capacitance was set to 1 µF/cm2, and axial resistivity (Ra) to 100 Ω·cm. The Na+ current ranged between 6 nA to 16 nA depending on age (Leao et al., 2005), so a Na+ conductance of 0.45 S/cm2 in the heminode segment was used. This value yielded a Na+ current under perfect voltage clamp in the model of about 10 nA for steps from −65 to 0 mV. K+ channels contribute 2–3 nA outward current at 0 mV (though see Ishikawa et al. (2003) who report currents as large as 20 nA). As a compromise, the low-voltage activated K+ channel was set to 0.04 S/cm2, and the high-voltage activated K+ channel to 0.02 S/cm2, in each case, yielding ~8nA steady-state current. This larger conductance set was used because it resulted in a narrower action potential with an appropriate undershoot, as compared to the weaker conductances. The Ca2+ current, as measured by Borst and Sakmann (1998), was 2 nA at room temperature, and about 4.5 nA at 36°C (at −30 mV; also see Cuttle et al., 1998; Kajikawa et al., 2001; and Ishikawa et al., 2005). Depending on conditions (Ra, glk, and channel distribution), a Ca2+ conductance of 0.003 S/cm2 was sufficient to produce currents of 4.5 nA at −20 mV at 37°C. The calyx also has a hyperpolarization-activated cation conductance, Ih (Cuttle et al., 2001), which was adjusted to produce −0.8 nA of current at −100 mV. This required a specific conductance of 0.95 mS/cm2 to be present in all parts of the calyx except the axon and heminode. In the standard model with non-uniform conductances, glk was set to 4.9 µS/cm2 in order to obtain an input resistance (measured at the junction between the axon and the calyx) of about 500 MΩ (Dodson et al., 2003). For each of the other models, glk was adjusted to set the input resistance to 500 MΩ as well.
An important unknown parameter in this model is the axial resisitivity (Ra) of the axoplasm and calyx cytoplasm. Ra has been notoriously difficult to measure directly in neurons. Estimated values of Ra have been derived through various modeling approaches in which Ra is adjusted as part of the fit of an anatomically detailed model to concurrently collected voltage responses to current pulses, and varies across cell types and with method. The overall range in the literature for dendrites indicates Ra of about 75–300 Ω·cm (Rall, 1977; Wilson, 1984; Stuart and Spruston, 1998; Golding et al., 2005). Axonal Ra appears to be lower; relatively direct measurements from squid giant axon indicated values of about 35–50 Ω·cm (Cole, 1975; Carpenter et al., 1975; but squid axoplasm has a greater total ionic concentration). Thus, in the present model, Ra was varied over a range from 50 – 300 Ω·cm. The simulations shown in this paper are all from current clamp manipulations, where a current pulse was injected into the axon at the junction between the axon and the calyx.
Results
Calyx Structure
We traced 16 calyces from two animals. Calyces had complex geometry, comprised of structural elements that were branches of variable width and length and swellings of variable size (Figure 1A; Rowland et al., 2000). The location of first order branches from the axon defined the base of the calyx. These branches, termed stalks, maintained a thick diameter (~4 µm) as they extended over the surface of the postsynaptic MNTB neuron. Second order branches, termed stems because they were thinner than stalks, could lead into a series of swellings, which were ellipsoid structures linked by thin segments (<1µm diameter) of short length termed necks. Third order branches typically originated as narrow necks that also led into a series of swellings and necks. Swellings varied in size from bouton-like to having long axis dimensions of greater than 5 µm. The last swelling along a branch could end in a very thin (<0.5 µm), short structure called a swelling tip. In Nissl-counterstained sections, the postsynaptic neuron was usually visible inside the labeled calyx. Most calyces approached the MNTB cell body at one pole and the outline of calyx elements defined the ellipsoid shape of the cell body (Fig. 1A, calyx #11; postsynaptic cells to calyces #3, #13 were not stained). A minority of calyces (4/16) approached the MNTB cell body along its short axis (Fig. 1A, cell #2). For one calyx, branches emerged orthogonally from a single stalk (Fig. 1A, cell #3).
Figure 1.
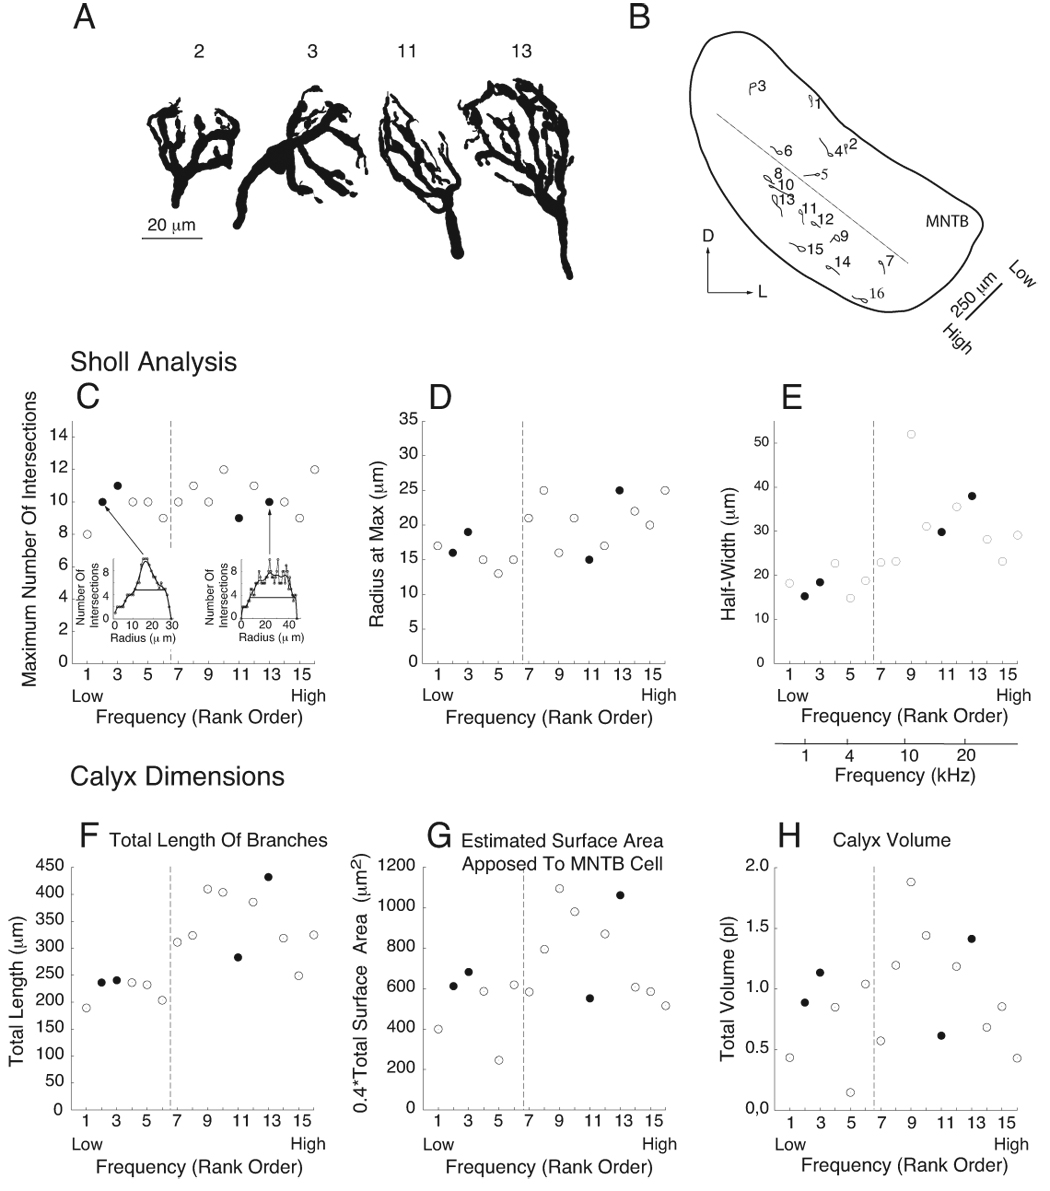
Structural Analysis of the Calyx of Held. A. Computerized tracings of four BDA-labeled calyces. Calyces are numbered by their position (rank order) along the tonotopic axis of the MNTB. Calyx 11 extended along the long axis of the postsynaptic cell; calyx 2 extended along the short axis of the cell. The cells contacted by calyces 3 and 13 were not stained. B. Locations of this population of 16 calyces projected onto a normalized section through the MNTB. Low frequencies located dorsolateral, high frequencies ventromedial. Each calyx (represented as an enclosure of its extremities) and the proximal length of axon contained within the tissue section are shown. Calyces were rank-ordered by position along the frequency axis. Dashed line separates MNTB into halves along the frequency axis. D, dorsal; L, lateral. C–E. Modified Sholl analysis. Vertical dashed lines, also in panels F–H, correspond to dashed line in panel B. Filled circles indicate the four calyces depicted in panel A. C. Calyces were similar in the maximum number of branches (peak value in the Sholl plots shown as insets). Sholl plots of number of branches vs distance from the base are shown for calyces #3 and #13. Plots are fit by splines and half width (horizontal lines) measured from the fitted plot. D. The distance from the base of the calyx at which the maximum number of intersections occurred varied over a factor of 2 but showed a slight frequency dependence. E. High frequency calyces maintained a high branch number over longer distances from the calyx base, as measured by the half width of the Sholl plot. A frequency scale, derived from Guinan et al. (1972), is applied in this panel to the normalized plot of calyx position in panel B as an approximation of the characteristic frequency for each calyx. F. High frequency calyces exhibited longer total branch length. G, H. Due to variation in the composition of calyces (number and size of stalks, branches and swellings), surface area apposed to the MNTB cell and calyx volume showed less dependence on frequency.
The population of calyces spanned the tonotopic axis of the cat MNTB and mostly occupied central portions of the isofrequency laminae (Guinan et al. 1972; Fig. 1B). Six calyces were located in the dorsolateral one-half portion of the MNTB. The dotted line in Fig 1B partitions the MNTB into halves along the frequency axis. We did not measure the CF associated with each calyx, so we refer in the following text to the two regions of the nucleus as the low frequency and high frequency regions. The complexity of calyx structure was analyzed using several methods and the relationship of these measures to low and high frequency regions of the MNTB was determined. Fractal dimension has been used to analyze the complexity of end bulbs and modified end bulbs of Held (Limb and Ryugo, 2000; Redd et al., 2000), which are terminals of auditory-nerve fibers onto bushy cells of the cochlear nucleus (Brawer and Morest, 1975; Lorente de No, 1981; Ryugo and Fekete, 1982). We applied this analysis to calyces of Held, which yielded small values (1.07 ± 0.07) that ranged from 1.02 – 1.12.
Sholl analysis of branching complexity (Sholl, 1953) revealed that the number of intersections of calyx elements with spherical shells centered at the calyx base increased with shell radius, reached a maximum and then declined to zero as the radius extended beyond the calyx dimensions (insets, Fig. 1C). This analysis also revealed relatively uniform complexity among calyces, with an average maximum number of intersections of 10.1 ± 1.0 and values that ranged between 8–12 and were similar between frequency regions. Calyces differed in the radius at which the maximum number was achieved, which averaged 18.9 ± 3.8 µm and ranged from 13 µm, indicating significant branching near the base, to 25 µm, approaching the opposite pole of the MNTB neuron (Fig. 1D). These parameters differed for the two frequency regions of the MNTB (P = 0.02, two-tailed Mann-Whitney U test). Some calyces exhibited sharp peaks in their Sholl plot, yet others had a relatively broad region near maximum values (Fig. 1C, insets). Therefore, we measured the half-width of the Sholl plots; this value was significantly greater at high frequency (Fig. 1E; P < 0.0001).
Calyces differed in the total length of branches (range 196 – 430 µm), which was greater in the high frequency region (Fig. 1F; P < 0.0001). Greater length could translate into a larger calyx volume, which would affect intracellular signaling events such as Ca2+ levels, and larger surface area, which would accommodate more synaptic sites. Total surface area of the calyx was calculated, and scaled by a factor of 0.4 to estimate the potential contact area with the MNTB cell. Some, but not all, calyces with longer branch length had greater surface area and volume, likely because calyces differed in their relative composition by stalks, stems and swellings and values did not differ by frequency region (Fig. 1G, P = 0.24; Fig. 1H, P = 0.28). The conglomerate structure of each calyx revealed large branches that diverge spatially and swellings isolated from stems and each other by narrow necks, such that synaptic machinery in these disparate regions could function independently. Therefore, we chose one of the most complex of this population of calyces (calyx #13) to model propagation of electrical signals from the axon into calyx compartments.
Modeling
Electrotonic structure of the calyx
The complex morphology of the calyx, with thin necks interposed between larger swellings, suggested that the structure is not likely to be isopotential even for injection of DC (direct current). To investigate this possibility, we examined the spatial distribution of voltage at each point in the model structure. Figure 2 shows these results, which were obtained by using the impedance tool in NEURON. For these simulations, we used the standard model, which incorporates published reports of spatially heterogeneous distributions of ion channels, whereby Na+, low-voltage activated K+ and Ih channels are located in the axon heminode leading into the calyx and Ca2+ and high-voltage activated K+ channels are located only in the calyx. A significant voltage drop is seen in the axon (going away from the site of current injection at the junction of the calyx and axon) because the low-voltage activated K+ channels are slightly active at rest in this cellular compartment and shunt current. The voltage drop is larger within the calyx as would be expected for a structure with thin diameter necks. Notably, there are two main domains, or tiers of voltage within the calyx. Most calyx compartments are in the upper tier, but one branch, which is longer and thinner in some places, shows a larger voltage drop towards its distal end and forms the lower tier.
Figure 2.
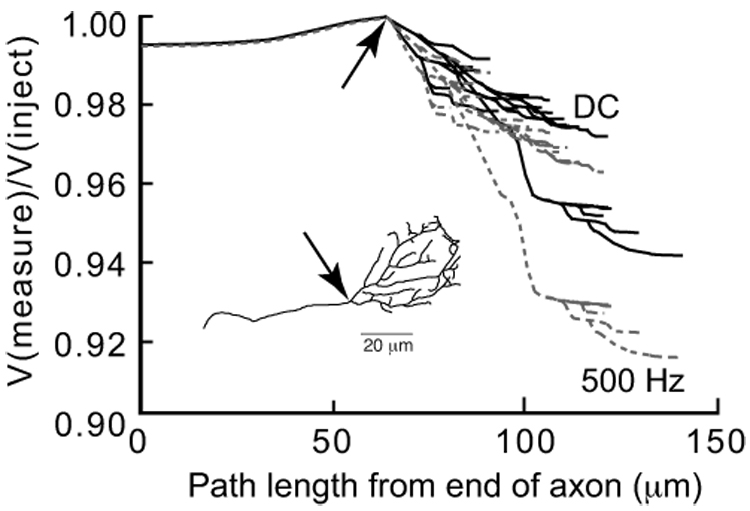
Spatial distribution of voltage drop in the calyx structure under standard model conditions, measured at both DC and 500 Hz using NEURON’s Impedance Tool. These plots of voltage throughout the structure were normalized to the voltage at the injection site, located at the junction between the axon and the calyx proper (indicated by the arrow on the inset schematic of the calyx). There are two tiers of voltage drops within the calyx, indicating that the calyx has electrotonically distinct compartments. This voltage drop is larger for higher frequencies (500 Hz, gray trace), reflecting the lower impedance of the calyx as seen by an action potential.
The calyx presents a significant capacitative load to the action potential due to its large membrane area. Experimental estimates of the calyx capacitance in rats and mice yielded values on the order of 18 – 25 pF, to as high as 40 pF (Borst and Sakmann, 1988, 1999; Taschenberger et al., 2002; Leao et al., 2005). Assuming a specific capacitance of 1 µF/cm2, we estimate capacitance values from calyx surface areas that range from 25 – 109 pF, reflecting the larger size of terminals in cats. The large capacitance will shunt current at higher frequencies, and thus was expected to significantly affect action potential propagation into the calyx. The action potential waveform is quite brief, lasting only 300–500 µsec, and has a broad spectral peak centered near 500 Hz. At this frequency, voltage amplitudes showed greater change within the calyx, decreasing by 1–9% in the standard model. These results suggested that the spread of action potential voltage throughout the calyx may not be uniform. Since action potential amplitude can critically control Ca2+ influx and release, especially in mature terminals (Wu et al., 2004; Yang and Wang, 2006; Borst and Sakmann, 1999), we next investigated action-potential evoked Ca2+ influx under different assumptions of channel distributions in the calyx and the proximal heminode of the axon.
Standard conductance distribution
Figure 3 shows the membrane voltage, Ca2+ current, and estimated Ca2+ concentration changes in the calyx for the standard model. Action potentials in these simulations were generated by stimulating the heminode-calyx junction (labeled J in the calyx reconstruction shown in Fig. 3B, inset) with a 0.2 msec, 5 nA current pulse. The effects of varying Ra and glk were assessed by averaging the peak action potential voltage across calyx locations for each combination of values. The mean peak value of the action potential in the calyx swellings decreased with increasing Ra and these changes were largely independent of glk (dotted lines in Fig. 3A are overlapping and not distinguishable). Two values for Ra (Ra = 100 Ω·cm; 200 Ω·cm) were chosen to demonstrate model results in the remaining panels. For illustration, the action potentials are shown for locations at the injection site (thin black trace), near the base of the calyx (I), at a swelling in the middle of the calyx (II), and at a distal swelling (III; Fig. 3B). For each Ra value (solid lines Ra = 100 Ω·cm; broken lines Ra = 200 Ω·cm) note that the action potentials showed a sudden diminution and broadening as they entered the calyx, and the amplitude within the calyx could vary across location by 10 mV or more. In addition to amplitude differences, there was also a latency shift of 110 and 180 µs for Ra = 100 and 200 Ω·cm, respectively, measured at the action potential peak as the action potential propagated from the junction with the heminode into the most distal regions of the calyx.
Figure 3.
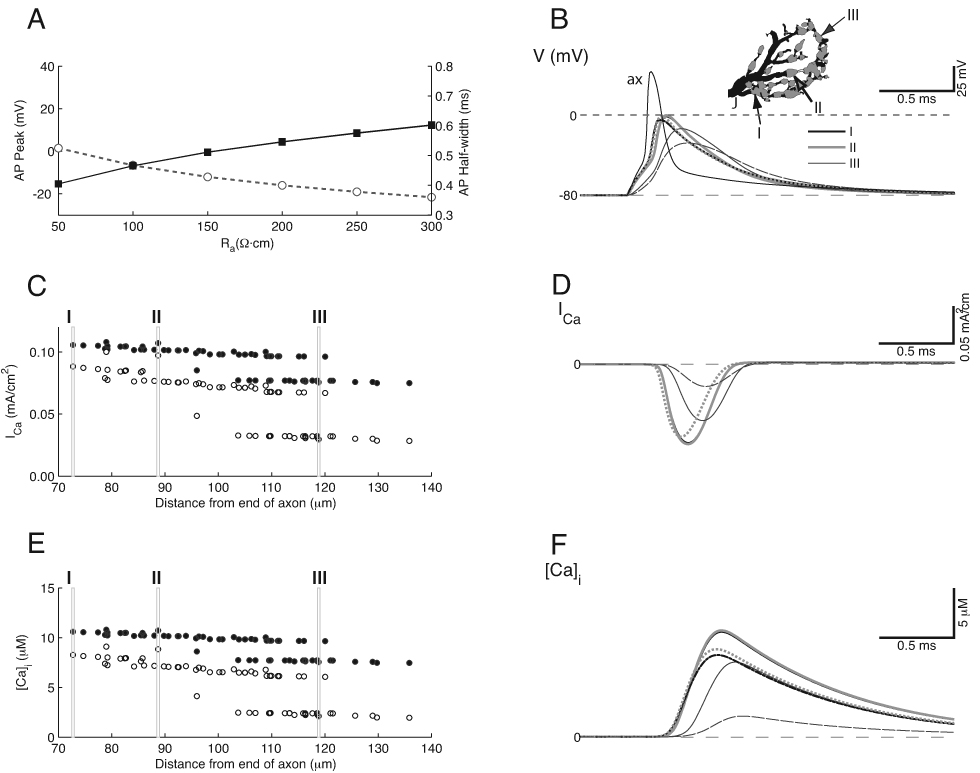
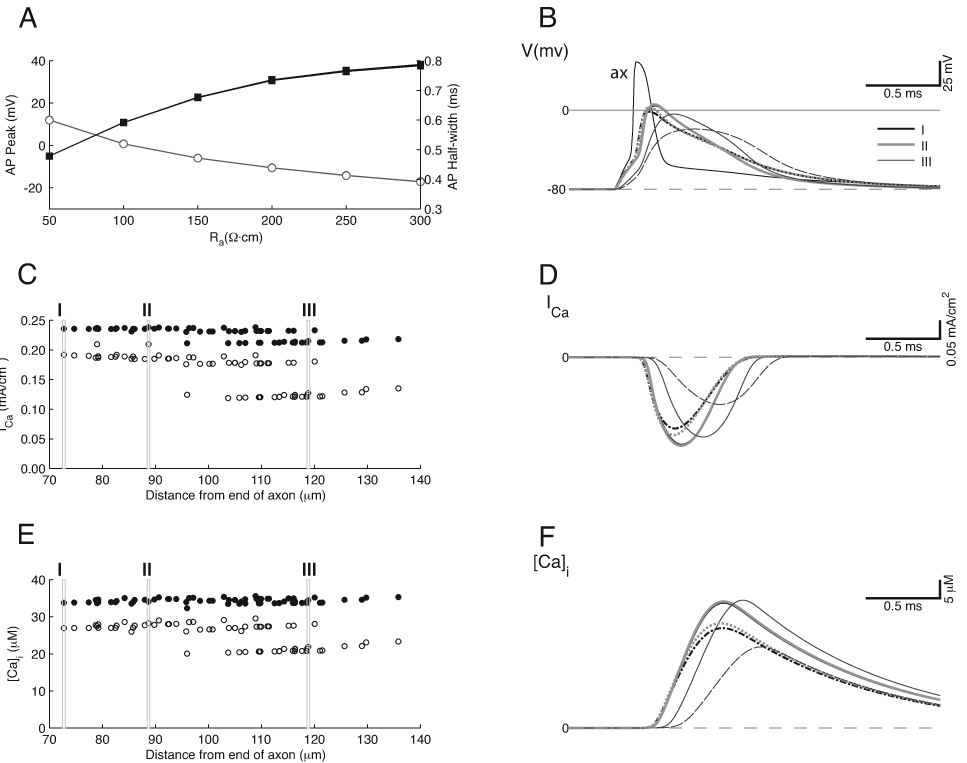
Spatially Heterogeneous “Standard” Model. A. Action potential height (left; gray open circles) and half-width (right, black filled squares) as a function of axial resistance, Ra. Each data point is the average over all swellings in the calyx. glk was also varied in these simulations over the range 1–10 µS/cm2, but changes due to glk are small and not visible. B. Action potential waveform where it invades the base of the calyx from the axon (thin black trace, labeled ax), and at three of the swellings (thick black, thick gray and thin gray traces, indicated in the inset in this Figure and Figure 4–Figure 6 by the Roman numerals I–III). The action potential is delayed, and becomes wider and smaller as it propagates into the calyx. Solid lines are from simulations for Ra = 100 Ω·cm, dashed lines for Ra = 200 Ω·cm. Traces for locations I and II nearly overlap. C. Peak Ca2+ current density for each of the 55 swellings in the calyx (note that some swellings are represented by more than one point when they were associated with a branch point; these symbols overlap), for Ra = 100 (filled circles) and 200 (open circles) Ω·cm. Two tiers of values are generated for each Ra value. ICa shows wider variation when Ra is 100 Ω·cm. D. Ca2+ current density time course for the same locations as in B, C; trace color, thickness and style corresponds to data in B. Note that the Ca2+ current is much smaller in the terminal swelling (location III), especially when Ra = 200 Ω·cm. E. Estimated peak intracellular Ca2+ concentration for the same conditions as in B–D. Each Ra value generates two tiers of peak Ca2+ concentration values. F. Estimated time course of Ca2+ concentration in the terminal.
For each choice of Ra (100 Ω·cm, solid circles and 200 Ω·cm, open circles), the Ca2+ current showed 2 tiers of values (Fig. 3C; each point represents a different location within the calyx), corresponding to the electrotonic structure shown in Figure 2. The lower tier was generated in large part by a single neck in the calyx, located along the middle process distal to swelling two (Fig. 3B inset). All swellings beyond this neck had reduced action potential amplitude and increased latency, as illustrated for location III in panel B. This two-tiered arrangement held even if the diameter of this neck was doubled, so it was both a function of the neck length and of the structure of the terminal region beyond this neck. We next assessed the effects of action potential heterogeneity on Ca2+ currents and levels as a functional link to neurotransmission. The Ca2+ currents arise mainly during the peak to falling phase of the action potential (Fig. 3D; Llinas et al., 1982). Due to the voltage-dependence of Ca2+ channel activation, the Ca2+ currents showed a modest difference depending on Ra, but a much larger, nearly 4-fold, difference depending on location. The intracellular Ca2+ concentration showed a similar variation with distance, and at the higher Ra value the lower tier of values could be less than one-half the upper tier values (Fig. 3E). This variation in values was also reflected in the estimated time course of intracellular Ca2+ concentration (Fig. 3F). Note that the Ca2+ concentration measured in the swellings peaked at about 10 µM, consistent with measurements in the literature for the Ca2+ concentration needed to produce fast and multiquantal EPSCs in the principal cell of the MNTB (Bollmann et al., 2000; Schneggenburger and Neher, 2000; Korogod et al., 2005).
The results from the standard model suggested that although the action potential invades the calyx, the amplitude depended critically on the calyx geometry, including the locations of necks and swellings. Consequently, the resulting Ca2+ influx could vary in different regions of the calyx. Although the distribution of ion channels in the standard model was based on observations in the literature, it is possible that these distributions change with maturity or, due to the sensitivity of immunofluorescence staining and detection, that a low density of channels exists in the calyx. Thus, we performed three further sets of simulations in which we tested three specific hypotheses regarding the ion channel distribution, action potential invasion, and Ca2+ influx within the calyx. These simulations suggested specific advantages for rapid synaptic transmission that may be conferred by a spatially heterogeneous distribution of channels.
Uniform conductance distribution
The next model we tested was the uniform model (Fig. 4; uniform distribution of each conductance in all calyx compartments, as defined in Methods), to gain insight into advantages and disadvantages of a spatially heterogeneous arrangement of ion channels. This configuration resulted in a consistent shape of action potentials and hence their peak amplitudes, which varied by less than 0.3 mV over the entire calyx, and the half-width values varied by less than 10 µs (Fig. 4A). Nonetheless, action potential latency did vary across the structure and between the axon and calyx. Both the Ca2+ current (Fig. 4C, D) and concentration (Fig. 4E, F) showed very little variation among calyx compartments. Indeed, the two-tiered distribution of currents was eliminated when each channel density was uniform. The small propagation delay that was visible in the action potential (40 µs for Ra = 100 Ω·cm, and 20 µs for Ra = 200 Ω·cm) also appeared in the time course of the Ca2+ currents and Ca2+ concentration (Figure 4D, F), but this delay was much smaller than in the standard model (compare with Figure 3). The larger action potentials within the calyx activated Ca2+ channels during the rising phase of the action potential (Fig. 4D). This resulted in a slight reduction or inflection in current as the driving force for Ca2+ decreased near the peak of the action potential, and then a larger current during the falling phase as expected from the increase in driving force, and in analogy to what occurs during the action potential for Na+ currents in the Hodgkin-Huxley model of the squid giant axon.
Figure 4.
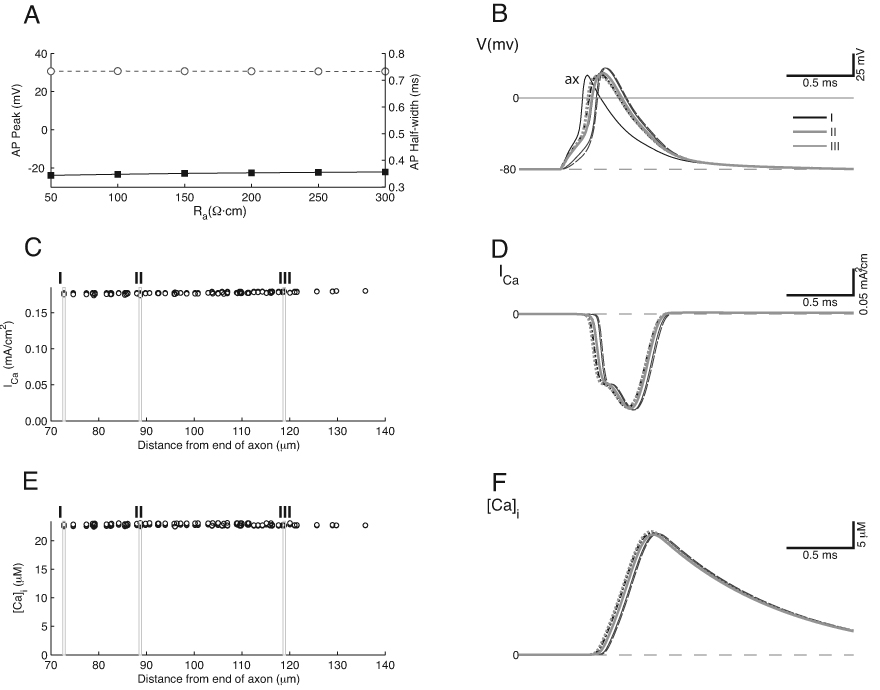
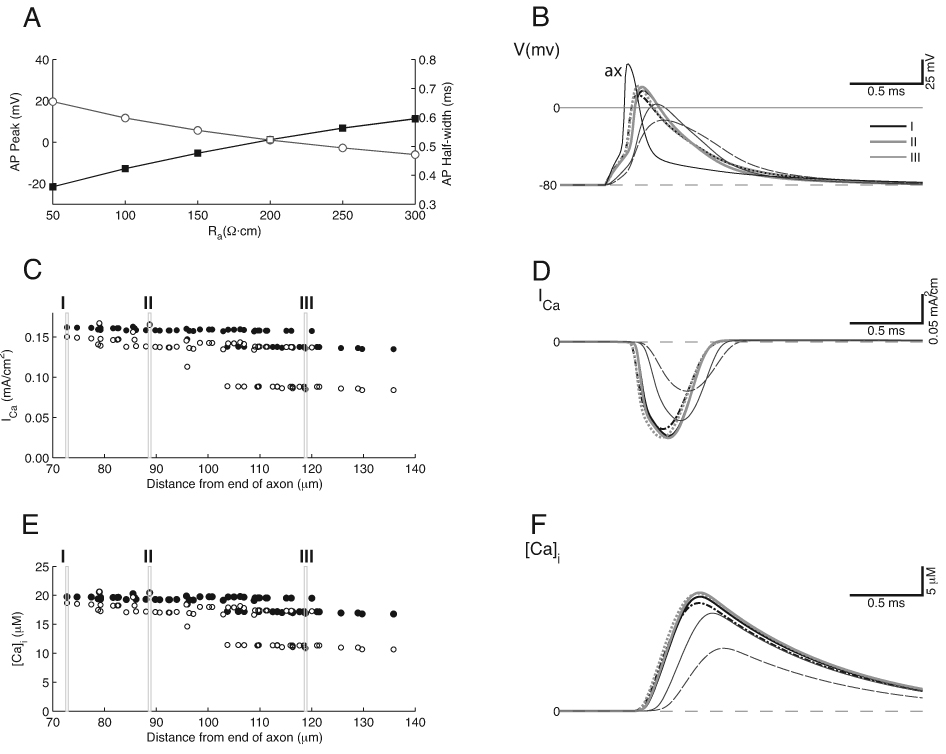
Spatially Homogeneous “Uniform” Model. This model was generated by setting the Na+ and K+ currents, as measured in voltage clamp, to the same values as in Figure 3, while distributing the channels at a uniform density throughout the calyx. A. Action potential height and half-width is independent of Ra. B. Action potential time course is similar in all calyx compartments but independent of Ra, although small latency shifts remain. Measurements taken from same calyx compartments as in Figure 3. C. Ca2+ current density is uniform throughout the calyx. D. The Ca2+ current shows an inflection on the rising phase as the action potential voltage approaches ECa. E, F. The time course of the Ca2+ influx is uniform throughout the calyx, with only slight latency shifts across the structure.
Increased Ca2+ channel density in the calyx swellings
The data from the standard model suggested that the restricted distribution of the Na+ channels in the heminode, but not in the calyx proper, as suggested by Na+ channel antibody staining (Leao et al., 2005), led to a situation where the action potential invaded the terminal passively, producing variable Ca2+ channel activation within the calyx. Given this situation, the excitability of the calyx may be governed in part by the Ca2+ channels, which, similar to Na+ channels, could contribute to depolarization of the calyx. To investigate this scenario, we explored a variation in the standard model in which the Ca2+ channel density in the calyx was raised by a factor of 2 (Fig. 5). The action potential peak value was approximately 10 mV larger than with the standard model, although the distribution of action potential peak values showed a similar dependence on Ra (Fig. 5A). The action potential half-width was also larger by approximately 20% (Fig. 5A), and a pronounced afterdepolarization became evident in the action potential at all calyx locations, as well as in the axon (Fig. 5B). Although the voltage drop along the calyx was less than for the standard model, unlike the uniform model the Ca2+ influx retained a two-tiered profile that depended on the geometry of the calyx (Fig. 5C). The time course of the Ca2+ current was also broader than in the standard model (Fig. 5D). Consistent with the increased channel density, the estimated Ca2+ concentration in the swellings was double that for the standard model (Fig. 5E, F), and thus was notably larger than that measured in physiological studies (Bollmann et al., 2000; Schneggenburger and Neher, 2000). Since the higher Ca2+ current density widened the action potential in the calyx and produced a broader Ca2+ influx, this channel configuration may reduce the temporal precision of transmitter release and it may also produce premature vesicle pool depletion and synaptic depression by raising overall Pr.
Figure 5.
Standard Model with Increased Ca2+ channel density. A 2-fold increase in the calyx Ca2+ channel density widens the action potential and the duration of Ca2+ current (compare with Fig. 3). A. Average action potential peak value (open circles) is slightly higher, and the half-width is greater than for the standard model. B. Action potentials are wider with a distinct hump on the falling phase with elevated Ca2+ channel density. Measurements taken from same calyx compartments as in Figure 3. C. The distribution of Ca2+ current amplitudes is compressed when Ra = 100 Ω·cm, but still shows a two-tiered separation in different parts of the calyx when Ra = 200 Ω·cm. D. The duration of the Ca2+ current is longer with elevated channel density. E. Peak Ca2+ concentration is nearly uniform across the calyx when Ra = 100 Ω·cm; however, as with the Ca2+ current, there are still 2 tiers of values when Ra = 200 Ω·cm. F. The Ca2+ concentration shows latency shifts similar to those in the standard model.
Increased Na+ channel density in the stalks
In the final simulation, we considered another variation of the standard model whereby Na+ channels located in the calyx stalks (in addition to the axon) emerging from the base of the calyx might provide a compromise situation that would boost the action potential amplitude throughout the calyx yet avoid the deleterious effects of Na+ channels positioned near all vesicle fusion sites (Leao et al., 2005). For this simulation, the stalk and heminode Na+ channel densities were made equal. The Na+ channel density in both compartments was then reduced from the standard value of 0.45 S/cm2 to 0.38 S/cm2, which produces the same peak Na+ current as the standard model (when we increased the total membrane area containing Na+ channels, the same peak Na+ current is produced at a lower channel density). Even though only a restricted region of the calyx close to the axon was endowed with Na+ channels, the action potential peak value, relative to the standard model, was nearly 20 mV larger throughout most of the calyx (Fig. 6A), without a significant change in the half-width. Even though the peak value was larger, the action potential time course throughout the calyx remained similar to the standard model (Fig. 6B). The increased action potential amplitude narrowed the distribution of Ca2+ current density along the calyx and yielded larger values overall (Fig. 6C), similar to the case where we raised the Ca2+ channel density. A multitiered pattern of Ca2+ currents was still present, and most prominent when Ra was 200 Ω·cm (Fig. 6C). The time course of the Ca2+ influx was intermediate between the standard and uniform cases (Fig. 6D). An inflection was visible on the rising phase of the Ca2+ current, but it was not as pronounced as when the entire calyx contained Na+ channels. The estimated Ca2+ concentration (Fig. 6E, F) was also large (due to the larger action potentials) and approached 20 µM, but not as large as the case where the Ca2+ channel density was elevated.
Figure 6.
Standard Model with addition of Na+ channels in the proximal stalks. Na+ channel density was adjusted so that peak Na+ currents were the same as in the standard model of Figure 3. All other parameters and conventions are the same as for Figure 3. A. Action potential amplitude is significantly higher than in the standard model, although the width remains the same. B. The action potential shapes are similar to the standard case, except that with higher Ra, the most distal swellings have a slight hump on repolarization (thin gray dashed line for swelling III). Measurements taken from same calyx compartments as in Figure 3. C. Ca2+ current density in the swellings is higher than the standard model, and the decrease with distance from the axon is less than in the standard model. Two tiers of Ca2+ influx remain. D. The Ca2+ current has a brief time course, although there is a slight inflection on the rising phase of the current in the proximal regions of the calyx. E. The distribution of Ca2+ concentration exhibits two tiers. However, the decrease with distance is less than in the standard case, such that the Ca2+ influx in the more distant portions of the terminal is higher. F. Ca2+ concentration shows higher values in the more proximal regions of the calyx due to a larger action potential but a similar time course as the standard case.
Discussion
We employed a combination of anatomical reconstruction and computational modeling to demonstrate several features and functional consequences of the complex calyx of Held geometry: (1) Although calyces were similar in complexity, they differed greatly in morphology and the total length of branches was greater at high frequency locations; (2) Ra, especially for calyx branches of long length, is an important factor in action potential attenuation across calyx compartments; (3) Attenuated voltage can limit Ca2+ currents and lead to Ca2+ concentration changes that vary among calyx compartments; (4) The latency of Ca2+ concentration changes also varies among calyx compartments, which could introduce jitter into the timing of vesicle release in response to single action potentials. Therefore, (5) an additional mechanism for variation in vesicle release probability is the complex electrotonic structure of the calyx.
The complexity of calyx geometry, reported here as fractal dimension, was less than that of the largest nerve terminals of auditory-nerve fibers in the cochlear nucleus, the end bulbs of Held (Ryugo et al., 1998), but was similar to another large auditory-nerve terminal, the modified end bulbs (Redd et al., 2000). Our observation that fractal dimension was independent of calyx size corresponds to observed changes of modified end bulb size in deaf animals without a change in this parameter (Redd et al., 2000). End bulbs are smaller than calyces, and likely more similar in size to calyces in smaller animals such as rodents. If calyces in rodents are more complex geometrically than in cats, then their electrotonic properties could also generate variable vesicle release probability. A topographic gradient was observed in measures of the half-width of the Sholl plot and the total length of calyx processes. Calyces located in the dorsolateral (low frequency) MNTB were smaller and showed less branching, which may result in a more compact electrotonic structure. One consequence of this organization may be more synchronous Ca2+ currents among calyx compartments that underlie high fidelity transmission of the acoustic fine structure of low frequency sound.
The calyx model permitted us to explore permutations of a spatially heterogeneous distribution of ion channels that cannot currently be accomplished experimentally. These simulations showed that increasing Ca2+ conductance in the calyx compensated in part for the lack of Na+ channels but that it broadened action potentials and would likely reduce temporal fidelity, perhaps by leading to multivesicular release at individual active zones. Increased Ca2+ channel density and uniform calyx Na+ channel density both lead to broadening of Ca2+ influx and may be contraindicated at a synapse where temporally precise and brief transmitter release is functionally important. Furthermore, high Ca2+ loads may be toxic to the terminal and Ca2+ has been shown to inhibit the Na+/K+-ATPase of the P16 rat calyx nerve terminal (Kim et al., 2007).
Introducing Na+ and low-voltage activated K+ channels into all calyx compartments, which is contrary to published reports, removed the variation in Ca2+ concentration and latency, but may lead to large Na+ concentrations in small calyx compartments. This situation will cause Na+/Ca2+ exchangers (the main Ca2+ extrusion mechanism of the calyx of Held; Kim et al. (2005)) to operate less efficiently. Creating a compromise situation by placing Na+ channels into the calyx stalks made Ca2+ concentration changes more similar, but even this permutation of the standard model still generated physiologically meaningful differences among calyx compartments. Therefore, it is likely that Ca2+ levels differ among compartments. To underscore this idea, all of our simulations, with the exception of those with uniform Na+ channel distributions, produced variations in Ca2+ current density, depending on the assumed value for Ra, of 2–5 fold across the calyx.
A key unmeasured parameter of the model was Ra of the calyx cytoplasm. We varied this parameter over a wide range of values typical of those found in the literature for axons and dendrites (Cole et al., 1975; Rall, 1977; Wilson, 1984; Golding et al., 2005). Over this range, there were significant variations in action potential peak voltage and width as it invaded the calyx. Clearly, Ra within the calyx is an important parameter, but even with the lowest values the voltage within the calyx was not uniform, largely due to the presence of small necks in the calyx. The small diameter necks produce a larger voltage-divider effect along a stem, which is especially pronounced when the membrane area beyond the neck is large. In the particular calyx modeled here, this morphological organization produced a second tier of swellings in the calyx, all of which were distal to a single neck. These swellings will see a smaller action potential, and likely a smaller Ca2+ influx, and would be expected to contribute a population of release sites with low Pr.
Given that release is related to approximately the 4th power of the Ca2+ concentration at the calyx (Borst and Sakmann, 1996, Schneggenburger and Neher, 2000, Bollman and Sakmann, 2005), and assuming that the Ca2+ influx does not saturate the release sites, differences in Ca2+ concentration could lead to significantly different Pr among calyx compartments and contribute further to heterogeneity of release. Indeed, based on the model presented by Schneggenburger and Neher (2000), where varation from 5 to 25 µM Ca2+ is associated with 700-fold variation in the release rate (see Schneggenburger and Neher, 2005), we expect that small variations in action potential invasion efficacy could be associated with quite significant changes in release. Consideration of global effects of geometry on release probability bears similarities to the idea that branch block can affect short term depression among a group of synaptic inputs (Brody and Yue, 2000), although vesicle release is affected differently in that branch block results in complete failure of release at some sites, whereas decrement in action potential amplitude within the calyx terminal will result in graded differences in release.
Using paired recordings in the calyx of Held, Yang and Wang (2006) have suggested that there is little voltage drop from one side of the calyx structure to the opposite distal side. However, estimates based on their data suggest that the voltage drop of the peak of the action potential might be as large as 10 mV. In addition, these measurements were made in the mouse calyx of Held at P12. These calyces are significantly smaller, and more compact, and less fenestrated at this age than mature calyces of Held (bat: Kuwabura et al., 1991; rat: Kandler and Friauf, 1993; mouse: Limb and Ryugo, 2000), on which our models have been based. Finally, we emphasize that even the more compact and presumably isopotential calyx in P8–P10 rat has heterogenous Pr and distinct types of readily releasable vesicle pools (Iwasaki and Takahashi, 2001; Sakaba and Neher, 2001). Those experiments highlighted other mechanisms for variable Pr involving molecular differences among synaptic vesicles and active zones.
The calyx model is based on physiological measurements from different studies for individual conductances, and for some of the channels detailed kinetic information is only available for measurements made at the cell body, rather than the terminal. Nonetheless, the shape of the action potential in the standard model reasonably resembles that seen in current clamp. However, when we explored changes in channel density in the non-standard models, several differences appeared that are not consistent with published data, suggesting that the standard model is a reasonably close approximation to in vitro measurements. First, increasing Ca2+ channel density produced a clear hump on the falling phase of the action potential. There is a small Ca2+-dependent component to the falling phase of the calyceal action potential (Borst and Sakmann, 1998), but it more closely resembles the shape in the standard model rather than the shape in the high Ca2+ channel density model. Similarly, the Ca2+ currents recorded experimentally have a smooth, nearly Gaussian, time course, and the standard model reproduces this well. Note that both models with additional Na+ channels (the uniform model and the model with Na+ channels in the proximal stalks) produced Ca2+ currents that had inflections on their rising phases. The Gaussian shape of the calyx Ca2+ current triggered by a single action potential was recorded from a P8–P10 rat, so subtle differences in the model may be attributable to the young age of recorded calyces (generally < P18) or species differences between rodent and cat. Ca2+ currents in adult animals of any of these species could be double peaked if Ca2+ channel density is higher in older animals. Nevertheless, based on these observations, it appears that the standard model provides the closest fit to the available experimental data.
An issue for interpretation of these modeling efforts is that not only physiological but also anatomical data that are available to constrain the model are based on experiments using young rats and mice (P8–10; Dodson et al., 2003; Leao et al., 2005), whereas the anatomical scaffold for the model is based on the adult cat calyx of Held. Myelination has begun at the ages when Na+ and K+ channels were mapped (Foran and Peterson, 1992), but localization of channels may change with further maturation. Modeling permits exploration of functional consequences of these channel arrangements in the adult calyx. These results can guide design of new experiments and modeling efforts to explore and interpret calyx design features. For example, calyces may populate only stalks with Na+ channels, but at lower density than we used, and perhaps at levels that elude detection via immunofluorescence. More detailed mapping of Na+ channels with regard to calyx compartments, especially at the base of the calyx, together with a parametric, computational exploration of Na+ channel density may reveal that calyces do invoke this compromise situation. Another consideration is the application of data from mice and rats to cats. Based upon similarities in response properties of bushy and MNTB cells across species (Yin, 2002; Manis, 2008), it is likely that fundamental channel properties and the channel composition of cell types are also conserved. An important difference among species that may impact our approach is the extended low frequency audible spectrum of cats, especially given the tonotopic dependence for expression of K+ channels by MNTB neurons (von Hehn et al., 2004; Brew and Forsythe, 2005). However, we chose to model a calyx selected from the middle portion of the nucleus, corresponding to a high frequency region that overlaps the hearing range of mice and rats.
Globular bushy cells of the ventral cochlear nucleus are the parent cells of the calyx. These cells respond to the onset of tone-burst stimuli with firing rates exceeding 500 spikes/sec, can have sustained firing rates that can be nearly as high, and spontaneous rates that range from near 0 to greater than 100 spikes/sec (Brownell, 1975, Spirou et al. 1990, Joris et al, 1994). The wide dynamic range of firing rates that drive the calyx presents a challenge for synaptic transmission. Presynaptic zones with high Pr can effectively transmit information in a timely manner when the afferent cell rate increases rapidly, such as during the onset of a sound. However, high-Pr sites will depress rapidly with sustained input. On the other hand, sites with low Pr will perform better at communicating activity during sustained periods of firing. Thus, a single terminal that distributes the incoming spike pattern among sites with diverse release probabilities, which our model shows to be one consequence of the non-uniform electrotonic structure of calyx synapses, may enhance their ability to effectively operate over a wider range of afferent activity.
In summary, the complex morphology of the mature calyx of Held, with thin necks connecting larger swellings, along with a specific segregation of ion channels between the calyx and axon, leads to a situation where action potentials invading the calyx do so in a variable fashion. These factors, in conjunction with the nonlinear activation of Ca2+ channels by action potentials, and the approximately 4th power relationship between Ca2+ and release, support the notion that release probability varies among distinct sites within the calyx. Calyx geometry is yet another mechanism to contribute to variable release, and our model suggests that there may be a morphological segregation of high and low Pr sites from the proximal to distal reaches of the calyx. Upon this functional organization may be superimposed additional variability in molecular mechanisms for vesicle release that affect Pr. Such variance in Pr can contribute to maintenance of transmitter release at this nerve terminal during both high transient rates of afferent activity, as well as during sustained acoustic stimulation.
Acknowledgements
We thank Christopher Kushmerick for his helpful comments on an earlier version of the manuscript. This work was supported by NIH grants R01 DC005035 to GAS, R01 DC004551 to PBM and R01 DC004274 to HvG, and NCRR/COBRE grant RR15574 to the WVU Sensory Neuroscience Research Center.
Abbreviations
- BDA
Biotinylated dextran amine
- BF
Best frequency
- Ca2+
Calcium
- DC
Direct Current
- EPSC
Excitatory postsynaptic current
- g
Conductance
- K+
Potassium
- MNTB
Medial Nucleus of the Trapezoid Body
- Na+
Sodium
- Pr
Synaptic vesicle release probability
- Ra
Axial resistance
Appendix
Model Equations
The calyx model consists of multiple electrical compartments: an axon, the stems, stalks, necks, swellings, and tips (see Table A1). Each compartment includes a membrane capacitance (Cm) connected in parallel with a leakage current (Ilk). In the canonical model, the axon includes low-threshold K+ current (ILT) (representing heteromultimers of Kv1.1, Kv1.2 and Kv1.6) and a fast-inactivating TTX-sensitive Na+ current (INa). The remainder of the calyx membrane contains a high-threshold K+ current (IHT), representing Kv3.1 channels, along with a calcium current from the data of Borst and Sakmann (1998), corresponding to the P-type calcium channel. The calyx also includes a hyperpolarization-activated cation current (Ih). The voltage-gated potassium currents in the calyx model are derived from those in Rothman and Manis (2003b); the voltage-gated sodium current was from Rothman et al (1993). In the present model, the ion reversal potentials are: VK = −77 mV, VNa = +50 mV, Vh = −43 mV, and Vlk = −65 mV. The conductances in each compartment are listed in Table A1. The equations for each conductance are described in the Hodgkin-Huxley form as given below.
Table A1.
Standard Model Parameters
| Compartment |
|||||||
|---|---|---|---|---|---|---|---|
| Conductance | Axon | Heminode | Stalk | Stem | Swelling | Neck | Tip |
| 0.45 | 0.45 | 0 | 0 | 0 | 0 | 0 | |
| 0 | 0 | 0.02 | 0.02 | 0.02 | 0.02 | 0.02 | |
| 0.04 | 0.04 | 0 | 0 | 0 | 0 | 0 | |
| 0 | 0 | 0.95 | 0.95 | 0.95 | 0.95 | 0.95 | |
| 0 | 0 | 0.003 | 0.003 | 0.003 | 0.003 | 0.003 | |
| 4.9 | 4.9 | 4.9 | 4.9 | 4.9 | 4.9 | 4.9 | |
The sodium current:
| (A1) |
| (A2) |
| (A3) |
| (A4) |
| (A5) |
| (A6) |
| (A7) |
| (A8) |
The low-threshold K+ current:
| (A9) |
| (A10) |
| (A11) |
| (A12) |
| (A13) |
The high-threshold K+ current
| (A14) |
| (A15) |
| (A16) |
| (A17) |
| (A18) |
The hyperpolarization-activated cation current
| (A19) |
| (A20) |
| (A21) |
The calcium current
| (A22) |
| (A23) |
| (A24) |
The leak current
| (A25) |
References
- Blackburn CC, Sachs MB. The representations of the steady-state vowel sound /e/ in the discharge patterns of cat anteroventral cochlear nucleus neurons. J Neurophysiol. 1990;63:1191–1212. doi: 10.1152/jn.1990.63.5.1191. [DOI] [PubMed] [Google Scholar]
- Bollmann JH, Sakmann B, Borst JG. Calcium sensitivity of glutamate release in a calyx-type terminal. Science. 2000;289:953–957. doi: 10.1126/science.289.5481.953. [DOI] [PubMed] [Google Scholar]
- Bollmann JH, Sakmann B. Control of synaptic strength and timing by the release-site Ca2+ signal. Nat Neurosci. 2005;8:426–434. doi: 10.1038/nn1417. [DOI] [PubMed] [Google Scholar]
- Borst JG, Sakmann B. Calcium influx and transmitter release in a fast CNS synapse. Nature. 1996;383:431–434. doi: 10.1038/383431a0. [DOI] [PubMed] [Google Scholar]
- Borst JG, Sakmann B. Calcium current during a single action potential in a large presynaptic terminal of the rat brainstem. J Physiol. 1998;506(Pt 1):143–157. doi: 10.1111/j.1469-7793.1998.143bx.x. [DOI] [PMC free article] [PubMed] [Google Scholar]
- Borst JG, Sakmann B. Effect of changes in action potential shape on calcium currents and transmitter release in a calyx-type synapse of the rat auditory brainstem. Philos Trans R Soc Lond B Biol Sci. 1999;354:347–355. doi: 10.1098/rstb.1999.0386. [DOI] [PMC free article] [PubMed] [Google Scholar]
- Brawer JR, Morest DK. Relations between auditory nerve endings and cell types in the cat's anteroventral cochlear nucleus seen with the Golgi method and Nomarski optics. J Comp Neurol. 1975;160:491–506. doi: 10.1002/cne.901600406. [DOI] [PubMed] [Google Scholar]
- Brew HM, Forsythe ID. Systematic variation of potassium current amplitudes across the tonotopic axis of the rat medial nucleus of the trapezoid body. Hear Res. 2005;206:116–132. doi: 10.1016/j.heares.2004.12.012. [DOI] [PubMed] [Google Scholar]
- Brody DL, Yue DT. Release-independent short-term synaptic depression in cultured hippocampal neurons. J Neurosci. 2000;20:2480–2494. doi: 10.1523/JNEUROSCI.20-07-02480.2000. [DOI] [PMC free article] [PubMed] [Google Scholar]
- Brownell WE. Organization of the cat trapezoid body and the discharge characteristics of its fibers. Brain Res. 1973;94:413–433. doi: 10.1016/0006-8993(75)90226-7. [DOI] [PubMed] [Google Scholar]
- Carpenter DO, Hovey MM, Bak AF. Resistivity of axoplasm. II. Internal resistivity of giant axons of squid and Myxicola. J Gen Physiol. 1975;66:139–148. doi: 10.1085/jgp.66.2.139. [DOI] [PMC free article] [PubMed] [Google Scholar]
- Cole KS. Resistivity of axoplasm. I. Resistivity of extruded squid axoplasm. J Gen Physiol. 1975;66:133–138. doi: 10.1085/jgp.66.2.133. [DOI] [PMC free article] [PubMed] [Google Scholar]
- Cuttle MF, Rusznak Z, Wong AY, Owens S, Forsythe ID. Modulation of a presynaptic hyperpolarization-activated cationic current (I(h)) at an excitatory synaptic terminal in the rat auditory brainstem. J Physiol. 2001;534:733–744. doi: 10.1111/j.1469-7793.2001.00733.x. [DOI] [PMC free article] [PubMed] [Google Scholar]
- Cuttle MF, Tsujimoto T, Forsythe ID, Takahashi T. Facilitation of the presynaptic calcium current at an auditory synapse in rat brainstem. J Physiol. 1998;512(Pt 3):723–729. doi: 10.1111/j.1469-7793.1998.723bd.x. [DOI] [PMC free article] [PubMed] [Google Scholar]
- Dodson PD, Billups B, Rusznak Z, Szucs G, Barker MC, Forsythe ID. Presynaptic rat Kv1.2 channels suppress synaptic terminal hyperexcitability following action potential invasion. J Physiol. 2003;550:27–33. doi: 10.1113/jphysiol.2003.046250. [DOI] [PMC free article] [PubMed] [Google Scholar]
- Elezgarai I, Diez J, Puente N, Azkue JJ, Benitez R, Bilbao A, Knopfel T, Donate-Oliver F, Grandes P. Subcellular localization of the voltage-dependent potassium channel Kv3.1b in postnatal and adult rat medial nucleus of the trapezoid body. Neuroscience. 2003;118:889–898. doi: 10.1016/s0306-4522(03)00068-x. [DOI] [PubMed] [Google Scholar]
- Elverland HH. Descending connections between superior olivary and cochlear nuclear complexes in the cat studied by autoradiographic and horseradish peroxidase methods. Exp Brain Res. 1977;27:397–312. doi: 10.1007/BF00235512. [DOI] [PubMed] [Google Scholar]
- Foran DR, Peterson AC. Myelin acquisition in the central nervous system of the mouse revealed by an MBP-Lac Z transgene. J Neurosci. 1992;12:4890–4897. doi: 10.1523/JNEUROSCI.12-12-04890.1992. [DOI] [PMC free article] [PubMed] [Google Scholar]
- Goldberg JM, Brown PB. Response of binaural neurons of dog superior olivary complex to dichotic tonal stimuli: some physiological mechanisms of sound localization. J Neurophysiol. 1969;32:613–636. doi: 10.1152/jn.1969.32.4.613. [DOI] [PubMed] [Google Scholar]
- Golding NL, Mickus TJ, Katz Y, Kath WL, Spruston N. Factors mediating powerful voltage attenuation along CA1 pyramidal neuron dendrites. J Physiol. 2005;568:69–82. doi: 10.1113/jphysiol.2005.086793. [DOI] [PMC free article] [PubMed] [Google Scholar]
- Guinan JJ, Norris BE, Guinan SS. Single auditory units in the superior olivary complex. II. Locations of unit categories and tonotopic organization. Int J Neuroscience. 1972;4:147–166. [Google Scholar]
- Harrison JM, Warr WB. A study of the cochlear nuclei and ascending auditory pathways of the medulla. J Comp Neurol. 1962;119:341–379. doi: 10.1002/cne.901190306. [DOI] [PubMed] [Google Scholar]
- Held H. Die centrale Gehörleitung. Archiv für Anatomie und Physiologie. Anat Abt. 1893;17:201–248. [Google Scholar]
- Hessler NA, Shirke AM, Malinow R. The probability of transmitter release at a mammalian central synapse. Nature. 1993;366:569–572. doi: 10.1038/366569a0. [DOI] [PubMed] [Google Scholar]
- Hines ML, Carnevale NT. NEURON: a tool for neuroscientists. Neuroscientist. 2001;7:123–135. doi: 10.1177/107385840100700207. [DOI] [PubMed] [Google Scholar]
- Hines ML, Carnevale NT. The NEURON Book. Cambridge University Press; 2006. [Google Scholar]
- Ishikawa T, Kaneko M, Shin HS, Takahashi T. Presynaptic N-type and P/Q-type Ca2+ channels mediating synaptic transmission at the calyx of Held of mice. J Physiol. 2005;568:199–209. doi: 10.1113/jphysiol.2005.089912. [DOI] [PMC free article] [PubMed] [Google Scholar]
- Ishikawa T, Nakamura Y, Saitoh N, Li WB, Iwasaki S, Takahashi T. Distinct roles of Kv1 and Kv3 potassium channels at the calyx of Held presynaptic terminal. J Neurosci. 2003;23:10445–10453. doi: 10.1523/JNEUROSCI.23-32-10445.2003. [DOI] [PMC free article] [PubMed] [Google Scholar]
- Iwasaki S, Takahashi T. Developmental regulation of transmitter release at the calyx of Held in rat auditory brainstem. J Physiol. 2001;534:861–871. doi: 10.1111/j.1469-7793.2001.00861.x. [DOI] [PMC free article] [PubMed] [Google Scholar]
- Joris PX, Carney LH, Smith PH, Yin TC. Enhancement of neural synchronization in the anteroventral cochlear nucleus. I. Responses to tones at the characteristic frequency. J Neurophysiol. 1994;71:1022–1036. doi: 10.1152/jn.1994.71.3.1022. [DOI] [PubMed] [Google Scholar]
- Kajikawa Y, Saitoh N, Takahashi T. GTP-binding protein beta gamma subunits mediate presynaptic calcium current inhibition by GABA(B) receptor. Proc Natl Acad Sci U S A. 2001;98:8054–8058. doi: 10.1073/pnas.141031298. [DOI] [PMC free article] [PubMed] [Google Scholar]
- Kandler K, Friauf E. Pre- and postnatal development of efferent connections of the cochlear nucleus in the rat. J Comp Neurol. 1993;328:161–184. doi: 10.1002/cne.903280202. [DOI] [PubMed] [Google Scholar]
- Khaliq ZM, Gouwens NW, Raman IM. The contribution of resurgent sodium current to high-frequency firing in Purkinje neurons: an experimental and modeling study. J Neurosci. 2003;23:4899–4912. doi: 10.1523/JNEUROSCI.23-12-04899.2003. [DOI] [PMC free article] [PubMed] [Google Scholar]
- Kim JH, Sizov I, Dobretsov M, von Gersdorff H. Presynaptic Ca2+ buffers control the strength of a fast post-tetanic hyperpolarization mediated by the alpha3 Na(+)/K(+)-ATPase. Nat Neurosci. 2007;10:196–205. doi: 10.1038/nn1839. [DOI] [PubMed] [Google Scholar]
- Kim MH, Korogod N, Schneggenburger R, Ho WK, Lee SH. Interplay between Na+/Ca2+ exchangers and mitochondria in Ca2+ clearance at the calyx of Held. J Neurosci. 2005;25:6057–6065. doi: 10.1523/JNEUROSCI.0454-05.2005. [DOI] [PMC free article] [PubMed] [Google Scholar]
- Korogod N, Lou X, Schneggenburger R. Presynaptic Ca2+ requirements and developmental regulation of posttetanic potentiation at the calyx of Held. J Neurosci. 2005;25:5127–5137. doi: 10.1523/JNEUROSCI.1295-05.2005. [DOI] [PMC free article] [PubMed] [Google Scholar]
- Kushmerick C, Renden R, von Gersdorff H. Physiological temperatures reduce the rate of vesicle pool depletion and short-term depression via an acceleration of vesicle recruitment. J Neurosci. 2006;26:1366–1377. doi: 10.1523/JNEUROSCI.3889-05.2006. [DOI] [PMC free article] [PubMed] [Google Scholar]
- Kuwabara N, DiCaprio RA, Zook JM. Afferents to the medial nucleus of the trapezoid body and their collateral projections. J Comp Neurol. 1991;314:684–706. doi: 10.1002/cne.903140405. [DOI] [PubMed] [Google Scholar]
- Leao RM, Kushmerick C, Pinaud R, Renden R, Li GL, Taschenberger H, Spirou G, Levinson SR, von Gersdorff H. Presynaptic Na+ channels: locus, development, and recovery from inactivation at a high-fidelity synapse. J Neurosci. 2005;25:3724–3738. doi: 10.1523/JNEUROSCI.3983-04.2005. [DOI] [PMC free article] [PubMed] [Google Scholar]
- Limb CJ, Ryugo DK. Development of primary axosomatic endings in the anteroventral cochlear nucleus of mice. J Assoc Res Otolaryngol. 2000;1:103–119. doi: 10.1007/s101620010032. [DOI] [PMC free article] [PubMed] [Google Scholar]
- Llinas R, Sugimori M, Simon SM. Transmission by presynaptic spike-like depolarization in the squid giant synapse. Proc Natl Acad Sci U S A. 1982;79:2415–2419. doi: 10.1073/pnas.79.7.2415. [DOI] [PMC free article] [PubMed] [Google Scholar]
- Lorente de No R. The Primary Acoustic Nuclei. New York: Raven Press; 1981. [Google Scholar]
- Manis PB. Biophysical Specializations of Neurons that Encode Timing. In: Bausbaum AI, Kaneko A, Shepherd GM, Westheimer G, editors. The Senses: A Comphrehensive Reference, Vol 3, Audition, (Dallos, P and Oertel, D., eds.) San Diego: Acadmeic Press; 2008. pp. 565–586. [Google Scholar]
- Morest DK. The growth of synaptic endings in the mammalian brain: a study of the calyces of the trapezoid body. Z Anat Entwicklungsgesch. 1968;127:201–220. doi: 10.1007/BF00526129. [DOI] [PubMed] [Google Scholar]
- Moulder KL, Mennerick S. Reluctant vesicles contribute to the total readily releasable pool in glutamatergic hippocampal neurons. J. Neurosci. 2005;25:3842–3850. doi: 10.1523/JNEUROSCI.5231-04.2005. [DOI] [PMC free article] [PubMed] [Google Scholar]
- Pfeiffer RR. Anteroventral cochlear nucleus: wave forms of extracellularly recorded spike potentials. Science. 1966;154:667–668. doi: 10.1126/science.154.3749.667. [DOI] [PubMed] [Google Scholar]
- Rall W. Cable theory for neurons. In: Eric R, et al., editors. Handbook of Physiology: The Nervous System. vol. 1. Baltimore: Williams & Wilkins; 1977. pp. 39–97. [Google Scholar]
- Redd EE, Pongstaporn T, Ryugo DK. The effects of congenital deafness on auditory nerve synapses and globular bushy cells in cats. Hear Res. 2000;147:160–174. doi: 10.1016/s0378-5955(00)00129-5. [DOI] [PubMed] [Google Scholar]
- Ristanovic D, Milosevic NT, Stulic V. Application of modified Sholl analysis to neuronal dendritic arborization of the cat spinal cord. J Neurosci Methods. 2006;158:212–218. doi: 10.1016/j.jneumeth.2006.05.030. [DOI] [PubMed] [Google Scholar]
- Rosenmund C, Clements JD, Westbrook GL. Nonuniform probability of glutamate release at a hippocampal synapse. Science. 1993;262:754–757. doi: 10.1126/science.7901909. [DOI] [PubMed] [Google Scholar]
- Rothman JS, Manis PB. Kinetic analyses of three distinct potassium conductances in ventral cochlear nucleus neurons. J Neurophysiol. 2003a;89:3083–3096. doi: 10.1152/jn.00126.2002. [DOI] [PubMed] [Google Scholar]
- Rothman JS, Manis PB. The roles potassium currents play in regulating the electrical activity of ventral cochlear nucleus neurons. J Neurophysiol. 2003b;89:3097–3113. doi: 10.1152/jn.00127.2002. [DOI] [PubMed] [Google Scholar]
- Rothman JS, Young ED, Manis PB. Convergence of auditory nerve fibers onto bushy cells in the ventral cochlear nucleus: implications of a computational model. J Neurophysiol. 1993;70:2562–2583. doi: 10.1152/jn.1993.70.6.2562. [DOI] [PubMed] [Google Scholar]
- Rowland KC, Irby NK, Spirou GA. Specialized synapse-associated structures within the calyx of Held. J Neurosci. 2000;20:9135–9144. doi: 10.1523/JNEUROSCI.20-24-09135.2000. [DOI] [PMC free article] [PubMed] [Google Scholar]
- Ryugo DK, Fekete DM. Morphology of primary axosomatic endings in the anteroventral cochlear nucleus of the cat: a study of the endbulbs of Held. J Comp Neurol. 1982;210:239–257. doi: 10.1002/cne.902100304. [DOI] [PubMed] [Google Scholar]
- Ryugo DK, Rosenbaum BT, Kim PJ, Niparko JK, Saada AA. Single unit recordings in the auditory nerve of congenitally deaf white cats: morphological correlates in the cochlea and cochlear nucleus. J Comp Neurol. 1998;397:532–548. doi: 10.1002/(sici)1096-9861(19980810)397:4<532::aid-cne6>3.0.co;2-2. [DOI] [PubMed] [Google Scholar]
- Sakaba T, Neher E. Quantitative relationship between transmitter release and calcium current at the calyx of held synapse. J Neurosci. 2001;21:462–476. doi: 10.1523/JNEUROSCI.21-02-00462.2001. [DOI] [PMC free article] [PubMed] [Google Scholar]
- Sakaba T, Schneggenburger R, Neher E. Estimation of quantal parameters at the calyx of Held synapse. Neurosci Res. 2002;44:343–356. doi: 10.1016/s0168-0102(02)00174-8. [DOI] [PubMed] [Google Scholar]
- Satzler K, Sohl LF, Bollmann JH, Borst JG, Frotscher M, Sakmann B, Lubke JH. Three-dimensional reconstruction of a calyx of Held and its postsynaptic principal neuron in the medial nucleus of the trapezoid body. J Neurosci. 2002;22:10567–10579. doi: 10.1523/JNEUROSCI.22-24-10567.2002. [DOI] [PMC free article] [PubMed] [Google Scholar]
- Schneggenburger R, Meyer AC, Neher E. Released fraction and total size of a pool of immediately available transmitter quanta at a calyx synapse. Neuron. 1999;23:399–409. doi: 10.1016/s0896-6273(00)80789-8. [DOI] [PubMed] [Google Scholar]
- Schneggenburger R, Neher E. Intracellular calcium dependence of transmitter release rates at a fast central synapse. Nature. 2000;406:889–893. doi: 10.1038/35022702. [DOI] [PubMed] [Google Scholar]
- Schneggenburger R, Neher E. Presynaptic calicum and control of vesicle fusion. Curr. Opin. Neurobiol. 2005;15:266–274. doi: 10.1016/j.conb.2005.05.006. [DOI] [PubMed] [Google Scholar]
- Sholl DA. Dendritic organization in the neurons of the visual and motor cortices of the cat. J Anat. 1953;87:387–406. [PMC free article] [PubMed] [Google Scholar]
- Smith PH, Joris PX, Carney LH, Yin TC. Projections fo physiologically characterized globular bushy cell axons from the cochlear nucleus of the cat. J Comp Neurol. 1991;304:387–407. doi: 10.1002/cne.903040305. [DOI] [PubMed] [Google Scholar]
- Yin TCT. Neural Mechanism of Encoding Binaural Localization Cues in the Auditory Brainstem. In: Oertel D, Fay RR, Popper AN, editors. Springer Handbook of Auditory Research. V15: Integrative Functions in the Mammalian Auditory Pathway. New York: Springer-Verlag; 2002. pp. 99–159. [Google Scholar]
- Spirou GA, Brownell WE, Zidanic M. Recordings from cat trapezoid body and HRP labeling of globular bushy cell axons. J Neurophysiol. 1990;63:1169–1190. doi: 10.1152/jn.1990.63.5.1169. [DOI] [PubMed] [Google Scholar]
- Stotler WA. An experimental study of the cells and connections of the superior olivary complex of the cat. J Comp Neurol. 1953;98:401–431. doi: 10.1002/cne.900980303. [DOI] [PubMed] [Google Scholar]
- Stuart G, Spruston N. Determinants of voltage attenuation in neocortical pyramidal neuron dendrites. J Neurosci. 1998;18:3501–3510. doi: 10.1523/JNEUROSCI.18-10-03501.1998. [DOI] [PMC free article] [PubMed] [Google Scholar]
- Taschenberger H, Leao RM, Rowland KC, Spirou GA, von Gersdorff H. Optimizing synaptic architecture and efficiency for high-frequency transmission. Neuron. 2002;36:1127–1143. doi: 10.1016/s0896-6273(02)01137-6. [DOI] [PubMed] [Google Scholar]
- Taschenberger H, von Gersdorff H. Fine-tuning an auditory synapse for speed and fidelity: developmental changes in presynaptic waveform, EPSC kinetics, and synaptic plasticity. J Neurosci. 2000;20:9162–9173. doi: 10.1523/JNEUROSCI.20-24-09162.2000. [DOI] [PMC free article] [PubMed] [Google Scholar]
- Trommershauser J, Schneggenburger R, Zippelius A, Neher E. Heterogeneous presynaptic release probabilities: functional relevance for short-term plasticity. Biophys J. 2003;84:1563–1579. doi: 10.1016/S0006-3495(03)74967-4. [DOI] [PMC free article] [PubMed] [Google Scholar]
- von Hehn CA, Bhattacharjee A, Kaczmarek LK. Loss of Kv3.1 tonotopicity and alterations in cAMP response element-binding protein signaling in central auditory neurons of hearing impaired mice. J Neurosci. 2004;24:1936–1940. doi: 10.1523/JNEUROSCI.4554-03.2004. [DOI] [PMC free article] [PubMed] [Google Scholar]
- Wang LY, Kaczmarek LK. High-frequency firing helps replenish the readily releasable pool of synaptic vesicles. Nature. 1998;394:384–388. doi: 10.1038/28645. [DOI] [PubMed] [Google Scholar]
- Warr WB. Fiber degeneration following lesions in the anterior ventral cochlear nucleus of the cat. Exp Neurol. 1966;14:453–474. doi: 10.1016/0014-4886(66)90130-0. [DOI] [PubMed] [Google Scholar]
- Warr WB. Fiber degeneration following lesions in the multipolar and globular cell areas in the ventral cochlear nucleus of the cat. Brain Res. 1972;40:247–270. doi: 10.1016/0006-8993(72)90132-1. [DOI] [PubMed] [Google Scholar]
- Wilson CJ. Passive cable properties of dendritic spines and spiny neurons. J Neurosci. 1984;4:281–297. doi: 10.1523/JNEUROSCI.04-01-00281.1984. [DOI] [PMC free article] [PubMed] [Google Scholar]
- Wolfel M, Lou X, Schneggenburger R. A mechanism intrinsic to the vesicle fusion machinery determines fast and slow transmitter release at a large CNS synapse. J Neurosci. 2007;27:3198–3210. doi: 10.1523/JNEUROSCI.4471-06.2007. [DOI] [PMC free article] [PubMed] [Google Scholar]
- Wu SH, Kelly JB. Response of neurons in the lateral superior olive and medial nucleus of the trapezoid body to repetitive stimulation: intracellular and extracellular recordings from mouse brain slice. Hear Res. 1993;68:189–201. doi: 10.1016/0378-5955(93)90123-i. [DOI] [PubMed] [Google Scholar]
- Wu XS, Sun JY, Evers AS, Crowder M, Wu LG. Isoflurane inhibits transmitter release and the presynaptic action potential. Anesthesiology. 2004;100:663–670. doi: 10.1097/00000542-200403000-00029. [DOI] [PubMed] [Google Scholar]
- Yang YM, Wang LY. Amplitude and kinetics of action potential-evoked Ca2+ current and its efficacy in triggering transmitter release at the developing calyx of held synapse. J Neurosci. 2006;26:5698–5708. doi: 10.1523/JNEUROSCI.4889-05.2006. [DOI] [PMC free article] [PubMed] [Google Scholar]