Abstract
Most human messenger RNAs (mRNAs) are alternatively spliced and many exhibit disease-specific splicing patterns. However, the contribution of most splicing events to the development and maintenance of human diseases remains unclear. As the contribution of alternative splicing events to diagnosis and prognosis is becoming increasingly recognized, it becomes important to develop precise methods to quantify the abundance of these isoforms in clinical samples. Here we present a pipeline for real-time PCR annotation of splicing events (RASE) that allows accurate identification of a large number of splicing isoforms in human tissues. The RASE automatically designed specific primer pairs for 81% of all alternative splicing events in the NCBI build 36 database. Experimentally, the majority of the RASE designed primers resulted in isoform-specific amplification suitable for quantification in human cell lines or in formalin-fixed, paraffin-embedded (FFPE) RNA extract. Using this pipeline it is now possible to rapidly identify splicing isoform signatures in different types of human tissues or to validate complete sets of data generated by microarray expression profiling and deep sequencing techniques.
Keywords: alternative splicing, mRNA detection, primer design, quantitative real-time PCR
INTRODUCTION
In eukaryotes, increased protein diversity is achieved by the alternative splicing of pre-mRNA whereby a single gene can generate several splicing isoforms coding for proteins with different functions (Fig. 1A). Nearly all multiexon human genes are believed to be alternatively spliced, and point mutations in splice sites are responsible for at least 15% of all annotated genetic disease-causing mutations (Venables 2006; Wang et al. 2008). Studies of alternatively spliced isoforms in vitro suggested that splicing modifies gene function and changes in splicing pattern have been linked to specific diseases (Venables 2006; Tazi et al. 2009). However, understanding the function and association of splicing isoforms with cellular phenotypes and pathology is limited by the logistics of detecting tissue or disease-specific splicing patterns (Nagao et al. 2005; Ni et al. 2007; Pan et al. 2008). We have recently demonstrated widespread alternative splicing changes in rare frozen tumor samples with high enough RNA quality for end-point PCR characterization (Klinck et al. 2008; Venables et al. 2008). However, due to degradation and sample preservation-induced chemical modifications (i.e., formalin-fixed, paraffin-embedded [FFPE] storage), there is a point at which the average length of intact extracted mRNAs becomes too short for this type of end-point analysis; most clinically defined samples are archived in FFPE blocks (Koch et al. 2006; Farragher et al. 2008; Oberli et al. 2008). In theory, real-time PCR could circumvent this problem, as amplicon length is not dependent on the size of the alternative exon.
FIGURE 1.
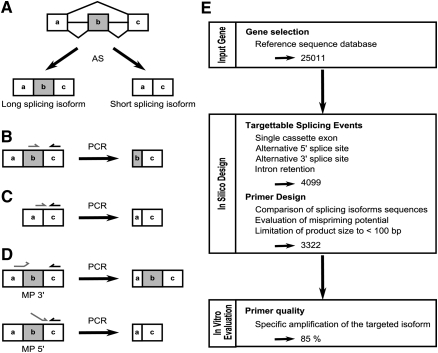
Problems associated with the detection of alternative splicing isoforms. (A) Alternative splicing of a single cassette exon (gray box) generates two isoforms differing by one exon. (B) Strategy for specific amplification of the long splicing isoform. The cDNA is amplified using primers specific to the alternative (gray arrow) and the constitutive (black arrow) exons. (C) Strategy for specific amplification of the short splicing isoform. The cDNA is amplified using a boundary-spanning primer (gray arrow) and an opposing primer hybridizing to a constitutive exon (black arrow). (D) Mispriming is often caused by lack of complementarities between the alternative exon and either the 3′ (MP 3′) or 5′ (MP 5′) ends of the BSP on the long splicing isoform. (E) Summary of the RASE pipeline. In this study genes were selected based on the evidence of alternative splicing (NCBI 36.2 database) and the nature of the splicing events.
Difficulties in producing high specificity splice-sensitive primers to quantify the expression of splicing isoforms using real-time PCR have severely limited the quality and feasibility of genome-wide data sets. The specificity of a PCR reaction depends on accurate identification of a sequence that can distinguish between different splicing isoforms. In real-time PCR reactions using the intercalating SYBR Green dye as an indicator for DNA amplification (Morrison et al. 1998) (a method favored because of its relatively low cost), the long splicing isoform is specifically amplified by using one primer in the alternative exon and an opposing primer in a constitutive exon (Fig. 1B). On the other hand, the amplification of the short splicing isoform is achieved by a boundary-spanning primer (BSP) (Yang and Le 1994) hybridizing to the sequence encompassing the exon–exon junction with the opposing primer in a constitutive exon (Fig. 1C). Theoretically, the BSP strategy should provide unbiased amplification of short splicing isoforms (Yang and Le 1994; Vandenbroucke et al. 2001). In practice, achieving isoform-specific amplification using the BSP strategy is challenging (Walton et al. 2007). Mispriming due to perfect matching between either the 5′ or 3′ end of the BSP to the long splicing isoform often results in erroneous amplification and thus reduces the fidelity of specific splicing isoform detection (Fig. 1D). This is particularly important if the amplicons generated by mispriming cannot be separated from the correctly primed product by gel electrophoresis (see Fig. 1C,D, MP 5′). So far, no general rule for the design of BSPs has been established (Williams et al. 1999; Bracco et al. 2006; Walton et al. 2007) and experimentally testing the fidelity of BSPs using interference tests (Vandenbroucke et al. 2001) (amplification from mixed templates containing a fixed amount of the long isoform with serially diluted amounts of the short isoform) or the Wellman method (Wellmann et al. 2001) (amplification of a fixed amount of long isoform template) is a costly and time-consuming process. Experimental validation of PCR primers is particularly unsuitable for high-throughput quantitative analysis since each primer set has to be tested and optimized individually.
In this study we defined the primer design rules necessary for the specific amplification of splicing isoforms and integrated them into a pipeline for real-time PCR annotation of splicing events (RASE). The RASE allows rapid and accurate quantification of a large number of splicing isoforms in both human cell lines and FFPE tissues. As summarized in Figure 1E, RASE successfully designed 3322 isoform-specific primer sets, representing 81% of simple alternative splicing events of the NCBI human genome database (build 36) (Pruitt et al. 2007). Our freely accessible web interface provides access to RASE and allows automatic definition of target splice sites and the identification of preoptimized primers that function under universal PCR conditions http://designs.lgfus.ca. The design process was validated experimentally using 51 alternative splicing events and 254 different primer sets.
RESULTS
Evaluation of essential BSP design parameters
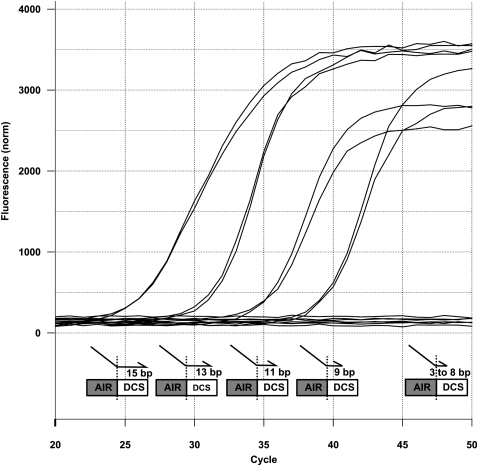
In order to determine the key design parameters that define successful splicing isoform discrimination, we first analyzed the BSP features contributing to mispriming due to its 3′ end complementary to both splicing isoforms. A training set of BSPs with systematically increasing 3′ end portions (3–15 nucleotides [nt]) perfectly matching both isoforms was designed and tested experimentally on four different alternative splicing events (Fig. 2; Supplemental Table 1). Briefly, the quantification of the mispriming potential of BSPs was done by looking at the capacity of a BSP to amplify a template containing the putative mispriming site (long isoform-specific splice site), compared with a second reaction with a perfectly matching primer set (long-specific primer pair [LSPP]) as a reference. Using this test, some BSPs showed amplification in the presence of the long splicing isoform template. However, these unspecific amplifications due to mispriming were detected very late (high Ct) when compared with values obtained with the long-specific primer pair. We hypothesized that this low amplification level might be induced by the unnaturally high amount of template included in these artificial reactions. Therefore, we conducted tests to further evaluate BSP specificities in typical real-time PCR experiments. The results indicated that BSPs resulting in a ΔCt > 16 can accurately discriminate between the different splicing isoforms (Supplemental Fig. 1). Using this strict cutoff limit, we found that 7–8 consecutive base pairs (Tm = 6°C) is the maximal number tolerated at the primer's 3′ end to keep mispriming to a minimum level (Supplemental Fig. 2). We generalized this rule design by testing a BSP validation set targeting 36 different short splicing isoforms carrying a 3′ end portion with a Tm lower than 6°C. All BSPs succeeded in giving specific amplification (Supplemental Table 2).
FIGURE 2.
Systematic tiling of BSPs across an exon–exon junction. BSPs harboring 15, 13, 11, and 9 bp complementarities to BCAS1 long splicing isoform in their 3′ end show amplification curves, while those with 8, 7, 5, and 3 bp or no template controls show no amplification. AIR and DCS stand for alternatively included region and downstream constitutive sequence, respectively.
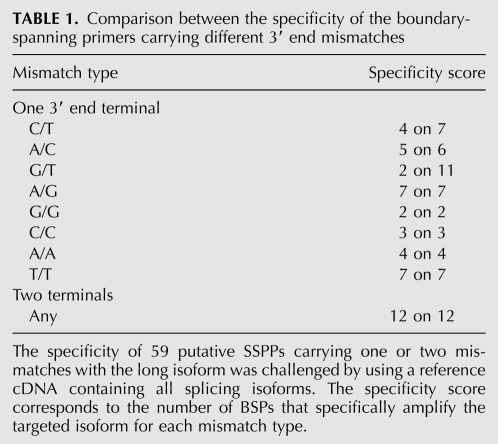
To determine the rule design that eliminates the mispriming due to a 5′ end perfect match on both splicing isoforms, we designed 59 different BSPs possessing a variety of mismatch combinations on 49 alternative splicing events (Table 1; Supplemental Table 3). BSPs were challenged in a real-time PCR reaction using a reference cDNA, representing virtually all splicing isoforms (universal human reference RNA [UHRR]), and were found specific if no detectable product fell in the range expected if mispriming on the long splicing isoform would occur. We found that a C/T, A/C, or G/T as a 3′ end terminal mismatch did not discriminate well the long and short splicing isoform. In contrast, G/G, A/A, T/T, C/C, and G/A as well as any two consecutive mismatches toward the long splicing isoform were highly specific for the short splicing isoform amplification (Table 1). Together, these experiments led to the conclusion that a BSP must carry no more than 7–8 nt fully complementary, and the inclusion of one terminal mismatch (G/G, A/A, T/T, C/C, or G/A), or whenever possible two, toward the long splicing isoform to be truly short isoform-specific.
TABLE 1.
Comparison between the specificity of the boundary-spanning primers carrying different 3′ end mismatches
Automated splice site identification and primer design
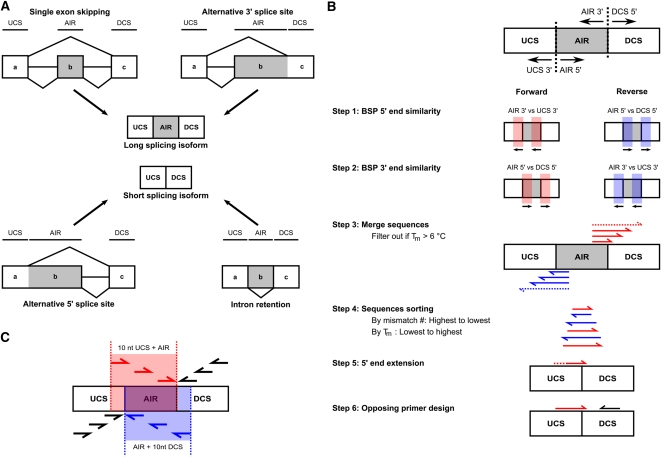
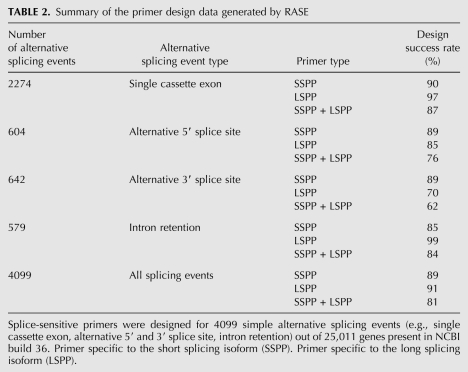
The first step to detect any splicing isoform is to identify the alternative splicing event and the unique sequence surrounding it. Therefore, we developed the RASE pipeline, which starts with a computational search tool that queries publicly available sequence databases for either individual or all alternative splicing events simultaneously and identifies the upstream constitutive sequence (UCS), the alternatively included region (AIR), and the downstream constitutive sequence (DCS; Fig. 3A). As shown in Figure 3B in steps 1 to 4, the algorithm described in the Materials and Methods section calculates the similarities of the sequences found around the alternative splicing event to retrieve all BSP 3′ end sequences possessing adequate length and mismatches toward the long splicing isoform. Then, the best sequence is extended in its 5′ end and an opposing primer is designed to generate an amplicon that ranges in length between 70 and 100 bp (Fig. 3B, steps 5 and 6). The long isoform-specific primer (LSP) is designed within the AIR (Fig. 3C). Out of 25,011 genes in the NCBI build 36 database, RASE generated specific pairs of primers for 4099 simple alternative splicing events, which corresponds to 81% of the events, regardless of the event type (i.e., single cassette exon, alternative 5′ and 3′ splice site, and intron retention; Table 2). Specifically in the case of single cassette exons, the most frequent type of event, the design success rate reached 87%. Conversely, in the case of alternative 3′ splice sites, the success rate was limited to 62%, the lowest level observed.
FIGURE 3.
Strategy for automated selection of high-fidelity splice-sensitive PCR primers. (A) The first stage involves the identification of the upstream constitutive sequence (UCS), alternatively included region (AIR), and downstream constitutive sequence (DCS) in all simple alternative splicing events types; single cassette exon, alternative 5′ and 3′ splice site, and intron retention. (B) The second stage generates primer sequences to quantify the short isoform of any given alternative splicing event. The schema in the upper right shows regions that are expanded on both sides of the junctions. Black arrows indicate the orientation of the nucleotide-by-nucleotide comparison used in steps 1 and 2. Step 1: The script identifies the stretch of matching nucleotides between short and long splicing isoforms and the 5′ end of the BSP in both orientations (BSP 5′ end similarity). Step 2: The script analyzes the sequences for the presence of mismatches in the terminal 3′ end toward the long splicing isoform. (BSP 3′ end similarity.) Step 3: Sequences identified in steps 1 and 2 are merged. Sequences with a Tm > 6°C are removed from the valid sequence list. Step 4: Sequences are sorted by mismatch number and by Tm. Step 5: An in silico 5′ end extension is performed on the best sequence until adequate nucleotide composition. Step 6: The script designs an opposing primer for the BSP yielding a short-specific primer pair (SSPP). (C) The third stage generates a primer sequence to quantify the long isoform of any given alternative splicing event. The extended space design for the long-specific primer is highlighted in red (forward) and blue (reverse).
TABLE 2.
Summary of the primer design data generated by RASE
Experimental validation of RASE primers
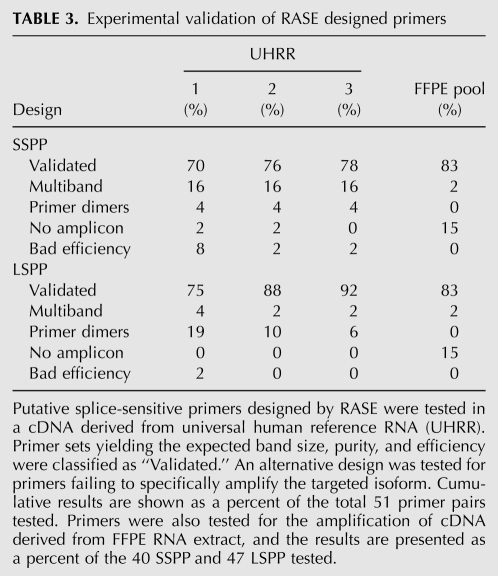
To evaluate the fidelity of the RASE we experimentally tested a set of primers targeting 51 cancer-specific alternative splicing events (Klinck et al. 2008; Venables et al. 2008). As much as three different primer designs for the long and short splicing isoforms of each gene were generated and examined (Table 3). The evaluation process consisted of a single test that looks at the primer capacity to amplify the targeted sequence in a cDNA from a reference RNA (UHRR). The primers were disqualified if they resulted in nonspecific amplifications, abnormal amplification curves, or the formation of primer-dimers when amplified in the presence of cDNA containing both splicing isoforms. Additionally, an efficiency curve was performed as described earlier (Nolan et al. 2006a). The results indicate that in an average of 85% of the cases, at least one of the three primer sets designed for each splicing isoform specifically amplified the targeted amplicon. Primers failed either due to dimerization or the amplification of unspecific sequences. Interestingly, only one primer set was completely inactive, and spiking a synthetic template in UHRR cDNA showed specific amplification of this inactive primer set. All together, it demonstrates that UHRR cDNA is representative of almost all splicing isoforms investigated so far. As low as three putative primer sets specific to the short splicing isoform misprimed on the long version, a BSP specificity success rate of 94%. All validated primer pairs were tested in a cDNA derived from a pool of RNA extracted from FFPE tissues. Most of the primer pairs tested specifically amplified the targeted splicing isoform. Therefore, we conclude that amplification of splicing isoforms is possible from both cell lines and FFPE tissues using the RASE.
TABLE 3.
Experimental validation of RASE designed primers
DISCUSSION
Quantitative real-time PCR, the current gold standard in mRNA quantification, has been only marginally used for the quantification of splicing isoforms. This is probably because the majority of software packages either cannot design splice-sensitive primers or design primers with low or unverified specificity (e.g., http://www.premierbiosoft.com, http://www.genscript.com/ssl-bin/app/primer, or http://www1.qiagen.com). Another important reason is that current packages do not take into account the high degree of similarity between the exon–exon junction sequences of differentially spliced mRNAs.
In this study, we circumvented these caveats by developing RASE, a pipeline that can directly identify and retrieve alternative splicing information from any public database and design primers that are specific to either the short or long splicing isoforms. To discriminate between two closely related sequences, we took advantage of Taq DNA polymerase requirements to prime PCR reactions: the overall duplex stability and the 3′ end pairing. Numerous independent researchers have addressed the minimal number of mismatches and positions required to specifically amplify unique splicing isoforms, but depending on the exact experimental setting used, different conclusions were reached (Ayyadevara et al. 2000). Here, we revisited this question by performing a comprehensive coverage on multiple primer/template combinations. Requiring one, and whenever possible two, terminal mismatches to the noncognate sequence and at most 8 nt of complementarity to the cognate sequence at the 3′ end were critical parameters since they allowed the largest coverage of designs in terms of the numbers of alternative splicing events, while retaining the high specificity required for real-time PCR splicing isoform quantification. This automatic primer design provides ready-to-use primers for the robust detection of splicing isoforms in days, something that previously took months to determine using classical methods that required cloning of each splicing isoform, experimental testing of individual primers, and manual adjustments of mismatch number and annealing temperature (Williams et al. 1999; Vandenbroucke et al. 2001; Walton et al. 2007). In addition, we have extended universal primer design capacity to the quantification of splicing isoform in formalin-fixed tissues. RNA extracted from FFPE blocks is of very poor quality, which put the reliability of quantification in FFPE tissues in question (Farragher et al. 2008). Numerous parameters affecting raw Ct values were identified and reported, and proper normalization and adequate amplicon size were shown to dramatically increase the quality of the data obtained from clinical samples (Abrahamsen et al. 2003; Cronin et al. 2004; Antonov et al. 2005). In this study, RASE designed 3322 primer sets with suitable amplicon size to quantify in fixed tissues, making it the first standardized primer design process capable of quantifying splicing isoforms in FFPE tissues. The difficulty in splice-sensitive primer design and validation also significantly impaired the quality of large data sets obtained from techniques such as “whole transcript” arrays (Castle et al. 2008) splicing arrays (Calarco et al. 2007), and deep sequencing (Pan et al. 2008). In all cases, few splicing isoforms were validated by a secondary approach, and an even lower number have been screened in large patient cohorts to confirm their disease association. Since RASE guarantees isoform specificity and provides preoptimized primers working under universal PCR conditions, it makes high-throughput annotation and validation of splicing isoforms feasible.
The goal of the present study was to build a pipeline for isoform-specific quantification in clinical samples using real-time PCR. To achieve this goal we built the RASE platform to eliminate tedious and time-consuming steps associated with primer validation and to streamline the amplification process. The key features of RASE include automated nucleotide-by-nucleotide genome-wide analysis of splicing isoforms and the evaluation of primers based on experimentally validated strict criteria allowing amplification under universal PCR conditions. The outcome of RASE is stored in the form of database of ready to use isoform-specific primer sequences for most alternative splicing events in the NCBI build 36 database (available upon request). In addition, custom primer design is also possible using a publicly available web interface. Using these tools it is now possible to design and conduct large-scale quantitative surveys of splicing isoforms in cell lines or archival samples, paving the way toward a greater understanding of the contribution of alternative splicing to complex human diseases such as cancer.
MATERIALS AND METHODS
Splicing isoform-specific primer design
An application programming interface (API) and executable computer-assisted scripts capable of designing isoform-specific primer pairs were developed using Perl version 5.8.8 (the Perl directory http://www.perl.org/) with CPAN modules (CPAN: Comprehensive Perl Archive Network, http://cpan.org/), and the gene annotation databases were stored using a MySQL database server http://www.mysql.com/. The design scripts can be called using a list of alternative splicing events described in a tab-delimited file. Batch design of the whole NCBI build 36 human annotation database (Pruitt et al. 2007) takes about 10 d on an average PC. Initially, transcripts associated with any given gene were retrieved from the database and the alternative splicing events (cassette exon, intron retention, alternative 3′ splice site, and alternative 5′ splice site) were identified using an algorithm similar to that used by ASTALAVISTA (Foissac and Sammeth 2007).
Prior to design SSPP, the script determines if a BSP orientation must be imposed based on the desired splicing event. To do so, it verifies if the 3′ end of the UCS or the 5′ end of the DCS undergoes alternative splicing in other transcripts. If only the 3′ end of the UCS does, the script imposes the BSP to be the forward primer. Conversely, the BSP has to be the reverse primer if only the 5′ end of the DCS undergoes alternative splicing. In the case where both undergo alternative splicing, the design is aborted. For the alternative splicing events where no orientation was imposed, the chosen one was based on the following rules. To determine 5′ end similarity, the script compared, on a nucleotide-by-nucleotide basis, the sequences found at the 3′ ends of the AIR and UCS, and the 5′ ends of the AIR and DCS. If the nucleotides were the same, iteration was performed on the next nucleotides of these regions until a difference was reached for each orientation. The number of identical nucleotides represents the 5′ end similarity of the BSP (Fig. 3B, step 1). Next, RASE analyzed the number and position of mismatches at the terminal 3′ end by an algorithm similar to the one used to determine the BSP 5′ end similarity. All sequences with two consecutive terminal mismatches or one strict terminal mismatch (A/A, T/T, C/C, G/G, or G/A) were kept (Fig. 3B, step 2). Then, the sequences were extended in their 5′ end using the BSP 5′ end similarity previously identified. The Tm of each sequence was calculated and all sequences with Tm greater than 6°C were rejected (Fig. 3B, step 3). The remaining sequences were sorted: (1) higher number of mismatches, and (2) lower Tm (Fig. 3B, step 4). Afterward, the scripts iterated through the sequence list and expended the sequence using the 3′ end of the UCS or the 5′ end of the DCS for forward or reverse BSP, respectively, until an adequate Tm of 58°C–62°C (optimal Tm = 60°C), a GC content between 30% and 80% (optimal 50%) and a maximal length of 30 nt (minimum 18 nt) were reached (Fig. 3B, step 5). Then, an opposing primer was designed using Primer3 (Rozen and Skaletsky 2000) with the default parameters except for the aforementioned Tm, GC content, primer length parameters, and the maximum Tm difference between primers was reduced to 3°C. The primer pair was scored for having no in silico off-targets; all possible amplification products with a size smaller than 500 bp were considered as possible in silico off-targets and were associated to the primer pair design when calling WUBLAST (http://blast.wustl.edu) or NCBI BLAST (Altschul et al. 1997) as a script parameter on an in-house transcript database based on the Aceview annotation (Thierry-Mieg and Thierry-Mieg 2006), for giving low primer pair penalties according to Primer3 and no mispriming when checked against the Primer3 human mispriming library (Fig. 3B, step 6).
The LSPP design is described in Figure 3C. To design LSP, an extended space design of 10 nt outside the AIR was allowed according to the LSP orientation. If the LSP was a forward, the space design consists of the AIR and the last 10 nt of the UCS, allowing it to be a BSP. Conversely, if the LSP was a reverse, the space design consists of the AIR and the first 10 nt of the DCS. The opposing primer was designed according to the rule described for the SSPP or aborted otherwise. All primer pairs successfully validated were analyzed for the presence of single nucleotide polymorphisms (see http://palace.lgfus.ca, Supplemental Table 4, and UCSC Genome Browser custom track for SNP verification). A low-throughput version (only one alternative splicing event can be designed at a time) of the script was also developed and is available for the scientific community via a web interface http://designs.lgfus.ca. Design scripts and API are also available through http://palace.lgfus.ca.
RNA extraction and quality control
DNase treatment on UHRR (Stratagene) was performed using RNase-free DNase set (Qiagen). Human normal and serous epithelial ovarian cancer tissues were obtained in 10 μm of FFPE shavings from the Réseau de Recherche sur le Cancer du Fonds de la Recherche en Santé du Québec biobank. Single-step total RNA extractions on human ovarian tissue were performed using RNeasy FFPE (Qiagen). The RNA was examined using Agilent 2100 bioanalyzer (Agilent technologies), and samples displaying a nucleic acid density ratio of 1.8 O.D.260/280 and an RNA integrity (RIN) value higher than 9 were used. Lower RIN values were accepted for RNA extracted from FFPE tissues. The presence of PCR inhibitors was evaluated using a SYBR Green version of the SPUD assay (Nolan et al. 2006b), and genomic DNA contamination was examined using exonic primers of PLD1 gene (5′-TCATTGACCAATCGGTGGCCTT-3′ and 5′-TGAAGTGACCCGCTTCACACT-3′) and intron-spanning primers of CCNE1 gene (5′-AAGTGGCGTTTAAGTCCCCTGA-3′ and 5′-ATGATACAAGGCCGAAGCAGCA-3′).
Quantitative PCR analysis
RNA reverse transcription was performed using 50–250 ng of RNA with “Transcriptor,” random primer p(dN)6, dNTPs (Roche Diagnostics), and RNase OUT (Invitrogen). Total cDNA generated from FFPE tissues was further purified on a QIAquick PCR purification kit (Qiagen). Total cDNA was pooled and diluted to 0.33–3.33 ng/μL. All forward and reverse primers were individually resuspended at 20–100 μM stock solution in Tris-EDTA buffer (IDT) and diluted as a primer pair to 1 μM in RNase DNase-free water (IDT). Ten microliters of real-time PCR reactions were performed either in a 7500 ABI apparatus (Applied Biosystems) or a Realplex (Eppendorf) with 5 μL of FastStart Universal SYBR Green Master mix (Roche Diagnostics) with the following cycling: 10 min at 95°C; 50 cycles: 15 sec at 95°C, 30 sec at 60°C, 30 sec at 72°C; and melting curve: 15 sec at 95°C, 60 sec at 60°C; 1°C/min temperature gradient, 15 sec at 95°C, using 3 μL (totaling 1–10 ng) of a template cDNA or diluted amplicons in tRNA (50 ng/mL; Ambion) and 2 μL of a 1 μM solution of forward and reverse primer.
The primer test was performed in technical triplicate using 1 ng or 10 ng of cDNA generated from RNA extracted from UHRR or from a 50/50 mixture of ovarian normal/cancerous FFPE tissues, respectively. The amplicons generated during the primer test were examined by capillary electrophoresis as previously described (Klinck et al. 2008) and stored for future use. In one case (CCL4), a chemically synthetic template of the sequence 5′-AAGCTCTGCGTGACTGTCCTGTCTCTCCTCATGCTAGTAGCTGCCTTCTGCTCTCCAGCGCTCTCAGCACCAAATTCCAAACCAAAAGAAGCAAGC-3′ was diluted and used as an amplicon derived from the primer test as described above. Efficiency curves were constructed across a four-log serial dilution protocol. A derived value of 2.00 represents an amplification efficiency of 100% and primer pairs with an efficiency between 90% and 105% (E = 1.90–2.05) were considered acceptable (Nolan et al. 2006a), although we considered SSPPs with E = 1.85-2.05. See http://palace.lgfus.ca and Supplemental Table 4 for all validated primer sets mentioned in Table 3.
For the design of the training set used to evaluate mispriming potential (MP 5′, Fig. 2), putative SSPPs were designed with BSPs having 3–15 nt in the 3′ end passes of the exon–exon junction and a fixed opposing primer. Primers to generate the template were designed as LSPP design with the additional constraints of having the LSP in the same orientation as the BSP. BSP opposing primers were designed to perform nested PCR using the long splicing isoform template. The amplification in UHRR cDNA was performed as described for the primer test. Amplicons were in the range of 100 bp to 300 bp, allowing evaluation of the quality of the amplification by amplicon sequencing using the Big dye chemistry on a ABI 3730xl apparatus. The mispriming potential was evaluated by performing real-time PCR reactions in technical duplicates using 3 μL of the 1:100,000,000 dilution of the template, 2 μL of primer set (LSPP as the reference primer pair and SSPP as the putative primer pair to be challenged) in 10 μL final volume as described for the primer test. No template controls were run in parallel and were negative. A ΔCt (where ΔCt = Ct SSPP – Ct LSPP) was calculated. See http://palace.lgfus.ca and Supplemental Table 1 for primer sequences.
For the evaluation of mispriming potential (MP 3′, Table 1), a BSP mismatch rule set was designed with BSPs fully matching the short splicing isoform and bearing one 3′ end terminal mismatch or two consecutive 3′ end terminal mismatches toward the long splicing isoform. Opposing primers were designed to yield amplicons in the range of 100 bp to 300 bp. Primers were tested as mentioned for the primer test. See http://palace.lgfus.ca and Supplemental Table 3 for primer sequences.
SUPPLEMENTAL MATERIAL
Supplemental material can be found at http://www.rnajournal.org.
ACKNOWLEDGMENTS
This work was supported by a grant from Génome Québec and Genome Canada. Sherif Abou Elela is a Chercheur National of the Fonds de la Recherche en Santé du Québec. Jean-Pierre Perreault holds the Canada Research Chair in Genomics and Catalytic RNA. We thank Bruno Lamontagne, Lucien Bergeron Jr., Julian P. Venables, Benoit Chabot, and Roscoe Klinck for reviewing this manuscript; as well as Sonia Couture for cell culture, Maxime Lévesque and Chu Shin Koh for implementation of the bioinformatics analysis module, Jules Gagnon for testing the script and web interface, Dany Namroud for server administration, and Marc-André Rodrigue for sequencing. S.A.E. and J.P.P. are members of the Centre de Recherche Clinique Étienne-Lebel.
Footnotes
Article published online ahead of print. Article and publication date are at http://www.rnajournal.org/cgi/doi/10.1261/rna.1877010.
REFERENCES
- Abrahamsen HN, Steiniche T, Nexo E, Hamilton-Dutoit SJ, Sorensen BS. Towards quantitative mRNA analysis in paraffin-embedded tissues using real-time reverse transcriptase-polymerase chain reaction: A methodological study on lymph nodes from melanoma patients. J Mol Diagn. 2003;5:34–41. doi: 10.1016/S1525-1578(10)60449-7. [DOI] [PMC free article] [PubMed] [Google Scholar]
- Altschul SF, Madden TL, Schaffer AA, Zhang J, Zhang Z, Miller W, Lipman DJ. Gapped BLAST and PSI-BLAST: A new generation of protein database search programs. Nucleic Acids Res. 1997;25:3389–3402. doi: 10.1093/nar/25.17.3389. [DOI] [PMC free article] [PubMed] [Google Scholar]
- Antonov J, Goldstein DR, Oberli A, Baltzer A, Pirotta M, Fleischmann A, Altermatt HJ, Jaggi R. Reliable gene expression measurements from degraded RNA by quantitative real-time PCR depend on short amplicons and a proper normalization. Lab Invest. 2005;85:1040–1050. doi: 10.1038/labinvest.3700303. [DOI] [PubMed] [Google Scholar]
- Ayyadevara S, Thaden JJ, Shmookler Reis RJ. Discrimination of primer 3′-nucleotide mismatch by Taq DNA polymerase during polymerase chain reaction. Anal Biochem. 2000;284:11–18. doi: 10.1006/abio.2000.4635. [DOI] [PubMed] [Google Scholar]
- Bracco L, Throo E, Cochet O, Einstein R, Maurier F. Methods and platforms for the quantification of splice variants' expression. Prog Mol Subcell Biol. 2006;44:1–25. doi: 10.1007/978-3-540-34449-0_1. [DOI] [PubMed] [Google Scholar]
- Calarco JA, Xing Y, Caceres M, Calarco JP, Xiao X, Pan Q, Lee C, Preuss TM, Blencowe BJ. Global analysis of alternative splicing differences between humans and chimpanzees. Genes & Dev. 2007;21:2963–2975. doi: 10.1101/gad.1606907. [DOI] [PMC free article] [PubMed] [Google Scholar]
- Castle JC, Zhang C, Shah JK, Kulkarni AV, Kalsotra A, Cooper TA, Johnson JM. Expression of 24,426 human alternative splicing events and predicted cis regulation in 48 tissues and cell lines. Nat Genet. 2008;40:1416–1425. doi: 10.1038/ng.264. [DOI] [PMC free article] [PubMed] [Google Scholar]
- Cronin M, Pho M, Dutta D, Stephans JC, Shak S, Kiefer MC, Esteban JM, Baker JB. Measurement of gene expression in archival paraffin-embedded tissues: Development and performance of a 92-gene reverse transcriptase-polymerase chain reaction assay. Am J Pathol. 2004;164:35–42. doi: 10.1016/S0002-9440(10)63093-3. [DOI] [PMC free article] [PubMed] [Google Scholar]
- Farragher SM, Tanney A, Kennedy RD, Paul Harkin D. RNA expression analysis from formalin fixed paraffin embedded tissues. Histochem Cell Biol. 2008;130:435–445. doi: 10.1007/s00418-008-0479-7. [DOI] [PubMed] [Google Scholar]
- Foissac S, Sammeth M. ASTALAVISTA: Dynamic and flexible analysis of alternative splicing events in custom gene datasets. Nucleic Acids Res. 2007;35:W297–W299. doi: 10.1093/nar/gkm311. [DOI] [PMC free article] [PubMed] [Google Scholar]
- Klinck R, Bramard A, Inkel L, Dufresne-Martin G, Gervais-Bird J, Madden R, Paquet ER, Koh C, Venables JP, Prinos P, et al. Multiple alternative splicing markers for ovarian cancer. Cancer Res. 2008;68:657–663. doi: 10.1158/0008-5472.CAN-07-2580. [DOI] [PubMed] [Google Scholar]
- Koch I, Slotta-Huspenina J, Hollweck R, Anastasov N, Hofler H, Quintanilla-Martinez L, Fend F. Real-time quantitative RT-PCR shows variable, assay-dependent sensitivity to formalin fixation: Implications for direct comparison of transcript levels in paraffin-embedded tissues. Diagn Mol Pathol. 2006;15:149–156. doi: 10.1097/01.pdm.0000213450.99655.54. [DOI] [PubMed] [Google Scholar]
- Morrison TB, Weis JJ, Wittwer CT. Quantification of low-copy transcripts by continuous SYBR Green I monitoring during amplification. Biotechniques. 1998;24:954–962. [PubMed] [Google Scholar]
- Nagao K, Togawa N, Fujii K, Uchikawa H, Kohno Y, Yamada M, Miyashita T. Detecting tissue-specific alternative splicing and disease-associated aberrant splicing of the PTCH gene with exon junction microarrays. Hum Mol Genet. 2005;14:3379–3388. doi: 10.1093/hmg/ddi369. [DOI] [PubMed] [Google Scholar]
- Ni JZ, Grate L, Donohue JP, Preston C, Nobida N, O'Brien G, Shiue L, Clark TA, Blume JE, Ares M., Jr Ultraconserved elements are associated with homeostatic control of splicing regulators by alternative splicing and nonsense-mediated decay. Genes & Dev. 2007;21:708–718. doi: 10.1101/gad.1525507. [DOI] [PMC free article] [PubMed] [Google Scholar]
- Nolan T, Hands RE, Bustin SA. Quantification of mRNA using real-time RT-PCR. Nat Protoc. 2006a;1:1559–1582. doi: 10.1038/nprot.2006.236. [DOI] [PubMed] [Google Scholar]
- Nolan T, Hands RE, Ogunkolade W, Bustin SA. SPUD: A quantitative PCR assay for the detection of inhibitors in nucleic acid preparations. Anal Biochem. 2006b;351:308–310. doi: 10.1016/j.ab.2006.01.051. [DOI] [PubMed] [Google Scholar]
- Oberli A, Popovici V, Delorenzi M, Baltzer A, Antonov J, Matthey S, Aebi S, Altermatt HJ, Jaggi R. Expression profiling with RNA from formalin-fixed, paraffin-embedded material. BMC Med Genomics. 2008;1:9. doi: 10.1186/1755-8794-1-9. [DOI] [PMC free article] [PubMed] [Google Scholar]
- Pan Q, Shai O, Lee LJ, Frey BJ, Blencowe BJ. Deep surveying of alternative splicing complexity in the human transcriptome by high-throughput sequencing. Nat Genet. 2008;40:1413–1415. doi: 10.1038/ng.259. [DOI] [PubMed] [Google Scholar]
- Pruitt KD, Tatusova T, Maglott DR. NCBI reference sequences (RefSeq): A curated non-redundant sequence database of genomes, transcripts and proteins. Nucleic Acids Res. 2007;35:D61–D65. doi: 10.1093/nar/gkl842. [DOI] [PMC free article] [PubMed] [Google Scholar]
- Rozen S, Skaletsky H. Primer3 on the WWW for general users and for biologist programmers. Methods Mol Biol. 2000;132:365–386. doi: 10.1385/1-59259-192-2:365. [DOI] [PubMed] [Google Scholar]
- Tazi J, Bakkour N, Stamm S. Alternative splicing and disease. Biochim Biophys Acta. 2009;1792:14–26. doi: 10.1016/j.bbadis.2008.09.017. [DOI] [PMC free article] [PubMed] [Google Scholar]
- Thierry-Mieg D, Thierry-Mieg J. AceView: A comprehensive cDNA-supported gene and transcripts annotation. Genome Biol. 2006;7(Suppl 1):S12.1–14. doi: 10.1186/gb-2006-7-s1-s12. [DOI] [PMC free article] [PubMed] [Google Scholar]
- Vandenbroucke II, Vandesompele J, Paepe AD, Messiaen L. Quantification of splice variants using real-time PCR. Nucleic Acids Res. 2001;29:E68–8. doi: 10.1093/nar/29.13.e68. [DOI] [PMC free article] [PubMed] [Google Scholar]
- Venables JP. Alternative splicing in cancer. Transworld Research Network; Kerala, India: 2006. [Google Scholar]
- Venables JP, Klinck R, Bramard A, Inkel L, Dufresne-Martin G, Koh C, Gervais-Bird J, Lapointe E, Froehlich U, Durand M, et al. Identification of alternative splicing markers for breast cancer. Cancer Res. 2008;68:9525–9531. doi: 10.1158/0008-5472.CAN-08-1769. [DOI] [PubMed] [Google Scholar]
- Walton HS, Gebhardt FM, Innes DJ, Dodd PR. Analysis of multiple exon-skipping mRNA splice variants using SYBR Green real-time RT-PCR. J Neurosci Methods. 2007;160:294–301. doi: 10.1016/j.jneumeth.2006.09.022. [DOI] [PubMed] [Google Scholar]
- Wang ET, Sandberg R, Luo S, Khrebtukova I, Zhang L, Mayr C, Kingsmore SF, Schroth GP, Burge CB. Alternative isoform regulation in human tissue transcriptomes. Nature. 2008;456:470–476. doi: 10.1038/nature07509. [DOI] [PMC free article] [PubMed] [Google Scholar]
- Wellmann S, Taube T, Paal K, Graf V, Einsiedel H, Geilen W, Seifert G, Eckert C, Henze G, Seeger K. Specific reverse transcription-PCR quantification of vascular endothelial growth factor (VEGF) splice variants by LightCycler technology. Clin Chem. 2001;47:654–660. [PubMed] [Google Scholar]
- Williams DM, Koduri S, Li Z, Hankins WD, Poola I. Primer design strategies for the targeted amplification of alternatively spliced molecules. Anal Biochem. 1999;271:194–197. doi: 10.1006/abio.1999.4154. [DOI] [PubMed] [Google Scholar]
- Yang D, Le J. Targeted amplification of alternatively spliced transcripts of major histocompatibility complex class I heavy chain. J Immunol Methods. 1994;176:265–270. doi: 10.1016/0022-1759(94)90320-4. [DOI] [PubMed] [Google Scholar]


