Abstract
In recent years the improvements in high-throughput gene expression analysis have led to the discovery of numerous non-protein-coding RNA (npcRNA) molecules. They form an abundant class of untranslated RNAs that have shown to play a crucial role in different biochemical pathways in the cell. Reverse transcription quantitative real-time polymerase chain reaction (RT-qPCR) is an efficient tool to measure RNA abundance and gene expression levels in tiny amounts of material. Despite its sensitivity, the lack of appropriate internal controls necessary for accurate data analysis is a limiting factor for its application in npcRNA research. Common internal controls applied are protein-coding reference genes, also termed “housekeeping” genes (HKGs). However, their expression levels reportedly vary among tissues and different experimental conditions. Moreover, application of HKGs as reference in npcRNA expression analyses is questionable, due to the differences in biogenesis. To address the issue of optimal RT-qPCR normalizers in npcRNA analysis, we performed a systematic evaluation of 18 npcRNAs along with four common HKGs in 20 different human tissues. To determine the most suitable internal control with least expression variance, four evaluation strategies, geNORM, NormFinder, BestKeeper, and the comparative delta Cq method, were applied. Our data strongly suggest that five npcRNAs, which we term housekeeping RNAs (HKRs), exhibit significantly better constitutive expression levels in 20 different human tissues than common HKGs. Determined HKRs are ideal candidates for RT-qPCR data normalization in human transcriptome analysis, and might also be used as reference genes irrespective of the nature of the genes under investigation.
Keywords: RT-qPCR, housekeeping genes, housekeeping RNAs, noncoding RNAs, non-protein-coding RNAs
INTRODUCTION
In recent years, various reports on the analysis of the human genome and transcriptome showed that only less than 2% of the genome is coding for proteins, yet the vast majority (∼65%) of the genome is being transcribed, resulting in large amounts of untranslated RNA with mostly unknown origin and function or no function (Kapranov et al. 2002; Brosius 2005; Taft et al. 2007). It has been shown repeatedly that there are many more RNAs with a regulatory function other than the well-known ribosomal, messenger, and transfer RNA (rRNA, mRNA, tRNA), which are commonly termed as noncoding RNAs (ncRNAs) or more precisely non-protein-coding RNAs (npcRNAs) (Brosius and Tiedge 2004; Matera et al. 2007). Recent evidence also showed that most of the complex genetic phenomena in higher organisms, such as gene silencing, imprinting, splicing, and RNA post-transcriptional modifications are connected to RNA signaling and, hence, the involvement of different classes of npcRNAs is rather the rule than the exception (Mattick 2004). Though roughly categorized into small nuclear RNAs (snRNAs), small nucleolar RNAs (snoRNAs), small cajal body-specific RNAs, microRNAs, guide RNAs, antisense RNAs, siRNA, and piRNA (Szymanski and Barciszewski 2002; Mattick 2005; Chu and Rana 2007), there are many other types of npcRNAs discovered. Most of these are either predicted by computational methods (Washietl et al. 2005a,b), or found by large-scale transcriptome analysis on genome-wide microarrays (Pheasant and Mattick 2007), or by sequencing of cDNA libraries (Huttenhofer et al. 2001; Tang et al. 2002; Huttenhofer and Vogel 2006) and demand thorough experimental evaluation.
Microarrays and reverse transcription quantitative real-time polymerase chain reaction (RT-qPCR) analyses are commonly used approaches to measure transcript abundance with the advantage of speed, throughput, and a high degree of potential automation compared to conventional quantification methods such as Northern blot analysis, RNase protection assays, or competitive reverse-transcriptase PCR. Microarrays allow the parallel analysis of thousands of genes in two differentially labeled RNA populations, while RT-qPCR provides the simultaneous measurement of gene expression in many different samples for a limited number of genes and is especially suitable when only small amounts of sample is available (Bustin 2002; Huggett et al. 2005; Nolan et al. 2006).
RT-qPCR is an efficient tool to measure absolute transcript abundance and provides valuable quantitative information on gene expression of different samples from different sources (Peters et al. 2004; Huggett et al. 2005; Jiang et al. 2005; Nolan et al. 2006). Considering the experimental variations in the form of starting material, RNA extraction, and efficiency of first-strand cDNA synthesis, a set of precise internal controls to measure and reduce the error between different runs and samples is needed (Tichopad et al. 2003; Peters et al. 2004; Tichopad et al. 2004). Reference genes or “housekeeping” genes (HKGs) are commonly used to normalize mRNA levels of the genes of interest before comparison between different samples in RT-qPCR. Selecting appropriate reference genes for normalization is essential to accurately interpret the RT-qPCR results. By current definition, reference genes are mainly protein-coding genes, which are expressed in a wide variety of tissues or cell types and show no or only minimum variation in expression levels between individual samples and the experimental conditions used (Suzuki et al. 2000; Radonic et al. 2004). In reality, however, such reference genes do not exist.
Applying a number of different methods, numerous attempts have been made to select appropriate constitutively expressed reference genes in the past. A survey of more than 40 studies revealed that in 70% of publications GAPDH, ACTB, B2M, HPRT1, and 18S rRNA were used in data analysis, and in over 90% of the studies, only a single reference gene was used for the normalization of RT-qPCR data (Schmittgen and Zakrajsek 2000; Tricarico et al. 2002). However, the expression levels of many of these reference genes have been reported to vary considerably in multiple tissues and cells (Suzuki et al. 2000). Moreover, the biogenesis of small npcRNAs is different from that of protein-coding genes (Filipowicz and Pogacic 2002), and hence, usage of HKGs for normalization of expression levels between samples could potentially result in erroneous conclusions.
To date, different evaluation strategies are available for determining the most suitable internal control showing least expression variance between test samples. All methods aim at defining the most “stable” gene(s) from a test set of genes, wherein “expression stability” is referred to as the least variation of constitutive expression levels in the group of samples analyzed. For instance, geNORM, a Microsoft Excel VBA-applet developed by Vandesompele and colleagues (2002), suggests the use of the geometric mean of more than one reference gene for normalization. Usage of multiple reference genes will reduce the variations, thereby reducing the errors in final expression analysis. BestKeeper, another Microsoft Excel-based tool, determines the optimal normalizer using pairwise correlation analysis of all pairs of reference candidates and calculates the geometric mean of the best-suited pair (Pfaffl et al. 2004). The NormFinder algorithm uses a model-based approach, taking into account variations across subgroups and avoiding artificial selection of coregulated genes (Andersen et al. 2004).
In the present study, we have examined the expression levels of 18 small npcRNAs along with four most commonly used HKGs in 20 different human tissues. According to our evaluation using multiple stability analysis methods, several of the npcRNA genes, which we term house keeping RNAs (HKRs), serve as better internal controls than the commonly used HKGs. Furthermore, geNORM and BestKeeper analyses suggest that the usage of a set of HKRs for normalization of expression analysis data of npcRNA genes gives more accurate data than using a set of HKGs or using a single HKG or HKR for normalization.
RESULTS
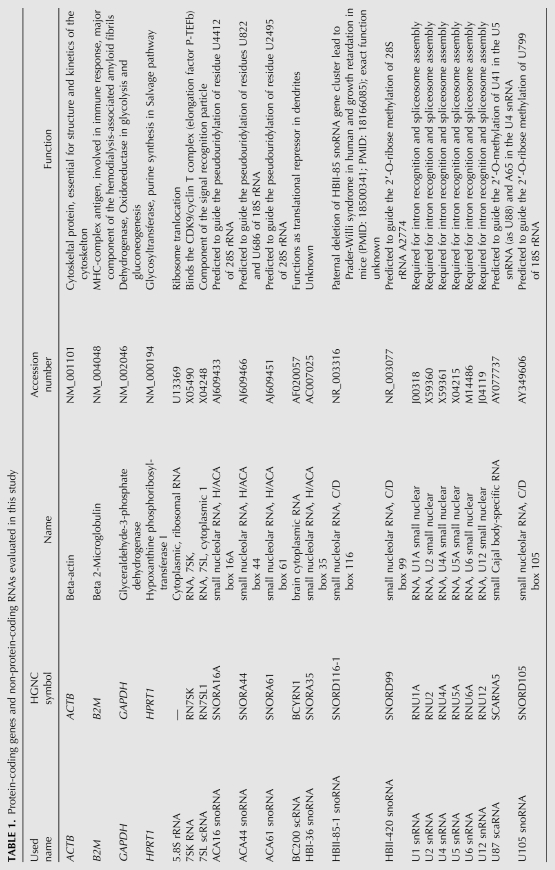
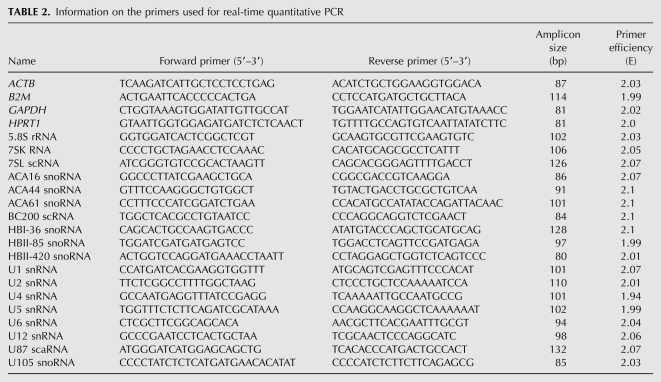
The major goal of our study was to determine a set of stable internal controls for the expression analysis of human npcRNA transcriptome by RT-qPCR. Based on previous reports, we have chosen to evaluate the expression pattern of the four most commonly used HKGs (GAPDH, B2M, ACTB, HPRT1) for normalization in RT-qPCR expression studies (Suzuki et al. 2000). In addition, we have chosen 18 npcRNA genes for expression analysis in 20 different human tissues. The npcRNAs were selected from different structural and functional classes to avoid coregulatory effect in the expression analysis. Hence, small nucleolar RNAs (HBII-85, HBII-420, U105 C/D Box snoRNAs, and ACA-16, ACA-44, ACA-61, HBI-36 H/ACA box snoRNAs), small cajal body-specific RNA (U87 scaRNA), small nuclear RNAs (U1, U2, U4, U5, U6, and U12 snRNAs), BC200 RNA, 7SK RNA, 7SL RNA, and 5,8S ribosomal RNA were chosen. Among these, npcRNA candidates with pronounced tissue-specific expression (HBI-36, BC200 RNA, and HBII-85) were selected as spiked controls in the test set. In the following, HKGs and npcRNA gene candidates together are referred to as “reference candidates.” The nomenclature of reference candidates is according to the snoRNA database (www.snorna.biotoul.fr) (Lestrade and Weber 2006) and HGNC (http://www.genenames.org/). Details of the reference candidates and the applied primers throughout the analyses are provided in Tables 1 and 2. Primers were designed using the corresponding reference sequences deposited at GenBank.
TABLE 1.
Protein-coding genes and non-protein-coding RNAs evaluated in this study
TABLE 2.
Information on the primers used for real-time quantitative PCR
RNA quality determination
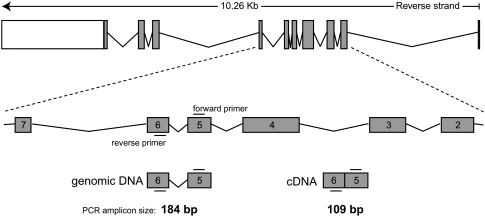
Small npcRNAs are short in size (∼20–500 nucleotides [nt]) and often found to be intronless (some tRNA genes are exceptions). Hence, apart from high quality, the total RNA samples should be devoid of genomic DNA. All the total RNA samples obtained were analyzed by BioAnalyser 2100 and were stored in RNA storage solution. First, we examined the obtained total RNA from 20 different human tissues for their purity and concentration by measuring the absorbance ratio at 260/280 nm. All total RNA samples were shown to be free of protein contamination with values between 1.92 and 1.98. Furthermore, we monitored the total RNA and the cDNA samples for the presence of residual genomic DNA by PCR using a special primer set located in neighboring exons 5 and 6 of the HNRNPA2B1 gene. In cDNA preparations free of DNA contamination, the expected PCR product is a single amplicon of 109 bp in size (without intron). However, in the presence of genomic DNA, an additional PCR product of 184 bp in size is obtained through amplification of the intronic sequence (Fig. 1). Notably, all our obtained total RNA samples were free from genomic DNA contamination as no PCR amplicon was obtained (data not shown).
FIGURE 1.
Primer design strategy for PCR-based detection of DNA contamination in total RNA samples. The possible presence of DNA contamination is analyzed by PCR using special primers for the HNRNPA2B1 gene. The forward and reverse primers are located in two different neighboring exons amplifying a 109-bp fragment from cDNA. In the presence of genomic DNA, it gives rise to an additional amplicon of 184 bp in size due to the additional intron.
Primer screening and PCR efficiency analysis
The primer sequences for protein-coding reference genes were reported previously (Zhang et al. 2005; Greber et al. 2007), except for HPRT1. All primer sets for npcRNAs were chosen according to general rules of qPCR primer design. They are between 18 and 27nt in length and the expected amplicon sizes are in the range of 80–130 base pairs (bp) (Table 2). First, all primers were examined by end-point PCR using human brain cDNA as a template. All chosen candidates were expressed, and specific amplification was confirmed by a single band of appropriate size in agarose gel electrophoresis. Furthermore, the identities of all PCR products were further confirmed by TOPO T/A cloning and subsequent sequencing (data not shown).
In a second step, the amplification efficiency for each primer pair was determined in a RT-qPCR assay using triplicates of a 10-fold dilution series of human brain cDNA (20–0.02 ng) as a template. Primer efficiency indicates the amplicon doubling rate of a primer pair during the amplification reaction. The “Cq value” is defined as the number of cycles needed for the fluorescence signal to reach a specific threshold level of detection and correlates inversely with the amount of nucleic acid template present in the reaction (Walker 2002). Obtained Cq values of the dilution series were plotted and the resulting slope value was used for calculation of RT-qPCR primer efficiency (E) according to the equation: E = (10[−1/slope]).
All PCR primer pairs showed correlation coefficients of R2 > 0.97 (the nearer to 1.0 the better) and primer efficiency values E ranging between 1.94 and 2.07 (Table 2). The dissociation plots (melting-curve analysis) provided by the ABI Prism 7900HT sequence detection system indicated a single peak for all primer pairs, further confirming specificity. The primer efficiencies were used to transform the raw Cq values to quantities by comparative Cq method for subsequent geNORM and NormFinder analyses, whereas BestKeeper uses the raw Cq values and primer efficiency values directly in the analysis.
Relative expression of reference genes
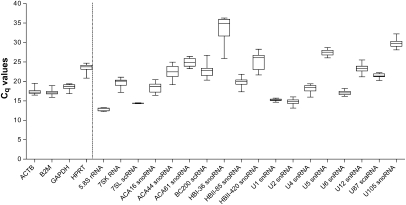
RT-qPCR was used to assess transcription levels for reported HKGs and chosen npcRNA genes. To evaluate the expression levels of all reference candidates across 20 different human tissues, all obtained Cq values for each gene were comparably analyzed (Fig. 2). All reference candidates included in this study covered a wide range of expression levels in tested human tissues (mean Cq values ranging from 12 to 36). Obtained Cq range is equivalent to eight orders of magnitude difference in nucleic acid abundance in the samples. The expression levels for individual candidates were also showing a wide range of expression variability within the different tissues of the panel. Standard deviation of the Cq values range between 0.06 (7SL scRNA) and 3.11 (HBI-36 H/ACA-box snoRNA). Repetition of RT-qPCR for some of the reference candidates indicated no significant batch-to-batch variation for different cDNA preparations from the same total RNA, or even from different total RNA samples. Notably, different preparations of total RNA from different human tissues might lead to diverse expression profiles of genes that are transcribed in a cell-type specific manner. In other words, brain cortex cannot contain the repertoire of RNA as brain stem, amygdala, cerebellum, etc. This also can be the case from other tissues, not to mention changes in expression patterns due to differences in age or environmental factors, including disease.
FIGURE 2.
Real-time quantitative PCR cycle threshold (Cq) values for 22 reference candidates in 20 human tissue RNA samples. The median Cq values are shown as lines, 25 to 75 Cq percentile as Boxes and the range of Cq values from 20 cDNA samples as whiskers. The dotted line separates protein-coding genes (left) from RNA-coding genes (right).
Relative expression stability evaluation
The data obtained for each reference candidate in 20 different human tissues were analyzed for their relative expression stabilities. Based on Cq values obtained for 22 reference candidates, seven were excluded from further analysis due to high standard deviation (Cq-range). Candidates with a standard deviation (SD) above that of any of the four HKGs (SD > 1.07) were excluded from further analysis. Thus, all npcRNAs exhibiting pronounced tissue-specific expression (HBII-36, BC200, HBII-85), or showing high expression variations in analyzed tissues (HBII-420, ACA-16, ACA-44, and ACA-61) were removed.
The 15 remaining reference candidates were analyzed for their “relative expression stability” in 20 different human tissues using four different normalization methods: geNORM (Vandesompele et al. 2002), NormFinder (Andersen et al. 2004), BestKeeper (Pfaffl et al. 2004), and the Comparative Delta Cq (ΔCq) method (Silver et al. 2006). geNORM and NormFinder use relative quantity values as input data, whereas BestKeeper and comparative ΔCq methods use raw Cq values along with primer efficiency and standard deviation values, respectively.
geNORM expression stability analysis
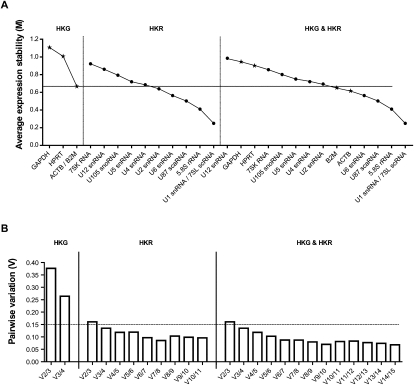
The gene expression stability analysis of the transformed data by geNORM determines the average pairwise variation of an individually chosen candidate with all other reference candidates and ranks them based on average expression stability value (M) from most stable to least stable (Vandesompele et al. 2002). To select the best reference candidates for the final analysis, we have evaluated protein-coding HKGs and npcRNA genes separately and together by geNORM, and examined the average expression stability values among all three groups (Fig. 3A).
FIGURE 3.
Gene expression stability analysis of most stable housekeeping genes (HKGs) and housekeeping RNAs (HKRs) using geNORM. (A) Average expression stability values (M) of 15 most stable reference candidates after stepwise exclusion of the least stable reference candidate. M-values are represented for separate analysis of four HKGs (left, A) and 11 HKRs (center, B), as well as together (right, C). The horizontal line represents the lowest expression stability value for the most stable HKG (0.66). HKGs are represented as stars, HKRs are represented as circles. (B) Pairwise variation analysis showing optimal number of reference candidates for normalization for HKGs and HKRs, separately and together (from left to right, respectively). Pairwise variation value beneath 0.15 (horizontal line) with the least number of reference candidates used is considered as optimal.
Among the four selected HKGs, ACTB showed the highest stability value, followed by B2M, HPRT1, and GAPDH. (Fig. 3A, left panel).
For the 11 tested npcRNA reference candidates, HKRs, the order of expression stability was as follows: 7SL scRNA /U1 snRNA > 5.8S rRNA > U87 scaRNA > U6 snRNA > U2 snRNA > U4 snRNA > U5 snRNA > U-105 snoRNA > U12 snRNA > 7SK RNA (Fig. 3A, middle panel).
When HKGs and HKRs were analyzed together, five HKR candidates (7SL scRNA/U1 snRNA > 5.8S rRNA > U87 scaRNA > U6 snRNA) were found to be the most constitutively expressed candidates whereby two HKGs were following the obtained order (ACTB and B2M) as most stable protein-coding HKGs (Fig. 3A, right panel). The expression stability of GAPDH and HPRT1 genes, the most common HKGs reported in many studies, appeared to be the most variable amongst selected candidates.
Additionally, geNORM also calculates the pairwise variation (V) among the reference candidates and provides an estimate of the optimum number of reference candidates to be used (Fig. 3B). This value is obtained by the analysis of the changes in the normalization factors by adding successively the most stable reference candidate from the set. geNORM suggests that an accurate normalization factor of RT-qPCR data can be calculated by using a minimum of three most stably expressed genes and V-value < 0.15 is considered as optimal. A higher V-value after the inclusion of a candidate to the analysis indicates a negative effect on the normalizing factor and, hence, can be excluded from the set. However, if the addition of a reference candidate results in a significantly lower V-value, it should be considered in the normalization. When we analyzed all the reference candidates, the observed changes were rather uniform with a possible optimum point (V < 0.15) reached with the addition of a fourth reference candidate (U87 scaRNA). However, the addition of a fifth candidate (U6 snRNA) significantly reduced the V-value further and should also be considered for normalization. Therefore the calculation of normalization factor enabled us to find the optimal number of reference candidates that should be used for qPCR data normalization. The final set of most stable reference candidates after pairwise variation analysis is as follows: 7SL scRNA, U1 snRNA, 5.8S rRNA, U87 scaRNA, and U6 snRNA.
NormFinder expression stability analysis
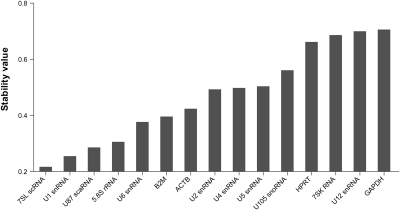
NormFinder analysis is another RT-qPCR data normalization tool that ranks the expression values of each of the chosen reference candidate (Andersen et al. 2004). In contrast to geNORM, NormFinder examines the expression stability of each single candidate independently from each other. This is very important in the light of our limited knowledge regarding the coregulation of candidates in a given test set and experimental design. The results of the NormFinder analysis applied in our study are given in Figure 4. Compared to geNORM, 7SL scRNA and U1 snRNA genes still occupy the top positions. However, the ranking order of 5.8 rRNA and U87 scaRNA is reversed. Protein-coding HKGs B2M and ACTB exhibited more variable expression compared to U6 snRNA. Further, U2 snRNA, U4 snRNA, and U5 snRNA genes showed intermediate stability values and occupy later positions. Similar to geNORM, NormFinder analysis identified U105 snoRNA, HPRT1, 7SK RNA, U12 snRNA, and GAPDH as most variable reference candidates and ranked them last among the 15 tested genes (Fig. 4).
FIGURE 4.
Gene expression stability analysis of reference candidates using NormFinder. The lower the variance in the stability value, the more stable a gene is within the set of samples analyzed. In contrast to geNORM, NormFinder analyses the stability of candidate gene expression in a set of samples individually, not in a pairwise manner.
Comparative ΔCq method for expression stability analysis
The Comparative ΔCq method evaluates relative expression of “pairs of genes” within each tissue sample to identify the most stable reference candidates (Silver et al. 2006). This method keeps the level of mathematical methodology to a minimum, without compromising accuracy, in order to allow nonspecialist personnel to discover stable candidates. If ΔCq between two candidates remains constant in different samples, this indicates that either both candidates are constitutively expressed, or they are coregulated. In contrast, when the ΔCq value fluctuates, then one or both candidates are variably expressed. Contribution of more, i.e., the 3rd, 4th…15th candidate in the comparison will provide information on which pair of reference candidate shows least expression variability among tested samples. This approach allows testing of the expression values for large set of genes and comparing it among each other to select reliable reference candidates.
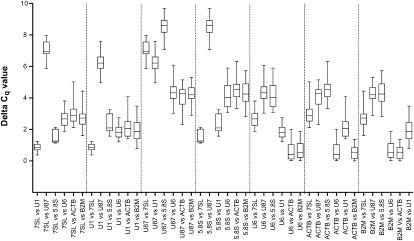
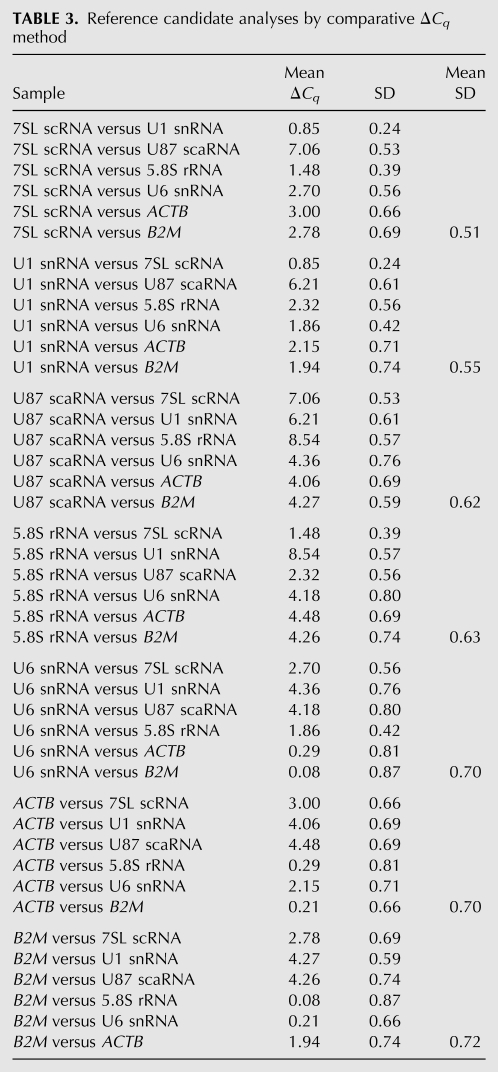
RT-qPCR data obtained from 20 different human tissues for 15 selected candidates was used to calculate ΔCq values. When ΔCq values of all selected candidates were compared with each other, GAPDH, 7SK RNA, HPRT1, and U12 snRNA showed high average ΔCq deviation (SD of 1.15–1.17), and hence high degree of expression variation. Furthermore, moderate expression variation was observed for U2 snRNA, U5 snRNA, U4 snRNA, and U105 snoRNA genes with an SD of 0.96–1.05. The remaining seven reference candidates showing the lowest expression variation were further compared to each another (Fig. 5; Table 3). The results obtained by the ΔCq method were similar to NormFinder analysis. 7SL scRNA and U1 snRNA showed least ΔCq deviation (SD of 0.51 and 0.55, respectively) ranking as most stably expressed genes. U87 scaRNA, and 5.8S rRNA showed moderate levels of deviation (SD of 0.62 and 0.63, respectively) and, hence, intermediate levels of variation. The HKGs ACTB and B2M, showed high ΔCq deviation (SD of 0.70 and 0.72, respectively) indicating a high degree of expression variability, and hence, were ranked lowest in the order. Overall ranking of top seven candidates by ΔCq is as follows: 7SL scRNA > U1 snRNA > U87 scaRNA > 5.8S rRNA > U6 snRNA > ACTB > B2M (Table 3).
FIGURE 5.
Pairwise gene expression stability analysis of seven selected candidates using the comparative ΔCq approach. ΔCq variability is shown as median (line), 25 to 75 percentile (box), and range (whiskers) for 20 human tissue samples. (The numerical data for this figure is in Table 3.)
TABLE 3.
Reference candidate analyses by comparative ΔCq method
BestKeeper expression stability analysis
BestKeeper is a Microsoft Excel-based tool used to determine the “optimal” reference genes by using pairwise correlation analysis of reference candidates (Pfaffl et al. 2004). BestKeeper allows a comparative analysis across potential reference candidates by estimating correlations of the expression levels between all possible candidates. Highly correlated reference candidates are then combined into an index. Thereafter, the pairwise correlation between each candidate and the index are calculated, explaining the relation between the index and contributing reference candidate. BestKeeper determines standard deviation, percent covariance, and “power” of the reference gene, with the user selecting the best genes based on these three variables.
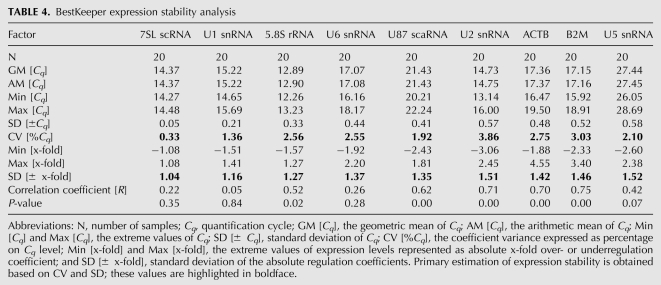
To select 10 best reference candidates for final BestKeeper analysis, we have evaluated HKGs and HKRs separately and together, and compared the resulting data. Reference candidates exhibiting high SD, based on the Cq values, across 20 tissues among the set (U12 snRNA, U4 snRNA, HPRT1, U105 snoRNA, and 7SK RNA) were excluded from further analysis. GAPDH exhibited inverse regulation of expression as shown by the negative correlation index, and was also excluded from further analysis (data not shown). The percentage covariance and standard deviation of 7SL and U1 was among the least, indicating that the expression stability of these candidates was high between the samples and replicates. However, 5.8S rRNA, U87 scaRNA, U2 snRNA, ACTB, and B2M showed the best coefficient of correlation, indicating that the expression of these candidates correlates very well with one another and with the BestKeeper index. Analysis of smaller candidate subsets highlighted the combination of U87 snRNA, U6 snRNA, and U5 snRNA to have the highest correlation and, hence, is recommended for use in combination (data not shown). The summarized results from our final BestKeeper analysis of nine reference candidates are given in Table 4.
TABLE 4.
BestKeeper expression stability analysis
Final ranking of reference candidates
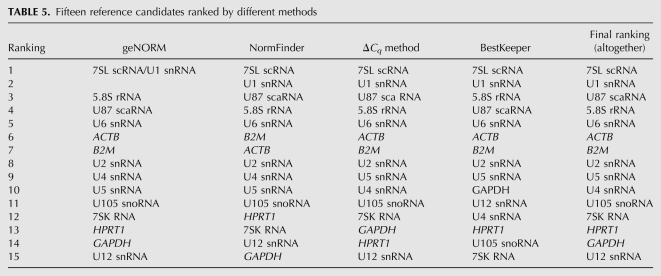
We compared the ranking results of all expression stability analyses to obtain the best reference candidates for normalization of qPCR data (Table 5). According to the results from all stability analysis methods, geNORM, NormFinder, BestKeeper, and comparative ΔCq method, 7SL scRNA and U1 snRNA were ranked as the most constitutively expressed genes, followed by 5.8S rRNA, U87 scaRNA, and U6 snRNA. However, note that NormFinder ranked U87 scaRNA and 5.8S rRNA in reverse order. Apart from minor deviations, all applied methods were consistent to rank 7SL scRNA > U1 snRNA > 5.8S rRNA > U87 scaRNA > U6 snRNA > ACTB > B2M > U2 snRNA as the top eight reference candidates. Hence, among commonly used HKGs only ACTB and B2M exhibited comparably low expression variation in tested human tissues. In contrast, GAPDH and HPRT1 were ranked among the worst reference candidates, further supporting the earlier scepticism against the use of these genes for normalization (Bustin 2002; Huggett et al. 2005; Zhang et al. 2005). In the case of U4 and U5 snRNAs, the other two candidates in the top 10, geNORM and NormFinder ranked U4 ahead of U5 snRNA, where the ΔCq method and BestKeeper ranked them in reverse order. U105 snoRNA, 7SK RNA, and U12 snRNA are shown to be the most variable reference candidates and ranked them last among the 15 tested genes.
TABLE 5.
Fifteen reference candidates ranked by different methods
DISCUSSION
Non-protein-coding RNAs are untranslated RNA molecules frequently playing regulatory roles in different developmental and cellular processes. Expression analysis of the npcRNA transcriptome in different human samples is essential to provide information about their abundance and tissue specificity for further functional study. RNA abundance (or gene expression level) across different samples is commonly assessed by RT-qPCR. This technique has revolutionized transcript quantification but requires careful assay design and reaction optimization to maximize sensitivity, accuracy, and precision (Peters et al. 2004; Nolan et al. 2006).
RNA quality is critical for accurate RT-qPCR data analysis especially when analyzing the small npcRNA transcriptome. Small npcRNAs are short in size (∼20–500 nt) and generally their precursors do not contain intronic sequences. Hence, RNA samples contaminated with genomic DNA will result in an overestimation of RNA transcript abundance. A commonly followed procedure to this problem is the omission of reverse transcriptase as negative controls in RT-qPCR applications. Here, we propose an easy PCR-based assay to monitor DNA contamination in total RNA samples of interest using a primer pair based on the ubiquitously expressed protein-coding gene HNRNPA2B1. All human total RNA samples under investigation in this work were analyzed for genomic DNA contamination prior use applying this assay.
Accurate data normalization is an important but underappreciated aspect of quantitative gene expression analysis. The purpose of normalization is to minimize as much as possible the differences between test samples due to technical variation resulting from differences in sample procurement, total RNA quality, cDNA synthesis, and efficiency of target gene amplification. The normalizer, primarily called the reference gene, is usually a protein-coding gene or ribosomal RNA gene that exhibits invariant expression level across all test samples and is expressed along with all possible targets of interest in the test samples. In earlier studies, the conventional strategy for RT-qPCR normalization was to employ a single housekeeping gene, mostly GAPDH or ACTB, as a normalizer without any further validation. However, this might lead to erroneous conclusions, as many reports suggested that expression of these genes varies up to 10-fold across different samples (Warrington et al. 2000; Tricarico et al. 2002). In 2002, Vandesompele and colleagues pointed out that the expression level of individual HKGs can vary considerably in different samples, and hence, more than one reference gene should be used for validating each sample type and method. Since that time, it is widely accepted that the selection of ideal reference genes in expression analysis has to be performed for each individual experimental setup carefully by evaluating several genes a priori and possibly multiple normalizers, minimum two or three, should be used for data validation (Vandesompele et al. 2002; Pfaffl et al. 2004). Moreover, systematic analyses of multiple reference genes are helpful to identify putative candidates that can be short listed when a new experiment is designed.
To the best of our knowledge, this is the first detailed report on transcript abundance of a set of npcRNA genes of different classes and no systematic study has yet been carried out to determine optimal npcRNAs as normalizers in RT-qPCR assays other than miRNAs (Peltier and Latham 2008; Mestdagh et al. 2009), despite the identification of a multitude of novel npcRNA molecules in eukaryotic genomes. So far, npcRNA molecules applied as internal controls are primarily ribosomal RNAs, such as 5S rRNA (Lu and Cullen 2004; Copela et al. 2008), 5.8S rRNA (Michael et al. 2003), 18S rRNA (Hellwig and Bass 2008), or U6 snRNA (Fok et al. 2006). However, thorough experimental analysis of these npcRNAs for their expression stability as normalizers was not performed. Hence, we included two of these npcRNAs, 5.8S rRNA and U6 snRNA, in our study. In total, we analyzed the expression of 18 npcRNA candidates of different functional classes in combination with four HKGs in 20 different human tissues. All the protein-coding reference genes used in this study are considered to be the most common HKGs and their use was reported in a multitude of RT-qPCR studies. The obtained RT-qPCR expression data of all reference candidates were evaluated using four independent expression stability analysis methods, geNORM, NormFinder, BestKeeper, and a comparative ΔCq method, and their results were compared.
All applied methods ranked 7SL scRNA, U1 snRNA, 5.8S rRNA, and U87 scaRNA at the top, indicating that these npcRNAs show most stable expression in the human tissues analyzed. Five of the evaluated npcRNA candidates (7SL scRNA, U1 snRNA, 5.8S rRNA, U87 scaRNA, and U6 snRNA) possess significantly higher expression stability than the best protein-coding HKGs in this study, ACTB and B2M. Furthermore, U2 snRNA is shown to be more stable than both U5 snRNA and U4 snRNA, by all expression stability analysis methods, and was ranked just below ACTB and B2M. geNORM and NormFinder ranked U4 ahead of U5 snRNA, whereas the ΔCq method and BestKeeper ranked U5 and U4 snRNA in reverse order. All remaining npcRNA candidates, along with the housekeeping genes GAPDH and HPRT1, exhibited high expression variation, and hence, were positioned among the least stable reference genes in this set.
From these findings we conclude that although any of the top five HKR normalizers might be sufficient as a single reference in some experimental situation, more than one is preferred to produce more accurate data. Considering the effort and limited sample availability in many experimental designs, it is not always possible to systematically test large sets of npcRNA candidates to select the most suitable reference genes for normalization. Based on our stability analysis results, we therefore recommend the inclusion of 7SL scRNA, U6 snRNA, and U87 scaRNA in the minimal set of reference candidates to be evaluated for normalization in any given npcRNA transcriptome analysis. From the three most constitutively expressed and most abundant npcRNAs (7SL scRNA, U1 snRNA, and 5.8S rRNA), we recommend 7SL scRNA to be included in the minimal set, since 7SL scRNA is the most stable. In general, the reference genes used for normalization should be of similar abundance as the target gene. 5.8S rRNA is highly abundant, and therefore, its use can be counterproductive when analyzing many npcRNAs. U1 snRNA is excluded due to its lower stability in comparison to 7SL scRNA and due to the presence of U6 snRNA, another small nuclear RNA in the minimal set. U6 snRNA and U87 scaRNA exhibited better expression stability in their final rankings than the best HKGs, ACTB and B2M. Furthermore, the three proposed candidates belong to three different classes of npcRNAs (small nuclear RNA, small cytoplasmic RNA, and small cajal body-specific RNA), and should avoid the problem of coregulation among the minimal reference candidate set.
In conclusion, our findings suggest that usage of a set of npcRNAs for normalization will result in more accurate RT-qPCR data analysis than using common protein-coding HKGs. Hence, we recommend our set of evaluated npcRNA candidates as “housekeeping RNAs” for the normalization of RT-qPCR data in npcRNA transcriptome analyses of known, novel, or computationally predicted npcRNAs. More broadly, we envisage that this set of HKRs could also serve as normalizers in general human transcriptome analyses by RT-qPCR requiring minimal optimization or prior evaluation of reference genes. Furthermore, since many of the HKRs have orthologous sequences, these might provide a stable set of normalizers for comparative expression analyses in nonhuman species.
MATERIALS AND METHODS
Total RNA samples
RNA samples for expression evaluation (FirstChoice Human Total RNA Survey Panel) were purchased from Ambion. All Total RNA products from Ambion are DNase treated, certified for purity and integrity, and tested on the Agilent Bioanalyzer. The panel comprises total RNA from the following human tissues: adipose, bladder, brain, cervix, colon, esophagus, heart, kidney, liver, lung, ovary, placenta, prostate, skeletal muscle, small intestine, spleen, testes, thymus, thyroid, and trachea. Total RNA concentration and purity were verified using a NanoDrop spectrophotometer ND-1000 (Thermo Scientific) by measuring absorbance at OD260/280. Further, total RNA samples were analyzed for the possible presence of DNA contamination by PCR using forward primer (GGTCATAATGCAGAAGTAAGAAAGGC) and reverse primer (CACCACGTGAATCCCCAAA) from HNRNPA2B1 gene using the same condition as for primer validation (see below).
cDNA synthesis
cDNA synthesis was performed using SuperScript II reverse transcriptase (Invitrogen) with oligo(dT) and random hexamer primers (Invitrogen) according to the manufacturer's instructions. In brief, to 5 μg of total RNA, 0.5 μL of oligo(dT)12–18 (500 μg/μL), 1 μL of random hexamer primers (3 μg/μL), 1 μL of dNTP mix (25 mM mix), and 7.5 μL of DEPC-treated water (Ambion) were added and incubated at 65°C for 5 min. After chilling on ice for 2–3 min and brief centrifugation, 5 μL of first-strand synthesis buffer (5×, containing 250 mM Tris-HCl [pH 8.3], 375 mM KCl, 15 mM MgCl2), 2 μL of 0.1 M DTT, 2.5 μL of ribolock RNase inhibitor (40 U/μL, Fermentas), and 1 μL of (200 U/μL) of SuperScript II reverse transcriptase was added and incubated at 42°C for 90 min. Reverse transcriptase activity was terminated by incubation at 75°C for 15 min and samples were stored at –20°C until use. Final cDNA was diluted 1:20 before use in RT-qPCR.
Primer design
All npcRNA reference candidate primers for RT-qPCR analysis were designed using Primer Express 2.0 software (Applied Biosystems). The length of the primers are between 18 and 26 nt, with GC content ranging from 38% to 60% and the melting temperature (Tm value) is between 58°C and 60°C. Amplicon length ranges from 80 to 132 bp. Hairpin structures and primer dimerization formation were analyzed using secondary structure analysis of Primer Express 2.0 software. Additionally, all designed primer pairs were checked for nonspecific amplification by in silico PCR (UCSC, http://genome.ucsc.edu) and by performing a BLAST search (NCBI, http://blast.ncbi.nlm.nih.gov) for chromosomal localization of the amplicon and uniqueness of the primers. Primer sequences are given in Table 2 and were synthesized by Invitrogen.
Primer validation
All primers were examined for their target specificity by end-point PCR, with human brain cDNA as a template, using following conditions: the final 20 μL PCR reaction contains, 1 μL of brain cDNA (10 ng), 125 μM dNTPs (Invitrogen), 0.5 μM of forward and reverse primers and 1 μL Taq polymerase. The PCR program consists of initial denaturation at 95°C for 30 sec, 30 cycles of 95°C for 30 sec, 55°C for 30 sec, and 72°C for 30 sec, followed by final extension at 72°C for 2 min. Amplification products were checked on 2.5% agarose gels for single band of correct size. Amplified products were purified using QIAquick Gel Extraction Kit (Qiagen) and cloned into pCRII-TOPO using TOPO TA Cloning kit (Invitrogen) according to manufacturer's instructions. Positive clones were verified by Sanger sequencing using M13 reverse primer followed by a BLAST search on NCBI.
The linearity of target amplification was evaluated using triplicate serial dilutions (1:1, 1:10, 1:100, and 1:1000) of brain cDNA samples (20–0.02 ng) as a template on ABI 7900HT sequence detection system (Applied Biosystems) as described below. For each pair of primers, the Cq values versus cDNA concentration input were plotted to determine the slope values and correlation coefficients (R2). The corresponding RT-qPCR primer efficiencies (E) were calculated according to the equation: E = (10[−1/slope]).
Quantitative real-time PCR
To measure the transcript levels of selected genes by RT-qPCR, a protocol using Power SYBR Green Master Mix (Applied Biosystems) was applied and analysis was performed on an ABI Prism 7900HT sequence detector system. Each reaction was performed in triplicates in a reaction volume of 10 μL in 384-well microtitre plates (Applied Biosystems). All reactions contained 2 μL of cDNA (20 ng), 5 μL of 2× SYBR Green Master Mix and 1 μL of 10 μM of each primers and 2 μL of DEPC-treated water. The reaction protocol starts with 2-min activation step at 50°C, 10 min template denaturation step at 95°C, followed by 40 cycles of 95°C for 15 sec and 60°C for 1 min. SYBR Green assay also included a melt curve at the end of the cycling protocol, with continuous fluorescence measurement from 60°C to 95°C. Nontemplate controls were also run in triplicate for each primer master mix.
Baseline and threshold values were automatically determined for all reactions in the plate using SDS 2.1 software (Applied Biosystems), and results were imported to Microsoft Excel for further analysis. The mean values from triplicates were obtained for further calculations. In some cases, where extreme differences were seen in Cq values among triplicates, errors were corrected appropriately. Raw Cq values were transformed to quantities in the excel spreadsheet based on ΔCq method. The data obtained have been converted to appropriate input files, according to the requirements of the program, and analyzed using geNORM (version 3.4), NormFinder (version 0.953), and BestKeeper VBA applets.
MIQE standards
All qPCR experiment data comply with the Minimum Information for Publication of Quantitative Real-Time PCR Experiments (MIQE) guidelines (Bustin et al. 2009), and can be found in the MIQE checklist (Supplemental Table 1).
SUPPLEMENTAL MATERIAL
Supplemental material can be found at http://www.rnajournal.org.
ACKNOWLEDGMENTS
This work was supported by the German Ministry of Education and Research (BMBF) under the National Genome Research Program (Grant Nos. NGFNII-EP 0313358A, NGFNII-EP 0313358C, and NGFNIII 01GS0808), as well as the Max Planck Society.
Footnotes
Article published online ahead of print. Article and publication date are at http://www.rnajournal.org/cgi/doi/10.1261/rna.1755810.
REFERENCES
- Andersen CL, Jensen JL, Orntoft TF. Normalization of real-time quantitative reverse transcription-PCR data: A model-based variance estimation approach to identify genes suited for normalization, applied to bladder and colon cancer data sets. Cancer Res. 2004;64:5245–5250. doi: 10.1158/0008-5472.CAN-04-0496. [DOI] [PubMed] [Google Scholar]
- Brosius J. Waste not, want not—transcript excess in multicellular eukaryotes. Trends Genet. 2005;21:287–288. doi: 10.1016/j.tig.2005.02.014. [DOI] [PubMed] [Google Scholar]
- Brosius J, Tiedge H. RNomenclature. RNA Biol. 2004;1:81–83. doi: 10.4161/rna.1.2.1228. [DOI] [PubMed] [Google Scholar]
- Bustin SA. Quantification of mRNA using real-time reverse transcription PCR (RT-PCR): Trends and problems. J Mol Endocrinol. 2002;29:23–39. doi: 10.1677/jme.0.0290023. [DOI] [PubMed] [Google Scholar]
- Bustin SA, Benes V, Garson JA, Hellemans J, Huggett J, Kubista M, Mueller R, Nolan T, Pfaffl MW, Shipley GL, et al. The MIQE guidelines: Minimum information for publication of quantitative real-time PCR experiments. Clin Chem. 2009;55:611–622. doi: 10.1373/clinchem.2008.112797. [DOI] [PubMed] [Google Scholar]
- Chu CY, Rana TM. Small RNAs: Regulators and guardians of the genome. J Cell Physiol. 2007;213:412–419. doi: 10.1002/jcp.21230. [DOI] [PubMed] [Google Scholar]
- Copela LA, Fernandez CF, Sherrer RL, Wolin SL. Competition between the Rex1 exonuclease and the La protein affects both Trf4p-mediated RNA quality control and pre-tRNA maturation. RNA. 2008;14:1214–1227. doi: 10.1261/rna.1050408. [DOI] [PMC free article] [PubMed] [Google Scholar]
- Filipowicz W, Pogacic V. Biogenesis of small nucleolar ribonucleoproteins. Curr Opin Cell Biol. 2002;14:319–327. doi: 10.1016/s0955-0674(02)00334-4. [DOI] [PubMed] [Google Scholar]
- Fok V, Friend K, Steitz JA. Epstein-Barr virus noncoding RNAs are confined to the nucleus, whereas their partner, the human La protein, undergoes nucleocytoplasmic shuttling. J Cell Biol. 2006;173:319–325. doi: 10.1083/jcb.200601026. [DOI] [PMC free article] [PubMed] [Google Scholar]
- Greber B, Lehrach H, Adjaye J. Fibroblast growth factor 2 modulates transforming growth factor beta signaling in mouse embryonic fibroblasts and human ESCs (hESCs) to support hESC self-renewal. Stem Cells. 2007;25:455–464. doi: 10.1634/stemcells.2006-0476. [DOI] [PubMed] [Google Scholar]
- Hellwig S, Bass BL. A starvation-induced noncoding RNA modulates expression of Dicer-regulated genes. Proc Natl Acad Sci. 2008;105:12897–12902. doi: 10.1073/pnas.0805118105. [DOI] [PMC free article] [PubMed] [Google Scholar]
- Huggett J, Dheda K, Bustin S, Zumla A. Real-time RT-PCR normalization; Strategies and considerations. Genes Immun. 2005;6:279–284. doi: 10.1038/sj.gene.6364190. [DOI] [PubMed] [Google Scholar]
- Huttenhofer A, Vogel J. Experimental approaches to identify noncoding RNAs. Nucleic Acids Res. 2006;34:635–646. doi: 10.1093/nar/gkj469. [DOI] [PMC free article] [PubMed] [Google Scholar]
- Huttenhofer A, Kiefmann M, Meier-Ewert S, O'Brien J, Lehrach H, Bachellerie JP, Brosius J. RNomics: An experimental approach that identifies 201 candidates for novel, small, nonmessenger RNAs in mouse. EMBO J. 2001;20:2943–2953. doi: 10.1093/emboj/20.11.2943. [DOI] [PMC free article] [PubMed] [Google Scholar]
- Jiang J, Lee EJ, Gusev Y, Schmittgen TD. Real-time expression profiling of microRNA precursors in human cancer cell lines. Nucleic Acids Res. 2005;33:5394–5403. doi: 10.1093/nar/gki863. [DOI] [PMC free article] [PubMed] [Google Scholar]
- Kapranov P, Cawley SE, Drenkow J, Bekiranov S, Strausberg RL, Fodor SP, Gingeras TR. Large-scale transcriptional activity in chromosomes 21 and 22. Science. 2002;296:916–919. doi: 10.1126/science.1068597. [DOI] [PubMed] [Google Scholar]
- Lestrade L, Weber MJ. snoRNA-LBME-db, a comprehensive database of human H/ACA and C/D box snoRNAs. Nucleic Acids Res. 2006;34:D158–D162. doi: 10.1093/nar/gkj002. [DOI] [PMC free article] [PubMed] [Google Scholar]
- Lu S, Cullen BR. Adenovirus VA1 noncoding RNA can inhibit small interfering RNA and microRNA biogenesis. J Virol. 2004;78:12868–12876. doi: 10.1128/JVI.78.23.12868-12876.2004. [DOI] [PMC free article] [PubMed] [Google Scholar]
- Matera AG, Terns RM, Terns MP. Noncoding RNAs: Lessons from the small nuclear and small nucleolar RNAs. Nat Rev Mol Cell Biol. 2007;8:209–220. doi: 10.1038/nrm2124. [DOI] [PubMed] [Google Scholar]
- Mattick JS. RNA regulation: A new genetics? Nat Rev Genet. 2004;5:316–323. doi: 10.1038/nrg1321. [DOI] [PubMed] [Google Scholar]
- Mattick JS. The functional genomics of noncoding RNA. Science. 2005;309:1527–1528. doi: 10.1126/science.1117806. [DOI] [PubMed] [Google Scholar]
- Mestdagh P, Van Vlierberghe P, De Weer A, Muth D, Westermann F, Speleman F, Vandesompele J. A novel and universal method for microRNA RT-qPCR data normalization. Genome Biol. 2009;10:R64. doi: 10.1186/gb-2009-10-6-r64. [DOI] [PMC free article] [PubMed] [Google Scholar]
- Michael MZ, O'Connor SM, van Holst Pellekaan NG, Young GP, James RJ. Reduced accumulation of specific microRNAs in colorectal neoplasia. Mol Cancer Res. 2003;1:882–891. [PubMed] [Google Scholar]
- Nolan T, Hands RE, Bustin SA. Quantification of mRNA using real-time RT-PCR. Nat Protoc. 2006;1:1559–1582. doi: 10.1038/nprot.2006.236. [DOI] [PubMed] [Google Scholar]
- Peltier HJ, Latham GJ. Normalization of microRNA expression levels in quantitative RT-PCR assays: Identification of suitable reference RNA targets in normal and cancerous human solid tissues. RNA. 2008;14:844–852. doi: 10.1261/rna.939908. [DOI] [PMC free article] [PubMed] [Google Scholar]
- Peters IR, Helps CR, Hall EJ, Day MJ. Real-time RT-PCR: Considerations for efficient and sensitive assay design. J Immunol Methods. 2004;286:203–217. doi: 10.1016/j.jim.2004.01.003. [DOI] [PubMed] [Google Scholar]
- Pfaffl MW, Tichopad A, Prgomet C, Neuvians TP. Determination of stable housekeeping genes, differentially regulated target genes and sample integrity: BestKeeper–Excel-based tool using pair-wise correlations. Biotechnol Lett. 2004;26:509–515. doi: 10.1023/b:bile.0000019559.84305.47. [DOI] [PubMed] [Google Scholar]
- Pheasant M, Mattick JS. Raising the estimate of functional human sequences. Genome Res. 2007;17:1245–1253. doi: 10.1101/gr.6406307. [DOI] [PubMed] [Google Scholar]
- Radonic A, Thulke S, Mackay IM, Landt O, Siegert W, Nitsche A. Guideline to reference gene selection for quantitative real-time PCR. Biochem Biophys Res Commun. 2004;313:856–862. doi: 10.1016/j.bbrc.2003.11.177. [DOI] [PubMed] [Google Scholar]
- Schmittgen TD, Zakrajsek BA. Effect of experimental treatment on housekeeping gene expression: Validation by real-time quantitative RT-PCR. J Biochem Biophys Methods. 2000;46:69–81. doi: 10.1016/s0165-022x(00)00129-9. [DOI] [PubMed] [Google Scholar]
- Silver N, Best S, Jiang J, Thein SL. Selection of housekeeping genes for gene expression studies in human reticulocytes using real-time PCR. BMC Mol Biol. 2006;7:33. doi: 10.1186/1671-2199-7-33. [DOI] [PMC free article] [PubMed] [Google Scholar]
- Suzuki T, Higgins PJ, Crawford DR. Control selection for RNA quantitation. Biotechniques. 2000;29:332–337. doi: 10.2144/00292rv02. [DOI] [PubMed] [Google Scholar]
- Szymanski M, Barciszewski J. Beyond the proteome: Non-coding regulatory RNAs. Genome Biol. 2002;3:0005.1–0005.8. doi: 10.1186/gb-2002-3-5-reviews0005. [DOI] [PMC free article] [PubMed] [Google Scholar]
- Taft RJ, Pheasant M, Mattick JS. The relationship between non-protein-coding DNA and eukaryotic complexity. Bioessays. 2007;29:288–299. doi: 10.1002/bies.20544. [DOI] [PubMed] [Google Scholar]
- Tang TH, Bachellerie JP, Rozhdestvensky T, Bortolin ML, Huber H, Drungowski M, Elge T, Brosius J, Huttenhofer A. Identification of 86 candidates for small nonmessenger RNAs from the archaeon Archaeoglobus fulgidus. Proc Natl Acad Sci. 2002;99:7536–7541. doi: 10.1073/pnas.112047299. [DOI] [PMC free article] [PubMed] [Google Scholar]
- Tichopad A, Didier A, Pfaffl MW. Inhibition of real-time RT-PCR quantification due to tissue-specific contaminants. Mol Cell Probes. 2004;18:45–50. doi: 10.1016/j.mcp.2003.09.001. [DOI] [PubMed] [Google Scholar]
- Tichopad A, Dilger M, Schwarz G, Pfaffl MW. Standardized determination of real-time PCR efficiency from a single reaction set-up. Nucleic Acids Res. 2003;31:e122. doi: 10.1093/rar/gng122. [DOI] [PMC free article] [PubMed] [Google Scholar]
- Tricarico C, Pinzani P, Bianchi S, Paglierani M, Distante V, Pazzagli M, Bustin SA, Orlando C. Quantitative real-time reverse transcription polymerase chain reaction: normalization to rRNA or single housekeeping genes is inappropriate for human tissue biopsies. Anal Biochem. 2002;309:293–300. doi: 10.1016/s0003-2697(02)00311-1. [DOI] [PubMed] [Google Scholar]
- Vandesompele J, De Preter K, Pattyn F, Poppe B, Van Roy N, De Paepe A, Speleman F. Accurate normalization of real-time quantitative RT-PCR data by geometric averaging of multiple internal control genes. Genome Biol. 2002;3:0034-1–0034-11. doi: 10.1186/gb-2002-3-7-research0034. [DOI] [PMC free article] [PubMed] [Google Scholar]
- Walker NJ. Tech.Sight. A technique whose time has come. Science. 2002;296:557–559. doi: 10.1126/science.296.5567.557. [DOI] [PubMed] [Google Scholar]
- Warrington JA, Nair A, Mahadevappa M, Tsyganskaya M. Comparison of human adult and fetal expression and identification of 535 housekeeping/maintenance genes. Physiol Genomics. 2000;2:143–147. doi: 10.1152/physiolgenomics.2000.2.3.143. [DOI] [PubMed] [Google Scholar]
- Washietl S, Hofacker IL, Lukasser M, Huttenhofer A, Stadler PF. Mapping of conserved RNA secondary structures predicts thousands of functional noncoding RNAs in the human genome. Nat Biotechnol. 2005a;23:1383–1390. doi: 10.1038/nbt1144. [DOI] [PubMed] [Google Scholar]
- Washietl S, Hofacker IL, Stadler PF. Fast and reliable prediction of noncoding RNAs. Proc Natl Acad Sci. 2005b;102:2454–2459. doi: 10.1073/pnas.0409169102. [DOI] [PMC free article] [PubMed] [Google Scholar]
- Zhang X, Ding L, Sandford AJ. Selection of reference genes for gene expression studies in human neutrophils by real-time PCR. BMC Mol Biol. 2005;6:4. doi: 10.1186/1471-2199-6-4. [DOI] [PMC free article] [PubMed] [Google Scholar]


