

Abstract
The balanced manifestation of effector functions and the generation of long-living memory cells is a hallmark of efficient CD8+ T cell response. Accumulating data pinpoint regulatory CD4+ CD25high T cells (Treg) as a key factor for the inefficiency of CD8+ T cell responses in viral persistence. Little is known about the effects of Treg on the homeostasis of healthy donor CD8+ T cells. The present study demonstrates that Treg exert differential effects on CD8+ T cell subsets. Treg inhibited mostly the polyclonal proliferation of CD27- effector cells when compared to CD27+ memory CD8+ T cells. Moreover, they inhibited the polyclonal and antigen-driven differentiation of memory cells into functional effectors as defined by IFN-γ secretion and induction of CD 160 expression. Finally, Treg reduced the apoptosis of memory, and not of effector and terminal effector cell populations. These effects were, at least in part, mediated by a decreased expression of PD-L1, but not of PD-1, on CD8+ T cells after activation. Thus, in the settings of a healthy immune system, Treg fine-tune the memory/effector cell balance and promote the accumulation of long-living memory cells in case of strong stimulation.
Keywords: Antigens, CD; metabolism; Apoptosis; physiology; Apoptosis Regulatory Proteins; metabolism; CD8-Positive T-Lymphocytes; immunology; Cell Differentiation; Cell Proliferation; Cytokines; metabolism; Flow Cytometry; Humans; Immunologic Memory; Immunophenotyping; Monocytes; cytology; metabolism; Signal Transduction; T-Lymphocyte Subsets; physiology; T-Lymphocytes, Regulatory; physiology
Introduction
Upon antigen encounter, naïve and memory CD8+ T cells with relevant specificity are driven into massive proliferation, accompanied by gradual acquisition of cytotoxic effector functions1, and generation of antigen-specific memory cells. Antigen clearance signals the termination of the clonal expansion through apoptosis. A number of studies have shown that CD8 T cell differentiation stages may be defined by the ordered expression of certain surface receptors. Naïve CD8 T cells co-express CD45RA isoform, CD28 and CD27 co-stimulatory receptors, and CCR7 chemokine receptor, while antigen-primed cells gradually lose CD45RA and CD28 expression. Recirculating long-living central memory cells still express CCR7, while more differentiated effector-memory cells are CCR7 negative. The irreversible loss of CD27 indicates decreased proliferation potential, increased cytotoxicity and definitive transition towards effector stage. Finally, CD45RA re-expression defines a terminal highly cytotoxic and apoptosis-prone stage 2–5.
A hallmark of efficient CD8+ T cell response is the balance between the prompt manifestation of effector functions and the generation of long-living memory cells5;6. This balance is fine-tuned by external signals and is strongly dependent on the regulatory mechanisms of the host 7–9. Following studies in mice, recent studies in humans have shown that CD4+CD25high T cells (Treg) constitute a small fraction of CD4 T cells that plays a role of immune regulator. These cells inhibit the proliferation of T cells stimulated through their T cell receptor (TCR), and usually exert their suppressive function through contact-dependent mechanisms, though recent data suggest that these cells may also function in a cytokine-dependent manner 10;11. The mechanisms by which Treg exert their suppressive function are not fully elucidated. Some groups have described an increased expression of Glucocorticoid-Induced Tumor necrosis Factor (GITR) and CTLA-4 on Treg, but so far it is not clear whether these molecules are differentiation markers or directly involved in Treg functions 12–14.
The effects of Treg on both CD4 and CD8+ T cell responses have been largely investigated in the settings of chronic viral infections15–20. Accumulating data evidence that this particular population might be a key factor for the inefficiency of CD8+ T cell response and viral persistence. Independently from Treg studies, the interaction between the programmed death 1 (PD-1) receptor and its ligands was shown to affect the survival capacity of CD8 T cells, and hence to be critical for the outcome of anti-viral responses 21–23. In healthy donors, data regarding the regulation of CD8+ T cells by CD4+CD25high T cells are limited to the proliferation and secretion of cytokines at the level of the whole CD8+ T cell population 21–23. Comparatively little is known about the effects of Treg on the differentiation and homeostasis of CD8+ T lymphocyte subsets. In the present paper we studied the effects of Treg on T CD8+ differentiation induced with polyclonal or antigen-specific stimulation. We looked for their effects on cytokines secretion, effector function, proliferation and apoptosis of the different CD8+ subpopulations. Finally, we investigated whether the interaction of PD-1 (CD279) and its ligand PD-L1 (CD274) is involved in Treg-mediated effects.
Material and methods
Cell populations
Healthy donors’ blood was obtained after informed consent was obtained in accordance with the Declaration of Helsinki. All studies received institutional review board approval from the Regional Blood Transfusion Department (Creteil, France). CD8+ and CD4+ T cells were purified by negative separation using RosetteSep CD4- and CD8-enrichment antibody cocktails (StemCell Technologies, Vancouver, Canada), according to manufacturer’s instructions. This procedure resulted in a higher than 90% purity of CD8+ and CD4+ T cell populations as assessed by flow cytometry. CD4+ T purified cells were subsequently incubated with 2 μl CD25-magnetic beads per 10 × 106 cells for 15 minutes at 4°C, and passed on two successive MS magnetic columns (Miltenyi Biotec, Bergisch-Gladbach, Germany), according to company’s guidelines. The CD25-negative fraction after the first passage contained <5% CD25+ cells. The CD25-positive fraction after the second passage (referred to as CD4+CD25high) contained > 93 % CD25+ cells and over 70% of them expressed CD25 with high intensity. In sorting experiments purified CD8+ T cells were stained with CD27/CD45RA mAbs and the memory CD27+CD45RA- (M) and CD27-CD45RA- Effector (E) subsets were sorted under sterile conditions. In some experiments Terminally Effector CD27-CD45RA+ (TE) cells were also sorted (Coulter° sorter).
Immunophenotyping studies
Immunophenotyping was performed using 4-color flow cytometry. Cell fractions were incubated with appropriate mAbs for 30 minutes at 4°C, washed and fixed in PBS 1% formaldehyde. The following murine monoclonal antibodies (mAbs) were purchased from BD Biosciences (Le Pont Claix, France): anti-CD25-FITC, anti-CD4-PerCP, anti-CD8+-PerCP, anti-CD3-APC, anti-CD27-PE, anti-PD-1-PE, anti-PDL1-PE, anti-CD45RA-APC, anti-IL-2-PE, and anti-IFNγ-FITC. Anti-CD45RA Cy5 used for sorting was a product of Coulter. FITC-conjugated anti-CD 160 mAb was produced in one of our laboratories (INSERM U955). Isotype-matched controls were used in all phenotyping experiments.
CFSE proliferation assay
Cell cultures were performed in RPMI 1640 (Bio Whittaker Europe, Verviers, France) supplemented with 10% human blood group AB serum (BioWest, Nuaille, France), penicillin-streptomycin (100 IU/mL and 100 μg/mL, respectively), 2 mM L-glutamine (all from Gibco BRL, Paisley, United Kingdom), and 1 mM sodium pyruvate, (Sigma-Aldrich). CD8+ T cells were washed 3 times in PBS and 3–5 × 10⁷ cells/ml were mixed with 1 μM CFSE (5,6 carboxyfluorescein diacetate succinimidyl ester, Molecular probes) in 1:1 volume ratio. Staining was performed for 8 min at 37°C followed by 3 washes in ice-cold complete medium. For anti-CD3 stimulation, 5 μg/mL anti-CD3 mAb (clone UCHT1; Beckman Coulter, Marseille, France) was coated on 96-well flat-bottomed cell culture plates overnight at 4°C. CFSE-labeled CD8+ T cells were cultured in the presence or absence of CD4+ T cell fractions at a total cell concentration of 2.5 × 10⁶/ml and final volume of 200 μl. Previous titration experiments showed that co-cultures (CD8/Treg) at a ratio 2:1; 4:1 and 8:1 led to 55%, 40% and 22% (mean of 3 experiments) inhibition of CD8 T cell proliferation whereas no inhibition was noted in the presence of CD4+CD25-. In further experiments, co-cultures were performed at a 4:1 ratio. At the end of culture, cells were washed, additionally stained with CD27/CD8/CD45RA; PD-1/CD8/CD4 or PD-L1/CD8/CD4 combinations and analyzed by flow cytometry. The percentage of Treg mediated inhibition was calculated as follows: (% CFSElow in the presence of Treg/% CFSElow in the absence of Treg) × 100.
Cytokine assays
Procedures were performed as previously described 24. CD8+ T cells were cultured in 48 well plates, in the presence or absence of CD4+ T cell fractions at a concentration 5 × 10⁵ cells/well. For antigen specific stimulation experiments, autologous monocytes were added at 5 × 10⁴/well. Overnight stimulation was carried out with plate-bound anti-CD3 (5 μg/ml) or CEF (CMV, EBV and influenza virus) peptide mixture, 5 μg/mL each. Two hours after the beginning of culture 1 μl/ml Brefeldin A (5 μg/mL; Sigma-Aldrich, St Louis, Missouri, MO) was added to each well. Harvested cells were washed 2 times in PBS, surface-stained with CD3/CD8+ mAb, fixed and permeabilized by Cytofix/Cytoperm (BD Pharmingen) and stained for intracellular expression of IFN-γ and IL-2 (30 min at room temperature).
Apoptosis and Transwell studies
CD8+ T cells were cultured in the presence or absence of CD4+ T cell fractions in 96-well round-bottomed plates coated with anti-CD3 at 5 μg/ml. Forty eight hours later cells were harvested, washed with cold PBS, suspended in binding buffer (containing 2.5 mM CaCl2) and stained with Annexin V-FITC (Apoptosis kit, Pharmingen) and a combination of CD27-PE/CD8+-PerCP/CD45RA-APC mAbs for 20 min on ice. At the end of the culture, 300 μl of binding buffer were added, and the samples were analyzed within 30 min by flow cytometry while kept on ice. When needed, CD8+ T cells were preincubated with human PD-L1 blocking mAb (16-5983, eBioscience), at 10 μg/ml for 15 min at 37°C before adding the CD4 cells. For PD-1 apoptosis induction experiments, wells were coated with a combination of CD8 and PD-1 (AF 1086, R&D Systems) mAbs to obtain final concentrations of 5 μg/ml and 20 μg/ml respectively. In Transwell experiments, CD8+ T cells were seeded at 5 × 10⁵/well in the lower chamber of a 24-well plate (Cellstar) coated with 5 μg/ml anti-CD3 mAb, and were cultured in the presence of Treg, or CD4+CD25- T cells, added either in direct contact with CD8+ T cells, or in the upper chamber (Greiner bio-one, Germany).
Flow cytometry
Cells were analyzed by a FACSCalibur flow cytometer (BD Immunocytometry systems). At least 20 × 103 CD8+ gated events were collected for cell surface studies and at least 100 × 103 for cytokine expression studies. Data analysis was performed with CellQuest software. Cells were routinely gated on FSC/SSC plot followed by selection of CD8+ T cells. CD8+ subpopulations were defined on a CD45RA/CD27 plot and analyzed according to the experiment.
Statistical analysis
Statistical analysis was performed with GraphPad Prism 4 software. Essentially Student’s paired t-test was applied to estimate the effects of Treg cells, after a preliminary confirmation of normal data distribution. Notably, equivalent non-parametric tests yielded similar results.
Results
Treg inhibit the polyclonal and antigen-specific proliferation of CD8+ T cells
We first studied the effects of Treg on polyclonal and antigen-specific induced proliferation of CD8+ T cells. To this end, CD8+, CD4+CD25- and CD4+CD25high T cells from 11 healthy donors were purified. We verified that CD4+CD25high Treg cells expressed high levels of the transcription factor FoxP3 (Sup. Fig. 1). CD8+ T cells were labeled with CFSE and stimulated with plate-bound anti-CD3 mAb for 5 days, either with CD4+CD25- or with Treg cells at a 1/4 (suppressor/responder) ratio previously determined in titration experiments (data not shown). Over 80% of anti-CD3 activated CD8+ T cells proliferated when cultured alone (data not shown) or in the presence of CD4+CD25- cells (Fig. 1A). In contrast, CD8 proliferation was significantly reduced in the presence of Treg (average inhibition 39%; range 22 – 77 %) (Fig. 1). Likewise, Treg inhibited antigen-specific proliferation of CD8+ T cells stimulated in the presence of autologous monocytes and CEF peptides: average inhibition 29% (range 18–41%) and 26% (range 17–40%) as compared to cultures performed in the presence of CD4+CD25- control cells (Fig. 1A and B) or alone (data not shown), respectively.
Fig. 1. Treg inhibit anti-CD3 and CEF-induced proliferation of CD8+ T cells.
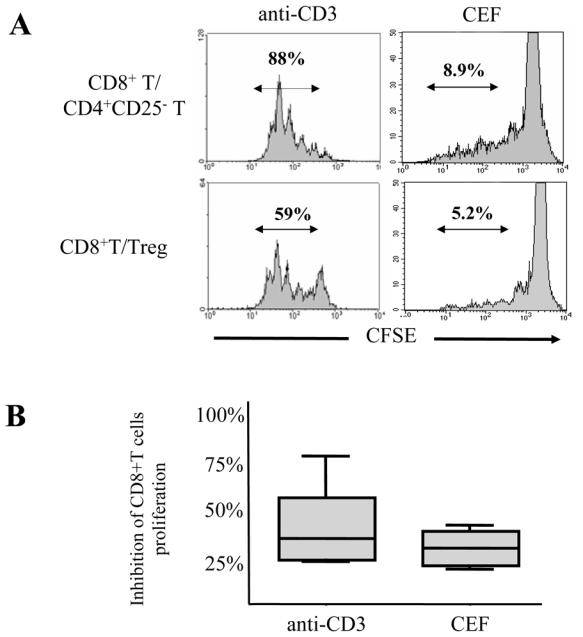
(A)Representative histograms depicting the CFSE profile of CD8+ T cells from a healthy donor stimulated with coated anti-CD3 mAb for 5 days (left panel) or with CEF mix for 7 days (right panel), in the presence of CD4+CD25- T cells (upper row) or Treg (lower row). The percentage of CD8+ T cells that have divided after stimulation (CFSElow) is indicated. (B) Pooled data from 11 donors showing the percentage of inhibition of CD8+ T cell proliferation after anti-CD3 or CEF stimulation in the presence of Treg in comparison with proliferation in the presence of CD4+CD25-. The mean values are depicted with horizontal lines
Treg inhibit CD8+ T cell effector response to polyclonal and antigen-specific stimulation
CD8+ T cell effectors are characterized by an increased capacity of cytokine secretion. We studied the effect of Treg on CD8+ T cell expression of IFN-γ and IL-2 after polyclonal or antigen-specific stimulation. Overnight anti-CD3 stimulation of CD8+ T cells in the presence of Treg resulted in a lower expression of intracellular IFN-γ (mean 1.4%, n=7) as compared to CD8+ T cells stimulated in the presence of CD4+CD25- T cells (mean 5.1 %, P<0.01), (Fig. 2A and B) or alone (mean 4.2%, P<0.05; data not shown). Similarly, Treg decreased the percentages of IFN-γ+ CD8+ T cells (mean 0.5%) stimulated in the presence of CEF peptides as compared to CD8+ T cells stimulated in the presence of CD4+CD25- T cells or alone (1.2% and 0.8%, respectively, P<0.01 for both comparisons) (Fig 2A and B). The effect of Treg on IL-2 expression was less pronounced, and was found significant only for CEF-stimulated cells (mean 0.2% in the presence of Treg as compared to 0.7% in the presence of CD4+CD25-T cells and 0.5% for CD8+ T stimulated alone, P<0.05 for both comparisons) but not for anti-CD3 stimulated CD8+ T cells (mean 0.8% in the presence of Treg as compared to 1.5% in the presence of CD4+CD25-T cells and 1.4% for CD8+ T stimulated alone respectively, P>0.05) (Fig. 2A, B and C and data not shown).
Fig. 2. Treg inhibit the cytokine expression after polyclonal and antigen-specific stimulation of CD8+ T cells.
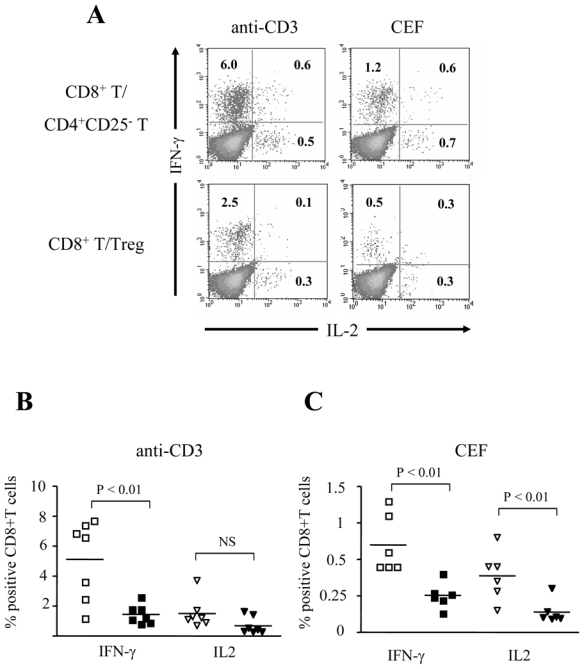
(A). Representative dot-plots of CD8+ T cells secreting IFN-γ and IL-2 after overnight stimulation with coated anti-CD3 (left panel) or CEF (right panel) in the presence of CD4+CD25- T (upper row) or Treg (lower row). The percentage of cytokine-expressing CD8+ T cells is indicated. (B) and (C): Pooled data showing the percentage of CD8+ T cells secreting IFN-γ or IL-2 after overnight stimulation with anti-CD3 (n = 7 donors) (B) or CEF (n=6 donors) (C) in the presence of CD4+CD25- T (open symbols) or Treg (black symbols). The P-values were calculated using a paired Student’s t-test.
Treg inhibit the differentiation of effector CD8 T cells
Next, we evaluated the effects of Treg on the differentiation of activated CD8+ T cells. For this, experiments were performed either with total CD8 T cells or sorted CD8 populations. We defined CD8+ T cells subsets according to the co-expression of CD45RA and CD27 and further studied the expression of CCR7, CD28, and the cytotoxic CD160 receptor in these subsets (Sup. Fig. 2). Based on this analysis, CD27hiCD4RA-CD8+ T cells were mostly CCR7+CD28+, while CD27lowCD45RA- CD8+ T cells contained exclusively CCR7- cells, and a variable proportion of CD28- cells. Both subsets were CD160−/low. Therefore, the CD27+CD45RA- subset contained central memory and memory cells in transition to effectors and was defined as “memory” subset (M) thereafter in the paper. CD27-CD45RA-CD8+ T cells were invariably CCR7-CD28- and expressed high levels of CD160. These cells may be considered as definitely engaged into effector functions and we consequently named them effectors (E). Finally, CD27-CD45RA+CD8+ T cells were also CCR7-CD28-CD160+, and corresponded to terminally differentiated effector cells (TE).
We compared the distribution of M and E CD8+ T cells before (ex vivo analysis) and following 48 hours of anti-CD3 stimulation of total CD8 T cells in the presence of CD4+CD25- T cells or Treg (Fig. 3A). We found that anti-CD3 stimulation changed significantly the distribution of CD8+ T cell subsets resulting in a decrease of the mean (n =14 subjects) M/E ratio from 9.4 in non-stimulated conditions to 3.5 following anti-CD3 stimulation of CD8+ T cells alone (data not shown) and 3.2 in the presence CD4+CD25- T (P<0.001, Fig 3A). In contrast, in the presence of Treg, the mean value of M/E ratio corresponded to 6.7 which was not significantly different from the one obtained for non-activated CD8+ T cells (P>0.5), but was significantly higher than the M/E ratio of CD8+ T cells activated alone or in the presence of T CD4+CD25- T cells (P<0.001, Fig 3A).
Fig. 3. Treg inhibit the maturation of anti-CD3 stimulated CD8+ T cells.
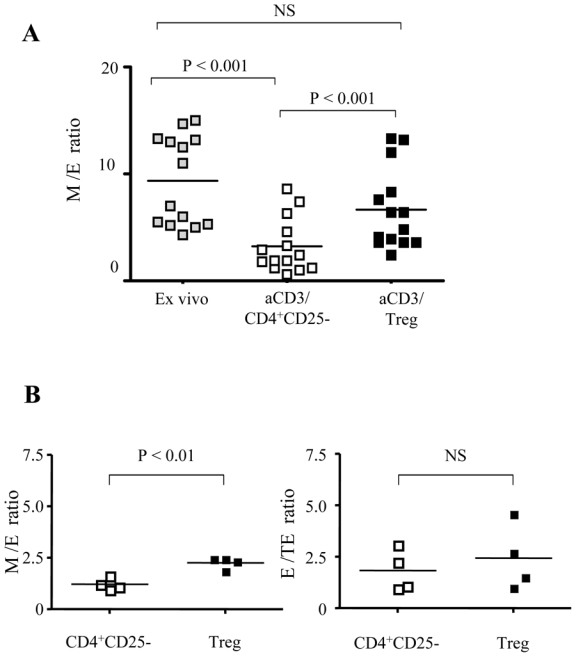
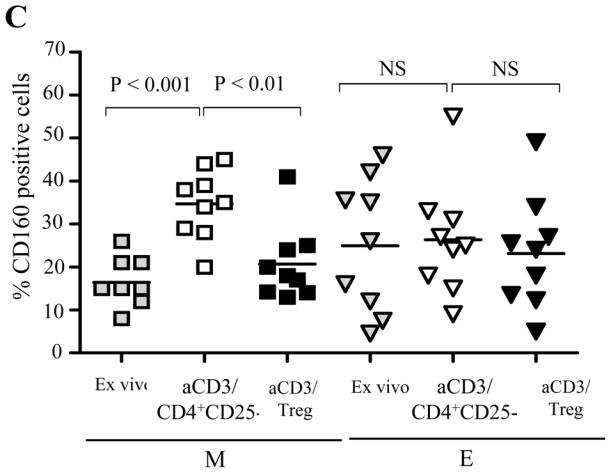
(A) Pooled data from 14 donors showing the ratio of M/E CD8+ T cells before (grey symbols), and after 48h stimulation of total CD8+ T cells with coated anti-CD3 in the presence of CD4+CD25- T (open symbols) or Treg (black symbols) (B) Left panel: M/E ratio resulting from 48h stimulation of sorted M (CD27+CD45RA-) CD8+ T cells with coated anti-CD3 in the presence of CD4+CD25- T (open symbols) or Treg (black symbols); right panel: E/TE ratio resulting from the stimulation of sorted E (CD27-CD45RA-) CD8+ T cells in the same conditions. Pooled data from 4 donors are shown. (C) Pooled data from 9 donors showing the expression of CD 160 before (grey symbols), and after 48h stimulation of total CD8 T cells with coated anti-CD3 in the presence of CD4+CD25- T (open symbols) or Treg (black symbols) on gated Memory (M) and E (effector) CD8+ T cells. The P-values were calculated using a paired Student’s t-test.
Next, we repeated these experiments with sorted M (CD27+CD45RA-) and E (CD27-CD45RA-) CD8 T cells (n=4). These populations were stimulated for 48 hours with anti-CD3 antibodies in the presence of either CD4+CD25- or Treg. Here again, Treg inhibited significantly the maturation of stimulated M to E cells as compared to CD4+CD25- T cells (M/E ratio: 2.3 versus 1.2, respectively; P<0.01), (Figure 3B). In contrast, Treg did not inhibit the maturation of E to TE CD8 T cells (E/TE ratio 1.6 and 2.2 in the presence of CD4+CD25- and Treg, respectively, P=0.08, Fig 3B). Globally, these results indicate that Treg inhibited the differentiation of M to E CD8+ T cells upon polyclonal stimulation.
We have previously shown that the CD160 receptor is expressed by mature circulating or tissue effector cytotoxic CD8+ T cells 24;25. Therefore, we studied CD160 expression on CD8 T cell subsets differentiated from activated total CD8 T cells. Polyclonal stimulation of CD8+ T cells cultured either alone or in the presence of CD4+CD25- T increased the percentage of CD160+ CD8+ T cells (mean 35% and 37%, respectively as compared to 21% under non-stimulated conditions n= 9), (P<0.01). This effect was abolished in the presence of Treg (mean 23%), (not shown). Detailed analysis revealed that this effect was mainly due to a significant inhibition of the induction of CD 160 expression on the M subset: mean 21 % in the presence of Treg as compared to 35 % in the presence of CD4+CD25- T cells, (P<0.01), whereas no effect was noted on E CD8+ T cells (mean 23 % as compared to 26% respectively, P>0.05), (Figure 3C). In addition, we found that Treg decreased the expression of surface CD107a, another marker associated with cytotoxic effector CD8+ T cells (not shown), confirming that Treg prevented the maturation of CD8+ T effectors upon polyclonal stimulation.
We concluded that Treg might exert differential effects on CD8+ T memory and effector subsets, thus changing their proportions at the overall level. More specifically, Treg prevented the differentiation towards E phenotype and promoted the accumulation of M cells.
Treg inhibit preferentially the proliferation of E CD8+ T cells
We next investigated whether Treg affect differently the proliferative rate of anti-CD3 activated M and E CD8+ T cells. Activation of total CD8+ T cells revealed that in contrast to the E subset, M CD8+ T cells had a higher proliferative rate and a lower susceptibility to Treg-mediated inhibition. At day 5, we found that the M subset contained 73% (range 47–92%) CFSElow cells in the presence of CD4+CD25- T, and 61% (range 31–85%) CFSElow cells in the presence of Treg (P<0.05), (Fig. 4A). For E CD8+ T cells, these percentages were 59% (range 48–74) and 39% (range 18–59) respectively (P<0.01). On the average (n = 9 subjects), Treg inhibited the polyclonal proliferation of M and E subsets by 16% and 36%, respectively (P<0.01), (Fig. 4B). Since proliferation is accompanied by differentiation, M and E subsets resulting from activation of CD8+ T cells may be from heterogeneous origin. Therefore, we repeated the above experiments with sorted M (CD27+CD45RA-) and E (CD27-CD45RA-) cells. Similarly, we found that Treg inhibited preferentially the proliferation of sorted E CD8 T cells as compared to M (mean inhibition: 25.5 versus 8.9, respectively; P<0.01; n=4) (Fig. 4C).
Fig. 4. Treg inhibit preferentially the accumulation of E CD8+ T cells.
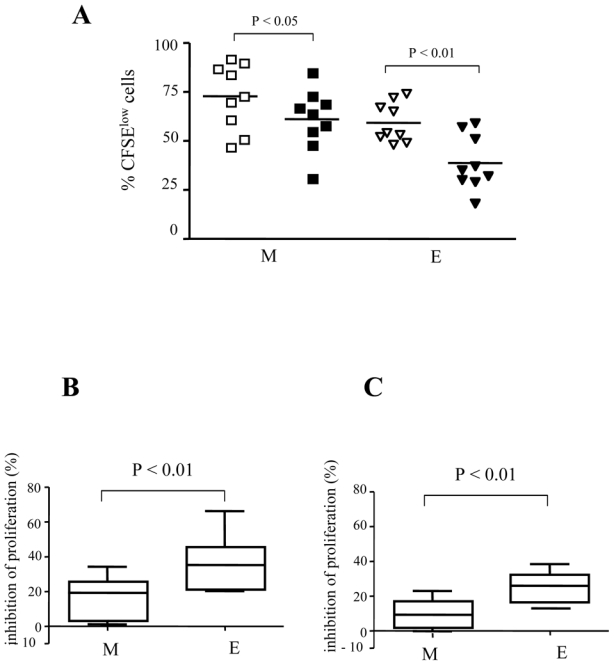
Total CD8+ T cells were stimulated for 5 days with anti-CD3 mAb in the presence of CD4+CD25- T (open symbols) or Treg (black symbols): (A) Percentages of CFSElow M and E CD8 T cell subsets (n=9); (B) Pooled data from 9 donors: mean percentages of inhibition of the proliferation of CD8+ T cell M and E subsets. (C) Sorted M and E CD8+ T cells were stimulated in the presence of Treg or CD4+CD25- cells. Pooled data from 5 donors: mean percentages of inhibition of the proliferation are shown. The mean values are depicted with horizontal lines. P-values were calculated using a paired Student’s t-test.
Globally, these results confirmed that Treg prevent the accumulation of E cells, due to specific effects on CD8 subsets.
Treg inhibit preferentially the apoptosis of M CD8+ T cells
Proliferation in response to strong stimulation is always accompanied by activation-induced cell death (AICD) that terminates clonal expansion. Therefore, we investigated whether Treg could protect similarly the various CD8+ T cell subsets from AICD related to anti-CD3 mAb stimulation. To this end, the apoptosis rate of total CD8+ T cells from 8 healthy donors stimulated in vitro alone, or in the presence of either CD4+CD25- T or Treg was quantified by Annexin V staining. At day 2, mean (ranges) percentage of anti-CD3 activated CD8+ Annexin V+ T cells was 23 % (14–36%), (not shown). In the presence of CD4+CD25- T cells, the rate of CD8+ T cell apoptosis increased to 28 % (18–41%), while Treg decreased this rate to 15% (7–21%, P<0.01), (Fig 5A). Analyses of the apoptosis rates of M, E or TE anti-CD3 activated CD8+ T cells, showed that Treg inhibited significantly M cell apoptosis (mean 15% as compared to 28% in the presence of CD4+CD25- T cells, P<0.01) whereas no significant effects were noted for E and TE subsets (Fig. 5A). These results suggested that M and E CD8 T cells exhibit a different sensitivity to Treg-mediated modulation of apoptosis. However, since these experiments were performed with total CD8 T cells, we cannot rule out cell-cell interactions between different subsets. Therefore, new experiments were performed on sorted M and E T cells. We found in the presence of CD4+CD25- T cells a 19% decrease of apoptosis rate among M as compared to E T cells. This effect was up to 36% in the presence of Treg (P<0.05) (Fig. 5B).
Fig. 5. Treg inhibit preferentially the apoptosis of CD27+CD45RA- M CD8+ T cells.
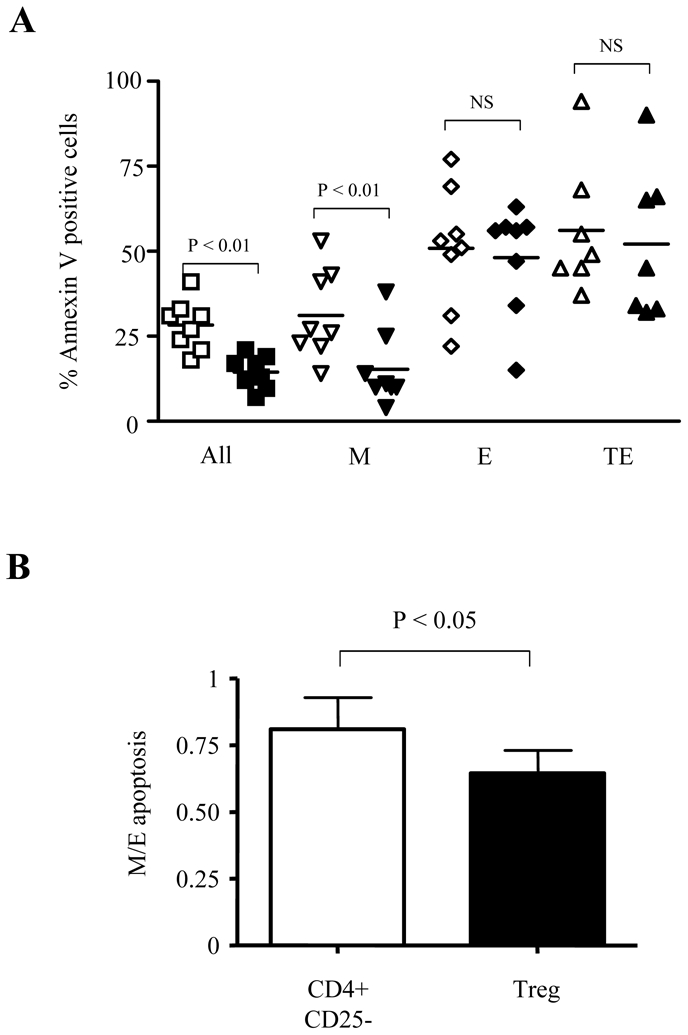
(A) Total CD8+ T cells were stimulated for 48h with anti-CD3 antibodies in the presence of CD4+CD25- T (open symbols) or Treg (black symbols). Percentages of AnnexinV+ on total and gated M, E and TE CD8+ T cells are shown (n=8). (B) Sorted M and E CD8+ T cells were stimulated in the presence of CD4+CD25- T or Treg. In each condition, percentages of Annexin V+ cells were estimated at 48h. Histograms represent the ratio of Annexin V+ M and E observed in CD4+CD25- (white bars) and Treg co-cultures (black bars). P-values were calculated using a paired Student’s t-test.
Treg inhibit the apoptosis of M CD8+ T cells by affecting PD-1/PD-L1 signaling pathway
As the interaction between PD-1 and its ligand PD-L1 has been recently recognized as a key regulator of activated CD8+ T cell survival21–23, we investigated whether this pathway might be involved in Treg - mediated protection of M CD8+ T cells from apoptosis. First, we studied the expression of these molecules on anti-CD3 stimulated total CD8+ T cells. Both PD-1 and its ligand were up-regulated upon activation, with a maximum at 48h, followed by a decrease to the initial levels (data not shown). While PD-L1 expression increased uniformly and significantly in all CD8+ subsets as compared to baseline levels (P<0.01), PD-1 was induced preferentially on the M and E subsets (P<0.01). Moreover, PD-1 expression was significantly higher on activated M as compared to activated E CD8+ T cells (MFI 47 vs. 30, P<0.01), (Fig. 6A). Based on this differential expression, PD-1 seemed a suitable target for subset-specific regulation of the apoptosis rate.
Fig. 6. Treg inhibit the apoptosis of anti-CD3 stimulated CD8+ T cells by regulating PD-L1 expression levels.
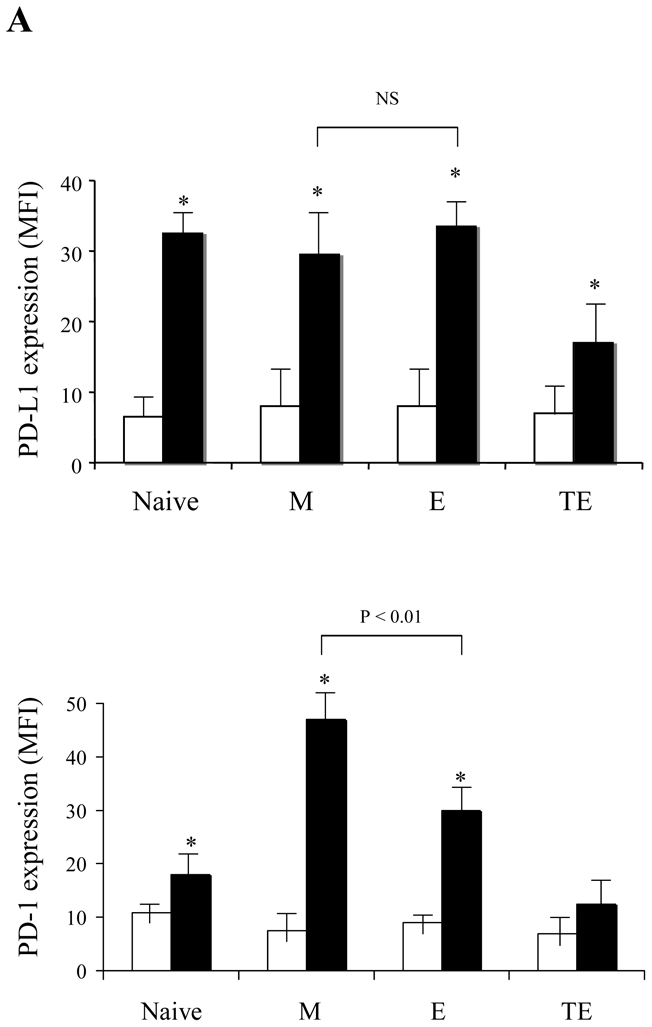
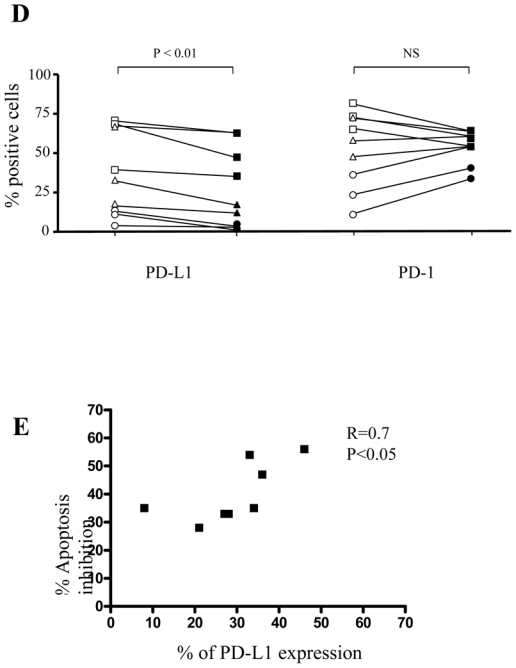
(A) Expression levels of PD-L1 (upper histograms) and PD-1 (lower histograms) at day 0 (white bars) and after 48h (black bars) of anti-CD3 stimulation were compared on the indicated CD8+ T cell subsets. Asterisk denotes a significant change (P < 0.05) as compared to non-stimulated control. (B) Treg and anti-PD-L1 blocking mAb inhibit CD8+ T cell AICD but do not prevent anti-PD-1 induced apoptosis. Pooled data from 7 separate experiments where CD8+ T cells were stimulated for 48h with coated anti-CD3 mAb alone, in the presence of CD4+CD25- T or in the presence of Treg. Blocking anti-PD-L1 or agonist anti-PD-1 antibodies were added as indicated. The percentage of apoptosis change was calculated on the basis of Annexin V+ cells detected when CD8+ T cells were stimulated alone. (C) Pooled data from 12 donors showing the expression of PD-1 and PD-L1 on anti-CD3 stimulated CD8+ T cells in the presence of CD4+CD25- T (open symbols) or Treg (black symbols). (D) M (square) E (triangle) or ET (circle) CD8+ T cell subsets were sorted from 3 different donors and stimulated in the presence of CD4+CD25- T (open symbols) or Treg (black symbols). Percentages of PD-1 and PD-L1 expression in each subset are shown. P-values were calculated using a paired Student’s t-test. (E) Correlation between the inhibition of PD-L1 expression on CD8 T cells and the inhibition of CD8 T cell apoptosis in the presence of Treg. (F) Pooled data from 14 donors showing the expression of PD-1 and PD-L1 on anti-CD3 stimulated CD4+CD25- T (open symbols) or Treg (black symbols).
Accordingly, anti-PD-1 mAb increased significantly the apoptosis rate of activated CD8+ T cells (by a mean of 55%; n=6 experiments), while anti-PD-L1 mAb reduced this rate (by a mean of 41%), as compared to control conditions (Fig. 6B). These data suggest that CD8+ T cell AICD rate might be the consequence of PD-1/PD-L1 “cis” interactions. Co-culture of anti-CD3 activated CD8+ T cells with CD4+CD25- T cells induced apoptosis and did not affect the sensitivity of CD8+ T cells to anti-PD-1 mAb, neither reverted the blocking effect of anti-PD-L1 antibodies. These results confirmed that, in our conditions, AICD rate was principally regulated through CD8+/CD8+ T cell interactions. In contrast, co-culture with Treg reduced significantly the apoptosis rate of CD8+ T cells (by a mean of 22 %, P<0.05), mimicking the effect of PD-L1 blocking mAb. This inhibitory effect was not amplified by addition of anti-PD-L1 antibody, indicating that Treg and anti-PD-L1 effects were not cumulative. Importantly, in the presence of Treg, CD8+ T cells remained sensitive to anti-PD-1 induced apoptosis (Fig 6B). These results strongly suggest that Treg might affect preferentially PD-L1 than PD-1 expression on activated CD8+ T cells.
To test the latter hypothesis, we compared the expression of PD-L1 and PD-1 on CD8+ T cells activated either in the presence of Treg or CD4+CD25- T cells. We found that Treg decreased significantly PD-L1 expression on activated CD8+ T cells as compared to CD4+CD25- T cells (average MFI 23.4 and 30.7, respectively; P<0.01), (Fig. 6C). PD-1 expression under these conditions did not differ significantly (average MFI 39 and 47, respectively; P>0.05), (Fig. 6C). These results showed that Treg affect the apoptosis rate of CD8+ T cells by reducing the expression of PD-L1 on activated CD8+ cells. This effect was confirmed in experiments performed with sorted M, E and TE T cells. Following polyclonal activation, we found a significant decrease in PD-L1, but not PD-1, percentages of expressing cells in the presence of Treg as compared to CD4+CD25-T cells (P<0.01; n=3), (Fig 6D). Finally, we found a significant correlation between the decrease of PD-L1 expression and apoptosis inhibition of CD8 T cells in the presence of Treg (Fig 6E).
Since PD-L1 is also induced on activated CD4 T cells as well, we further compared its expression on the CD4 T cells from co-cultures set with non-regulatory (CD4+CD25-) or with Treg cells. After 48h, CD4 T cells from co-cultures set with CD4+CD25- T cells expressed a significantly higher level of PD-L1 as compared to CD4 T from co-cultures set with Treg (MFI 43.7 and 27.6, respectively; P<0.001) (Fig 6F). Globally, these results show that besides regulating the expression of PD-L1 on CD8 T cells, Treg may reduce apoptosis by presenting a lower level of PD-L1 as compared to non Treg CD4+ T cells.
Treg effect on PD-L1 expression is not exclusively contact-dependent
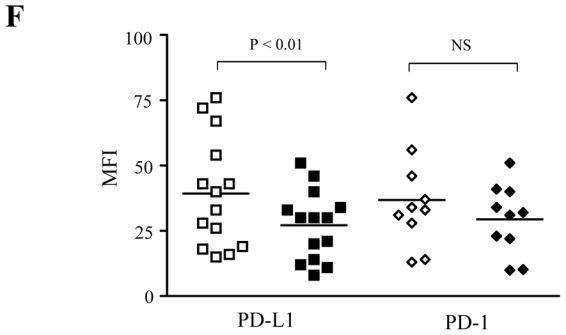
To elucidate some of the mechanisms underlying Treg effects, we asked whether the observed apoptosis inhibition of M CD8+ T ells required cell contact or was cytokine-mediated. To this end, CD8+ T cells were cultured in the lower chamber of Transwell plates coated with anti-CD3 mAb. Treg or CD4+CD25- T cells, were either mixed directly with CD8+ T cells, or added in the upper chamber, separated by a semi-permeable membrane. As shown in Figure 7A, PD-L1 expression on CD8+ T cells decreased in the presence of Treg, either cultured in contact or separated by a semi-permeable membrane. These results demonstrated that Treg might regulate PD-L1 expression during cell contact as well as in a cytokine-dependant manner. Accordingly, Treg decreased significantly the rate of M CD8+ T cell apoptosis even when separated from activated CD8+ T cells by a semi-permeable membrane whereas CD4+CD25- T cells did not prevent AICD of CD8+ T cell populations whatever the culture conditions (Fig 7B for one representative experiment).
Fig. 7. Treg effect on M CD8+ T cell apoptosis is rather cytokine-dependent.
(A) Histogram overlays representing PD-L1 expression on CD8+ T cells stimulated with anti-CD3 for 48h in the presence of CD4+CD25- (open histogram) or Treg cells (grey histogram), either mixed in the lower chamber of a Transwell plate (left) or separated by a semi-permeable membrane (right). (B) Annexin V staining of anti-CD3 activated M CD8+ T cells. Co-cultures of CD8+ T with either CD4+CD25- T cells (left) or Treg (right) were set in Transwell plates as follows: CD8+ T and CD4+ T cells were either mixed in the lower chamber, or separated by semi-permeable membrane. Histograms represent CD27+CD45RA-CD8+-gated cells. Percentage of Annexin V+ cells is shown, based on negative control. One representative out of two with similar results is shown.
Altogether, these results indicate that PD-1/PD-L1 pathway is involved in the regulation of anti-CD3 stimulated CD8+ T cell expansion. We demonstrate that Treg effects on PD-L1 expression and AICD of M CD8+ T cells are rather cytokine-mediated than contact-dependent.
Discussion
In this paper we investigated the role of Treg on the proliferation, functional differentiation and apoptosis of healthy donor CD8+ T cell subsets. Firstly, we found that Treg inhibited the proliferation and effector function of CD8+ T cells under polyclonal and antigen-specific stimulation. Secondly, we demonstrated that Treg affect differentially homeostasis of CD8+ T cell subsets by inhibiting mainly the proliferation of E but not CD27+ M cells. At the same time, Treg inhibited the polyclonal and antigen-driven differentiation of M into E CD8+ T cells. Thirdly, Treg inhibited preferentially the apoptosis of CD27+ CD8 T cells by decreasing their expression of PD-L1, but not of PD-1. Thus, Treg cells influence finely the behavior of activated memory CD8+ T cell subsets and interfere with regulatory mechanisms of CD8+ T cell homeostasis such as the PD-1/PD-L1 pathway.
To our knowledge, we show for the first time specific Treg effects on distinct CD8+ T cell populations. Accumulating data indicate that memory CD8 subsets are part of a differentiation continuum, rather than separate lineages 26;27. Expression of CD45RA isoform is restricted to naïve and/or “reverted” memory T cells, and terminally differentiated effectors2. Expression of CD27 promotes the survival of activated and memory CD8+ T cells28. Furthermore, the ability of activated E cells to re-express CD27 is limited within a certain number of divisions, and the definite loss of this receptor indicates a truly advanced differentiation state3.
The systematic analysis of M and E subsets in conditions of polyclonal stimulation showed that Treg effects are more complicated than a simple inhibition of cell proliferation. Indeed, Treg inhibited more importantly the accumulation of E as compared to M cells and apoptosis of this latter subset. Based on these results, it can be predicted that in the context of strong CD8+ T cell activation, the presence of Treg would maintain and/or increase the pool of memory CD8+ T cells, and limit effector-cell differentiation resulting in a conserved ratio of memory/effector T cells. Accordingly, Suvas et al. reported that HSV-1 specific effector CD8+ T cells remained activated for a longer period of time in CD25+ depleted animals29.
The functional differentiation of CD8+ T cells is characterized by the concomitant expression of cytokines and cytotoxic molecules. In our hands, Treg inhibited significantly the intracellular expression of IFN-γ after both polyclonal and antigen-specific stimulation. Accordingly, Treg inhibited the expression of secretion of cytotoxic granules detected by surface expression of CD10730 (not shown) and CD160, a marker of circulating highly cytotoxic CD8+T cells31;32 At the same time, the effect of Treg on IL-2 expression was not significant in conditions of TCR polyclonal stimulation. Having in mind that IL-2 is the predominant cytokine secreted by M CD8+ T cells, in line with their highly proliferative and self-renewing capacity5, this result confirmed that Treg affect differentially M and E CD8+ T cells.
The balance between CD8+ T cell subsets is the net result of their specific proliferation/death rates. Therefore, Treg might influence the proportion of subsets either by inhibiting their proliferation and/or apoptosis. While most studies investigate the effects of Treg on cell proliferation, data on CD8+ T cell apoptosis are limited. In a recent study, Longhi et al showed that Treg did not change the apoptosis rate of CD8+ cells as measured by Annexin V expression33. However, in our hands, while the apoptosis rate of memory cells decreased in the presence of Treg, no such differences or even increased apoptosis were detected at the level of E and TE cells. Thus, these observations further reinforce the need to evaluate Treg effects at the subpopulation level as shown here.
The differential effects of Treg on M and E cells could be the consequence of some phenotypic differences between these subsets. In agreement with others23, we have detected a significantly higher expression of PD-1 on the CD27+CD8+ memory subset following activation. This indicated that in spite of a potentially long life span, memory CD8+ T cells are much more sensitive to negative regulation. Numerous recent studies in animal models and in humans have pin-pointed the PD-1/PD-L1 pathway as crucial for the outcome of a virus-specific response, independently of CD4+ T cell help34–36. Sekaly et al, have demonstrated that in HIV+ subjects, PD-1 expression is more frequent within the HIV-specific memory CD27+CD8+ T cell subset, and that these cells are much prone to “exhaustion”23. Thus, PD-1/PD-L1 signaling appears as a key mechanism of regulation of activated CD8+ T cells. Interestingly, we found that Treg decreased significantly PD-L1, but not PD-1 expression on memory CD8+ T cells resulting in a decreased apoptosis rate. Moreover, in conditions of anti-CD3 stimulation, Treg themselves expressed less PD-L1 than activated non-regulatory CD4 (see Fig. 6F). However, we cannot rule out that Treg might impact other pathways (cytokine secretion or decreased expression of other death molecules) of CD8 T cell death. Globally, these results showed that activation of CD8 T cells in the context of Treg results in a lower level of PD-L1 molecules available for interacting with activated PD-1hlgh memory cells.
Transwell experiments indicated that the effects of Treg on PD-L1 expression and M CD8+ T cell apoptosis are rather cytokine-dependent. These results are in accordance with the reported cytokine-mediated regulation of PD-L1 expression35;37. Numerous studies on the mechanism of Treg function have been conducted in various models. In some animal models suppression is reversed by neutralizing anti-IL-10 or TGFβ antibodies indicating a possible effect of these cytokines in vivo38–40. In contrast, in human, the regulation of CD8+ T cell response by Treg appears to be mainly contact-dependent 19;33;41;42. Nevertheless, other authors did not exclude a contact-independent mechanism involved in the inhibition of CD8+ proliferation33. Accordingly, our results demonstrate that the Treg-induced inhibition of M CD8+ T cell AICD is at least in part mediated through soluble factors. (Fig. 7).
Our findings may have significant physiological implications since protective immunity is more efficiently conferred by memory CD8+ T cells5. In acute viral infections, a vigorous CD8+ T cell response leads to viral clearance. However, many viruses lead to persistent infection despite detectable CD8+T cell responses, a condition in which Treg may be involved. In these situations, it is not clear whether Treg are “friend or foe” leading to a suppression of tissue damage mediated by virus-specific effector cells or inhibition of host immunity43. The accumulation of Treg in the settings of uncontrolled infection, as well as their ability to strongly inhibit the antigen-specific proliferation and effector functions, have been demonstrated in a number of human and animal model infections: HIV15;16;19;20, HBV15;16;19;20;44;45, HCV17;45;46, Tuberculosis47 SIV48. Lack of control of viral replication by specific-CD8 T cells has been explained by a skewed differentiation program resulting either in accumulation of immature and poorly functional effectors as shown in HIV+ subjects49–51, or in excessive differentiation and exhaustion of the effector potential, typical of active CMV52. Since E CD8+ T cells are the most readily responding primed cells, they seem the logical target for Treg inhibition. The study of Kinter et al.19 demonstrates a direct inhibitory effect of Treg on perforin+ HIV-specific CD8+ T cells which correspond to differentiated effectors. The effects of human Treg on the generation of CD8+ memory T cells, however, have not been demonstrated. Although studies in mice suggest that Treg participate in the regulation of CD8+ T cell memory, deleting Treg alone has little or transitory impact on memory T cell homeostasis, suggesting that its regulation is far more complex29;53;54. A recent study by Sharma et al. suggested the critical role of CD25 (IL-2Rα) expression in this control55. Further evidence of the differential impact of Treg on memory and effector T cells is provided by a recent study in SIV-infected sooty mangabies. In this model, the best immunologic correlate of CD4 T cell loss (i.e. – of progressive infection) is the expansion of effector cells which was inversely correlated with the level of Treg56.
In summary, our data show Treg fine-tune the memory/effector cell balance and promote the accumulation of long-living memory cells. These effects are at least in part mediated by PD-1/PDL1 interactions. How and why this homeostatic mechanism may be perturbed in the settings of persistent viral infections warrants further investigation. It is for sure, that the simple depletion of Treg or blocking PD-1/PD-L1 interaction would not always have a positive impact on a hampered CD8+ T cell response to virus.
Acknowledgments
This work was supported by grants from SIDACTION, INSERM and ANRS. M.N. was funded by a fellowship from the French Ministry of Research. J.D.L. was funded by a fellowship from SIDACTION, MC is funded by the ANRS.
Footnotes
Contribution
MN, JDL performed the experiments, analyzed data and wrote the paper, MC performed the sorting experiments, AB analyzed data and wrote the paper, YL designed the study, analyzed data and wrote the paper
Conflict of interest
The authors declare no conflict of interest.
Reference List
- 1.Ahmed R, Gray D. Immunological memory and protective immunity: understanding their relation. Science. 1996;272:54–60. doi: 10.1126/science.272.5258.54. [DOI] [PubMed] [Google Scholar]
- 2.Hamann D, Baars PA, Rep MH, et al. Phenotypic and functional separation of memory and effector human CD8+ T cells. J Exp Med. 1997;186:1407–1418. doi: 10.1084/jem.186.9.1407. [DOI] [PMC free article] [PubMed] [Google Scholar]
- 3.Ochsenbein AF, Riddell SR, Brown M, et al. CD27 expression promotes long-term survival of functional effector-memory CD8+ cytotoxic T lymphocytes in HIV-infected patients. J Exp Med. 2004;200:1407–1417. doi: 10.1084/jem.20040717. [DOI] [PMC free article] [PubMed] [Google Scholar]
- 4.Sallusto F, Langenkamp A, Geginat J, Lanzavecchia A. Functional subsets of memory T cells identified by CCR7 expression. Curr Top Microbiol Immunol. 2000;251:167–171. doi: 10.1007/978-3-642-57276-0_21. [DOI] [PubMed] [Google Scholar]
- 5.Wherry EJ, Teichgraber V, Becker TC, et al. Lineage relationship and protective immunity of memory CD8 T cell subsets. Nat Immunol. 2003;4:225–234. doi: 10.1038/ni889. [DOI] [PubMed] [Google Scholar]
- 6.Wherry EJ, Ahmed R. Memory CD8 T-cell differentiation during viral infection. J Virol. 2004;78:5535–5545. doi: 10.1128/JVI.78.11.5535-5545.2004. [DOI] [PMC free article] [PubMed] [Google Scholar]
- 7.Gamadia LE, van Leeuwen EM, Remmerswaal EB, et al. The size and phenotype of virus-specific T cell populations is determined by repetitive antigenic stimulation and environmental cytokines. J Immunol. 2004;172:6107–6114. doi: 10.4049/jimmunol.172.10.6107. [DOI] [PubMed] [Google Scholar]
- 8.Pantaleo G, Harari A. Functional signatures in antiviral T-cell immunity for monitoring virus-associated diseases. Nat Rev Immunol. 2006;6:417–423. doi: 10.1038/nri1840. [DOI] [PubMed] [Google Scholar]
- 9.Tussey LG, Nair US, Bachinsky M, et al. Antigen burden is major determinant of human immunodeficiency virus-specific CD8+ T cell maturation state: potential implications for therapeutic immunization. J Infect Dis. 2003;187:364–374. doi: 10.1086/367707. [DOI] [PubMed] [Google Scholar]
- 10.Damoiseaux J. Regulatory T cells: back to the future. Neth J Med. 2006;64:4–9. [PubMed] [Google Scholar]
- 11.Fehervari Z, Sakaguchi S. Development and function of CD25+CD4+ regulatory T cells. Curr Opin Immunol. 2004;16:203–208. doi: 10.1016/j.coi.2004.01.004. [DOI] [PubMed] [Google Scholar]
- 12.Atabani SF, Thio CL, Divanovic S, et al. Association of CTLA4 polymorphism with regulatory T cell frequency. Eur J Immunol. 2005;35:2157–2162. doi: 10.1002/eji.200526168. [DOI] [PubMed] [Google Scholar]
- 13.Read S, Malmstrom V, Powrie F. Cytotoxic T lymphocyte-associated antigen 4 plays an essential role in the function of CD25(+)CD4(+) regulatory cells that control intestinal inflammation. J Exp Med. 2000;192:295–302. doi: 10.1084/jem.192.2.295. [DOI] [PMC free article] [PubMed] [Google Scholar]
- 14.McHugh RS, Whitters MJ, Piccirillo CA, et al. CD4(+)CD25(+) immunoregulatory T cells: gene expression analysis reveals a functional role for the glucocorticoid-induced TNF receptor. Immunity. 2002;16:311–323. doi: 10.1016/s1074-7613(02)00280-7. [DOI] [PubMed] [Google Scholar]
- 15.Aandahl EM, Michaelsson J, Moretto WJ, Hecht FM, Nixon DF. Human CD4+ CD25+ regulatory T cells control T-cell responses to human immunodeficiency virus and cytomegalovirus antigens. J Virol. 2004;78:2454–2459. doi: 10.1128/JVI.78.5.2454-2459.2004. [DOI] [PMC free article] [PubMed] [Google Scholar]
- 16.Andersson J, Boasso A, Nilsson J, et al. The prevalence of regulatory T cells in lymphoid tissue is correlated with viral load in HIV-infected patients. J Immunol. 2005;174:3143–3147. doi: 10.4049/jimmunol.174.6.3143. [DOI] [PubMed] [Google Scholar]
- 17.Boettler T, Spangenberg HC, Neumann-Haefelin C, et al. T cells with a CD4+CD25+ regulatory phenotype suppress in vitro proliferation of virus-specific CD8+ T cells during chronic hepatitis C virus infection. J Virol. 2005;79:7860–7867. doi: 10.1128/JVI.79.12.7860-7867.2005. [DOI] [PMC free article] [PubMed] [Google Scholar]
- 18.Cabrera R, Tu Z, Xu Y, et al. An immunomodulatory role for CD4(+)CD25(+) regulatory T lymphocytes in hepatitis C virus infection. Hepatology. 2004;40:1062–1071. doi: 10.1002/hep.20454. [DOI] [PubMed] [Google Scholar]
- 19.Kinter AL, Hennessey M, Bell A, et al. CD25(+)CD4(+) regulatory T cells from the peripheral blood of asymptomatic HIV-infected individuals regulate CD4(+) and CD8(+) HIV-specific T cell immune responses in vitro and are associated with favorable clinical markers of disease status. J Exp Med. 2004;200:331–343. doi: 10.1084/jem.20032069. [DOI] [PMC free article] [PubMed] [Google Scholar]
- 20.Weiss L, Donkova-Petrini V, Caccavelli L, et al. Human immunodeficiency virus- driven expansion of CD4+CD25+ regulatory T cells, which suppress HIV-specific CD4 T-cell responses in HIV-infected patients. Blood. 2004;104:3249–3256. doi: 10.1182/blood-2004-01-0365. [DOI] [PubMed] [Google Scholar]
- 21.Day CL, Kaufmann DE, Kiepiela P, et al. PD-1 expression on HIV-specific T cells is associated with T-cell exhaustion and disease progression. Nature. 2006;443:350–354. doi: 10.1038/nature05115. [DOI] [PubMed] [Google Scholar]
- 22.Petrovas C, Casazza JP, Brenchley JM, et al. PD-1 is a regulator of virus-specific CD8+ T cell survival in HIV infection. J Exp Med. 2006;203:2281–2292. doi: 10.1084/jem.20061496. [DOI] [PMC free article] [PubMed] [Google Scholar]
- 23.Trautmann L, Janbazian L, Chomont N, et al. Upregulation of PD-1 expression on HIV-specific CD8+ T cells leads to reversible immune dysfunction. Nat Med. 2006;12:1198–1202. doi: 10.1038/nm1482. [DOI] [PubMed] [Google Scholar]
- 24.Nikolova MH, Muhtarova MN, Taskov HB, et al. The CD160+ CD8high cytotoxic T cell subset correlates with response to HAART in HIV-1+ patients. Cell Immunol. 2005;237:96–105. doi: 10.1016/j.cellimm.2005.01.012. [DOI] [PubMed] [Google Scholar]
- 25.Anumanthan A, Bensussan A, Boumsell L, et al. Cloning of BY55, a novel Ig superfamily member expressed on NK cells, CTL, and intestinal intraepithelial lymphocytes. J Immunol. 1998;161:2780–2790. [PubMed] [Google Scholar]
- 26.Willinger T, Freeman T, Hasegawa H, McMichael AJ, Callan MF. Molecular signatures distinguish human central memory from effector memory CD8 T cell subsets. J Immunol. 2005;175:5895–5903. doi: 10.4049/jimmunol.175.9.5895. [DOI] [PubMed] [Google Scholar]
- 27.Tomiyama H, Matsuda T, Takiguchi M. Differentiation of human CD8(+) T cells from a memory to memory/effector phenotype. J Immunol. 2002;168:5538–5550. doi: 10.4049/jimmunol.168.11.5538. [DOI] [PubMed] [Google Scholar]
- 28.Hendriks J, Xiao Y, Borst J. CD27 promotes survival of activated T cells and complements CD28 in generation and establishment of the effector T cell pool. J Exp Med. 2003;198:1369–1380. doi: 10.1084/jem.20030916. [DOI] [PMC free article] [PubMed] [Google Scholar]
- 29.Suvas S, Kumaraguru U, Pack CD, Lee S, Rouse BT. CD4+CD25+ T cells regulate virus-specific primary and memory CD8+ T cell responses. J Exp Med. 2003;198:889–901. doi: 10.1084/jem.20030171. [DOI] [PMC free article] [PubMed] [Google Scholar]
- 30.Betts MR, Brenchley JM, Price DA, et al. Sensitive and viable identification of antigen-specific CD8+ T cells by a flow cytometric assay for degranulation. J Immunol Methods. 2003;281:65–78. doi: 10.1016/s0022-1759(03)00265-5. [DOI] [PubMed] [Google Scholar]
- 31.Rey J, Giustiniani J, Mallet F, et al. The co-expression of 2B4 (CD244) and CD160 delineates a subpopulation of human CD8+ T cells with a potent CD160-mediated cytolytic effector function. Eur J Immunol. 2006;36:2359–2366. doi: 10.1002/eji.200635935. [DOI] [PubMed] [Google Scholar]
- 32.Bensussan A, Gluckman E, el MS, et al. BY55 monoclonal antibody delineates within human cord blood and bone marrow lymphocytes distinct cell subsets mediating cytotoxic activity. Proc Natl Acad Sci USA. 1994;91:9136–9140. doi: 10.1073/pnas.91.19.9136. [DOI] [PMC free article] [PubMed] [Google Scholar]
- 33.Longhi MS, Hussain MJ, Mitry RR, et al. Functional study of CD4+CD25+ regulatory T cells in health and autoimmune hepatitis. J Immunol. 2006;176:4484–4491. doi: 10.4049/jimmunol.176.7.4484. [DOI] [PubMed] [Google Scholar]
- 34.Maier H, Isogawa M, Freeman GJ, Chisari FV. PD-1:PD-L1 interactions contribute to the functional suppression of virus-specific CD8+ T lymphocytes in the liver. J Immunol. 2007;178:2714–2720. doi: 10.4049/jimmunol.178.5.2714. [DOI] [PubMed] [Google Scholar]
- 35.Freeman GJ, Long AJ, Iwai Y, et al. Engagement of the PD-1 immunoinhibitory receptor by a novel B7 family member leads to negative regulation of lymphocyte activation. J Exp Med. 2000;192:1027–1034. doi: 10.1084/jem.192.7.1027. [DOI] [PMC free article] [PubMed] [Google Scholar]
- 36.Barber DL, Wherry EJ, Masopust D, et al. Restoring function in exhausted CD8 T cells during chronic viral infection. Nature. 2006;439:682–687. doi: 10.1038/nature04444. [DOI] [PubMed] [Google Scholar]
- 37.Yamazaki T, Akiba H, Iwai H, et al. Expression of programmed death 1 ligands by murine T cells and APC. J Immunol. 2002;169:5538–5545. doi: 10.4049/jimmunol.169.10.5538. [DOI] [PubMed] [Google Scholar]
- 38.Hara M, Kingsley CI, Niimi M, et al. IL-10 is required for regulatory T cells to mediate tolerance to alloantigens in vivo. J Immunol. 2001;166:3789–3796. doi: 10.4049/jimmunol.166.6.3789. [DOI] [PubMed] [Google Scholar]
- 39.Kingsley CI, Karim M, Bushell AR, Wood KJ. CD25+CD4+ regulatory T cells prevent graft rejection: CTLA-4- and IL-10-dependent immunoregulation of alloresponses. J Immunol. 2002;168:1080–1086. doi: 10.4049/jimmunol.168.3.1080. [DOI] [PubMed] [Google Scholar]
- 40.Powrie F, Carlino J, Leach MW, Mauze S, Coffman RL. A critical role for transforming growth factor-beta but not interleukin 4 in the suppression of T helper type 1-mediated colitis by CD45RB(low) CD4+ T cells. J Exp Med. 1996;183:2669–2674. doi: 10.1084/jem.183.6.2669. [DOI] [PMC free article] [PubMed] [Google Scholar]
- 41.Camara NO, Sebille F, Lechler RI. Human CD4+CD25+ regulatory cells have marked and sustained effects on CD8+ T cell activation. Eur J Immunol. 2003;33:3473–3483. doi: 10.1002/eji.200323966. [DOI] [PubMed] [Google Scholar]
- 42.Shimizu J, Yamazaki S, Takahashi T, Ishida Y, Sakaguchi S. Stimulation of CD25(+)CD4(+) regulatory T cells through GITR breaks immunological self-tolerance. Nat Immunol. 2002;3:135–142. doi: 10.1038/ni759. [DOI] [PubMed] [Google Scholar]
- 43.Mills KH. Regulatory T cells: friend or foe in immunity to infection? Nat Rev Immunol. 2004;4:841–855. doi: 10.1038/nri1485. [DOI] [PubMed] [Google Scholar]
- 44.Lin CY, Tsai MC, Huang CT, et al. Liver injury is associated with enhanced regulatory T-cell activity in patients with chronic hepatitis B. J Viral Hepat. 2007;14:503–511. doi: 10.1111/j.1365-2893.2006.00835.x. [DOI] [PubMed] [Google Scholar]
- 45.Manigold T, Racanelli V. T-cell regulation by CD4 regulatory T cells during hepatitis B and C virus infections: facts and controversies. Lancet Infect Dis. 2007;7:804–813. doi: 10.1016/S1473-3099(07)70289-X. [DOI] [PubMed] [Google Scholar]
- 46.Neumann-Haefelin C, Spangenberg HC, Blum HE, Thimme R. Host and viral factors contributing to CD8+ T cell failure in hepatitis C virus infection. World J Gastroenterol. 2007;13:4839–4847. doi: 10.3748/wjg.v13.i36.4839. [DOI] [PMC free article] [PubMed] [Google Scholar]
- 47.Li L, Lao SH, Wu CY. Increased frequency of CD4(+)CD25(high) Treg cells inhibit BCG-specific induction of IFN-gamma by CD4(+) T cells from TB patients. Tuberculosis (Edinb) 2007;87:526–534. doi: 10.1016/j.tube.2007.07.004. [DOI] [PubMed] [Google Scholar]
- 48.Estes JD, Li Q, Reynolds MR, et al. Premature induction of an immunosuppressive regulatory T cell response during acute simian immunodeficiency virus infection. J Infect Dis. 2006;193:703–750. doi: 10.1086/500368. [DOI] [PubMed] [Google Scholar]
- 49.Kostense S, Ogg GS, Manting EH, et al. High viral burden in the presence of major HIV-specific CD8(+) T cell expansions: evidence for impaired CTL effector function. Eur J Immunol. 2001;31:677–686. doi: 10.1002/1521-4141(200103)31:3<677::aid-immu677>3.0.co;2-m. [DOI] [PubMed] [Google Scholar]
- 50.Champagne P, Ogg GS, King AS, et al. Skewed maturation of memory HIV-specific CD8 T lymphocytes. Nature. 2001;410:106–111. doi: 10.1038/35065118. [DOI] [PubMed] [Google Scholar]
- 51.Appay V, Nixon DF, Donahoe SM, et al. HIV-specific CD8(+) T cells produce antiviral cytokines but are impaired in cytolytic function. J Exp Med. 2000;192:63–75. doi: 10.1084/jem.192.1.63. [DOI] [PMC free article] [PubMed] [Google Scholar]
- 52.Sacre K, Carcelain G, Cassoux N, et al. Repertoire, diversity, and differentiation of specific CD8 T cells are associated with immune protection against human cytomegalovirus disease. J Exp Med. 2005;201:1999–2010. doi: 10.1084/jem.20042408. [DOI] [PMC free article] [PubMed] [Google Scholar]
- 53.Hernandez J, Ko A, Sherman LA. CTLA-4 blockade enhances the CTL responses to the p53 self-tumor antigen. J Immunol. 2001;166:3908–3914. doi: 10.4049/jimmunol.166.6.3908. [DOI] [PubMed] [Google Scholar]
- 54.Cohen AD, Diab A, Perales MA, et al. Agonist anti-GITR antibody enhances vaccine-induced CD8(+) T-cell responses and tumor immunity. Cancer Res. 2006;66:4904–4912. doi: 10.1158/0008-5472.CAN-05-2813. [DOI] [PMC free article] [PubMed] [Google Scholar]
- 55.Sharma R, Zheng L, Deshmukh US, et al. A regulatory T cell-dependent novel function of CD25 (IL-2Ralpha) controlling memory CD8(+) T cell homeostasis. J Immunol. 2007;178:1251–1255. doi: 10.4049/jimmunol.178.3.1251. [DOI] [PubMed] [Google Scholar]
- 56.Sumpter B, Dunham R, Gordon S, et al. Correlates of preserved CD4(+) T cell homeostasis during natural, nonpathogenic simian immunodeficiency virus infection of sooty mangabeys: implications for AIDS pathogenesis. J Immunol. 2007;178:1680–1691. doi: 10.4049/jimmunol.178.3.1680. [DOI] [PubMed] [Google Scholar]