

Abstract
A central issue in genome-wide association (GWA) studies is assessing statistical significance while adjusting for multiple hypothesis testing. An equally important question is the statistical efficiency of the GWA design as compared to the traditional sequential approach in which genome-wide linkage analysis is followed by region-wise association mapping. Nevertheless, GWA is becoming more popular due in part to cost efficiency: commercially available 1M chips are nearly as inexpensive as a custom-designed 10K chip. It is becoming apparent, however, that most of the on-going GWA studies with 2,000~5,000 samples are in fact underpowered. As a means to improve power, we emphasize the importance of utilizing prior information such as results of previous linkage studies via a stratified false discovery rate (FDR) control. The essence of the stratified FDR control is to prioritize the genome and maintain power to interrogate candidate regions within the GWA study. These candidate regions can be defined as, but are by no means limited to, linkage-peak regions. Furthermore, we theoretically unify the stratified FDR approach and the weighted p-value method, and we show that stratified FDR can be formulated as a robust version of weighted FDR. Finally, we demonstrate the utility of the methods in two GWA datasets: Type 2 Diabetes (FUSION) and an on-going study of long-term diabetic complications (DCCT/EDIC). The methods are implemented as a user-friendly software package, SFDR. The same stratification framework can be readily applied to other type of studies, for example, using GWA results to improve the power of sequencing data analyses.
Keywords: genome-wide association, genome-wide linkage, statistical power, prior information, false discovery rate
INTRODUCTION
Even though current genome-wide association (GWA) studies use sample sizes considerably larger than past genetic studies, it is evident that the power of a GWA study as large as 2000 cases and controls can remain low [e.g. The Wellcome Trust Case Control Consortium (WTCCC), 2007; Manolio et al., 2008; Rodriguez-Murillo and Greenberg, 2008; Tenesa et al., 2008]. Besides sample size, low power may result from small genetic effects, as anticipated for susceptibility loci associated with complex traits/diseases (e.g. odds ratios of 1.1~1.5) [Ioannidis et al., 2006; WTCCC, 2007; Manolio et al., 2008]. Most of all, simultaneous investigation of several hundred thousands of single nucleotide polymorphisms (SNPs) requires very strict criteria to properly adjust for multiple hypothesis testing [e.g. WTCCC, 2007; Dudbridge and Gusnanto, 2008].
To improve the power of GWA, several studies have adopted meta-analysis approaches to combine data from multiple sources [e.g. Scott et al., 2007; Tenesa et al., 2008; Zeggini et al., 2008]. Alternatively, a number of studies have investigated the benefits of utilizing available prior information. The information considered in these studies includes biological knowledge of SNPs and genes [Thomson et al., 2004; Sun et al., 2006; Chen and Witte, 2007; Li et al., 2008], features of different genotyping technologies and platforms [Greenwood et al., 2007], results of previous studies of related measures and populations [Pe'er et al., 2006; Roeder et al., 2006], or the union of different types of prior information [Chen and Witte, 2007]. The proposed methods often adopt the false discovery rate (FDR) methodology, because FDR control allows for a more sensible balance between type I error rate and power for large-scale hypothesis testing compared to the traditional control of family-wise error rate [Benjamini and Hochberg, 1995; Storey, 2002]. However, the relative merits of different methods remain unknown.
In this article, we unify and compare the stratified FDR (SFDR) [Sun et al., 2006] and the weighted FDR (WFDR) [Genovese et al., 2006] control methods; both of which have been shown to improve the power of GWA studies and can be easily implemented. The SFDR method has been evaluated using either multiple phenotypes or the minor allele frequency as the prior information [Sun et al., 2006], as well as using the genotyping technology [Greenwood et al., 2007] or candidate gene information [Huang et al., 2007; Li et al., 2008], while WFDR has used genome-wide linkage (GWL) results [Roeder et al., 2006]. Here, we focus on GWL data as the available prior information. Other prior types are possible, but GWL results are commonly available for many traits/diseases of interest from previous family studies. Most importantly, this allows us to illustrate the practical value of taking advantage of complementary linkage and association information and combining all available data generated from these studies. We show, via theoretical arguments, simulation studies and data applications, that the agnostic approach to the genome implied by the GWA study design might not be the optimal one. In the era of GWA it is both feasible and beneficial to prioritize the genome using methods such as SFDR and WFDR to exploit other available information.
We also demonstrate the trade-off between power and robustness by theoretical, simulation, and application studies. Robustness is desirable to safeguard against potentially uninformative or even misleading prior information due to, e.g. low power of GWL, ascertainment and phenotypic differences between GWL and GWA, or population heterogeneity. We find that WFDR loses power when the prior information consists of random noise and the power loss can be considerable if the prior is in fact misleading. In contrast, SFDR is robust to both uninformative and misleading priors. When the prior is indeed informative, both methods improve power, with marginally better performance for WFDR.
METHODS
FDR, SFDR AND WFDR CONTROL
Let Pi be the p-value of an association test for SNP i, i=1,…,m. FDR control can be achieved by converting the p-values to the corresponding q-values [Storey, 2002] (q-value calculation provided in the Appendix). SNPs with q-values less than the FDR threshold value (e.g. γ= 0.05) are declared significant. The expected proportion of false positives among all the positives is then controlled at the γ level.
Let Zi be the linkage score of SNP i obtained from a previous GWL study using either allele-sharing or parametric approaches. For the SFDR method, m SNPs are divided into K disjoint strata based on the prior linkage information. Without loss of generality, consider K = 2 and assign each SNP i to stratum 1 (the high priority group) or stratum 2 (the low priority group) according to whether the linkage score Zi exceeds a threshold C (e.g. C=1.64, equivalent to a one-sided linkage p-value of 0.05, for Z, a normally distributed NPL score). FDR control is then applied separately in each stratum at the same γ level [Sun et al., 2006].
In contrast, WFDR calculates a weighting factor Wi for each SNP i with weights subject to two constraints: Wi ≥ 0 and W̄ = Σi Wi/m = 1. The weight Wi is proportional to the linkage signal Zi for SNP i (e.g. Wi = exp(B·Zi)/v, v=Σi exp(B·Zi/m)and B=1 [Roeder et al., 2006], and the FDR procedure is applied to the set of weight-adjusted p-values, Pi/Wi, i=1,…,m. This continuous weighting scheme can be converted to a binary one (e.g. a fraction ε of SNPs with weight W1=B/(Bε+1-ε) and the remaining SNPs with weight W0=1/(Bε+1-ε)) [Roeder et al., 2006], but we focus on the continuous SNP-specific weight recommended by Roeder et al. [2006] for quantitative prior GWL data.
UNIFICATION OF SFDR AND WFDR
The SFDR and WFDR approaches model the prior distinctively. WFDR uses the SNP-specific linkage score to adjust the original association p-value at each SNP, while SFDR dichotomizes the linkage results and assigns each SNP to one of the two strata according to the chosen threshold. To better understand the differences as well as the similarities between the methods, we show that SFDR can be formulated as a robust version of WFDR, and that SFDR control of K strata of SNPs, each at the same FDR level of γ, is equivalent to WFDR control applied to Pi/Wi*. However, the new weighting factor Wi* is no longer determined in a single-point fashion (i.e. SNP-specific) nor externally (i.e. solely based on the prior). Instead, all tests in the same stratum k have the same weight, for SNP i in stratum k. We show in the Appendix that , where and m(1), …m(K) are the stratum sizes (i.e. the number of tests), and , α(1),…,α(K) are the critical values (for the unadjusted association p-values) that control FDR at the γ level for the K strata. In stratum k, , where is the proportion of the null SNPs/noise, and is the average power to detect the truly associated SNPs/signals each at the α(k) level. Note that this stratum-specific weight is implicitly determined by the characteristics of a family of tests and is driven by two FDR-relevant parameters, i.e. and . Because these two parameters are features of the current data, the corresponding weights depend on both the prior information (i.e. the linkage results used to define the strata) and the current data (i.e. the association results used to evaluate the patterns of the observed p-values in a stratum).
In practice, to calculate the stratum-specific weight for SFDR, one must estimate for each stratum k. We estimate π0 using the well known estimator, and λ=0.5. And we estimate by , where R(k) is the number of rejections/positives, and the numerator is the expected number of true positives and the denominator is the estimated total number of alternatives in stratum k. Thus, and , where .
SIMULATIONS
SIMULATION STUDY DESIGN
We first generated data using the same simulation models as in Roeder et al. [2006]. GWA association p-values were simulated for 500,000 independent SNPs under a normal model, i.e. p-values of null SNPs were derived from N(0,1) following the Unif(0,1) distribution, and p-values of causal SNPs from N(μa, 1) where μa varied between 4.0 and 6.0 quantifying different levels of power to detect the association, and μa is a function of both the GWA study sample size and the genetic effect size of a causal variant. The number of truly associated SNPs, m1, was 10 and these were randomly placed on 10 different chromosomes for each simulation replicate. Nonparametric GWL scan signals (NPL scores) were simulated under a Gaussian autoregressive moving average model (ARMA (2,1) with parameters ar1 = 1.51, ar2=−0.51, and ma1=0.22) [Bacanu, 2005]. This model was shown to adequately capture the features of actual linkage traces without the computationally intensive simulation of the original genotype data via gene dropping methods (details in Appendix A of Roeder et al. [2006]). For the informative GWL, the average linkage signal strength at the same causal SNPs as in the GWA simulation was set to a mean value μl =1, 2.5 or 3.5, and the average linkage signal strength at a non-causal locus was determined from the correlation value (ρ) generated from the ARMA model as ρ·μl. For the uninformative GWL, the average linkage signal strength was set to μl =0. Then 100 GWL scans were generated for each of 10 GWA studies, specifying C=1.64 for SFDR and B=1 for WFDR. FDR was controlled at γ=0.05. Power was measured by 1-NDR (1- non-discovery rate) defined as the ratio of the number of true positives divided by m1 [Craiu and Sun, 2008], averaged over 100×10=1000 replicates for each simulation scenario. For SFDR, the same γ=0.05 was used for both strata, and power was calculated as the overall power summarizing both strata.
We then investigated additional simulation models. We considered a different threshold value for SFDR, C=1.96, and allowed for more than 10 truly associated SNPs in the genome, setting m1=100. The 100 causal SNPs were randomly placed in 100 independent chromosomal regions, and the rest of the GWA and GWL data simulations were as described above. We also considered a different type of uninformative linkage data in which m1 randomly selected SNPs (possibly differing from the ones chosen in the GWA simulation) were given positive linkage signals (μl =1, 2.5 or 3.5) representing misleading GWL results. This consideration was mainly motivated by potential inaccurate prior information due to population heterogeneity, for example, or phenotypic differences between GWL and GWA. In addition, we generated data with different ARMA parameter values (ar1 = 1.45, ar2=−0.51, and ma1=0.22) allowing for a faster decay of the linkage scores away from a linkage peak location.
POWER AND ROBUSTNESS OF SFDR AND WFDR
Roeder et al. [2006] concluded via simulations that WFDR improves the power of GWA when the linkage scan is informative but decreases power otherwise. Following the same set of models as described above, we replicated their WFDR results and compared them to those of SFDR (Figure 1).
Figure 1. Power of FDR (black solid), SFDR (blue dot-dashed) and WFDR (red dotted) under different linkage and association conditions.
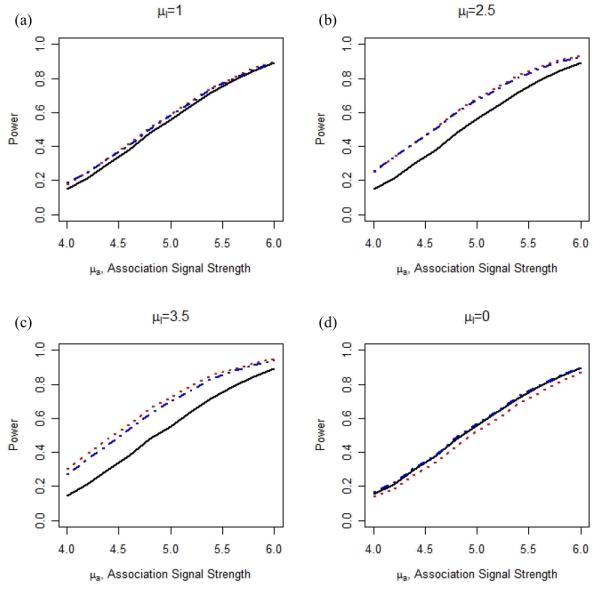
GWA association p-values were simulated for 500,000 independent SNPs among which 10 are true causal ones with association signal strength varying from μa=4.0 to 6.0. FDR was controlled at 0.05, and power = (number of true positives/10) averaged over 1,000 simulated replicates. Figures (a)-(c) show power of the methods when the prior linkage scans are informative with mean NPL scores at the 10 causal loci set at μl=1, 2.5 and 3.5 respectively and Figure (d) shows uninformative prior μl=0. C=1.64 for SFDR and B=1 for WFDR.
Figures 1 (a)-(c) confirm that power increases when the prior GWL scan is informative (the average Z is μl=1, 2.5 or 3.5 at a causal SNP and ρ·μl at a null SNP) and the increase is, as expected, proportional to the informativeness of the linkage signal. Remarkably, under the informative condition, the performance of the two methods is rather similar despite their distinctive use of the prior information. However, when the prior is not informative (the average Z equals 0 for all SNPs), differences between the methods are observed. Unlike WFDR, SFDR is robust to misspecification of the prior and retains power when the linkage results are random (Figure 1(d)).
Furthermore, when we consider the scenario that the prior is misleading, we observe that SFDR remains robust while WFDR can lose power substantially (Figure 2). Similar results are obtained under the additional simulation models considered (Figures S1-S6). The choice of the SFDR threshold value, C=1.64 or 1.96, can noticeably affect the performance in some cases. As expected, a larger C value is preferred when the prior is highly informative (e.g. μl =3.5 in Figure S1 (c)) because it increases the proportion of truly associated SNPs in the high-priority stratum. This is consistent with the observation made by Roeder et al. [2006] that a higher B value can further increase the power of WFDR when the prior provides more precise information about the locations of the associated variants.
Figure 2. Power of FDR (black solid), SFDR (C=1.64 blue dot-dashed) and WFDR (red dotted) when 10 causal loci generated independently for linkage and association data.
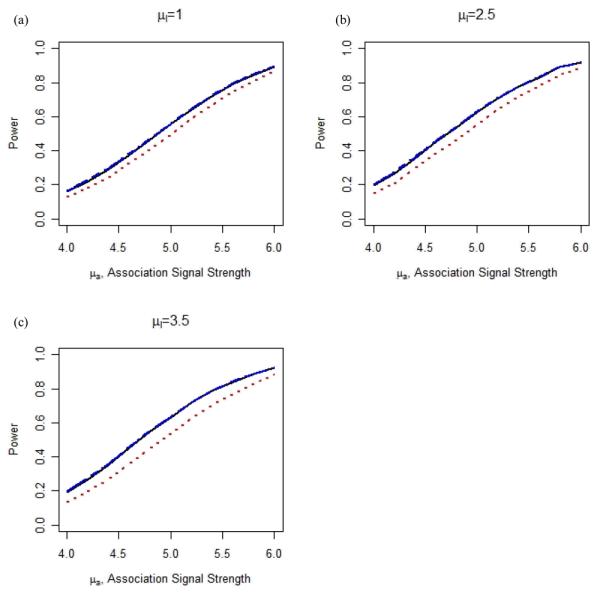
Figures (a)-(c) show power of the methods when the prior linkage scans provide misleading information at 10 independently chosen loci with μl=1, 2.5 and 3.5 respectively. For other details see Figure 1.
EMPIRICAL DISTRIBUTION OF THE WEIGHTING FACTORS FOR SFDR AND WFDR
When linkage scans are uninformative, the SNP-specific weight calculated in WFDR (W~exp(Z)) for a causal SNP can deviate substantially from 1 (Figure 3), and 69% of the simulated replicates have weight below 1 (Table S3). In contrast, the corresponding weighting factors inferred from the SFDR approach center around 1 with considerably less variation (Figure 3 and Table S3).
Figure 3. Empirical distributions of weights obtained from SFDR and WFDR at causal loci when linkage scans are uninformative.

100 datasets were simulated, each with 100 causal SNPs with association signal strength μa=4.0 and linkage μl=0. The distributions of weights at all causal loci in all simulated datasets (10,000 observations in total) are shown.
Figure 4 illustrates the distribution of weights over a chromosomal region including 3 causal loci from one dataset simulated with uninformative linkage data. For SFDR the weights are approximately 1 across the region, whereas for WFDR the weights fluctuate considerably depending on the observed NPL scores at the loci. As a result, some of the null SNPs are up-weighted (i.e. 12% of the replicates have an WFDR weight above 2 for a null SNP) and the second and third causal SNPs are down-weighted (i.e. 42% of the replicates have an WFDR weight below 0.5 for a causal SNP) leading to inefficiency and power loss (see Figure S7 for an example of informative linkage data).
Figure 4. An example of weights obtained from SFDR and WFDR when the linkage scan is uninformative.

The linkage results in the form of NPL scores (top), corresponding weights (middle) and association p-values (bottom, dots for the original association p-values and triangles for the weight adjusted association p-values) are shown for (a) SFDR and (b) WFDR in a chromosomal region from one simulated dataset with mean association signal strength μa=4.0 and linkage μl=0. Stratum specific weights for SFDR were calculated using C=1.64 and FDR controlled at 0.05, and B=1 was used for the WFDR weight calculation. Arrows indicate the location of the causal SNPs.
APPLICATIONS
To demonstrate practical relevance, we applied SFDR and WFDR to two GWA studies including the Finland-United States Investigation of NIDDM Genetics (FUSION) study of Type 2 Diabetes (T2D) [Scott et al., 2007] and the on-going Diabetes Control and Complications Trial/Epidemiology of Diabetes Interventions and Complications study (DCCT/EDIC) of diabetes-related retinal and renal phenotypes [Al-Kateb et al., 2008].
FUSION T2D GWA Study
For the FUSION Stage 1 GWA study by Scott et al. [2007], the previous FUSION GWL scan by Silander et al. [2004] served as the prior information. The FUSION Stage 1 GWA study included 1,161 T2D cases and 1,174 normal glucose tolerant controls. All samples were genotyped on the Illumina HumanHap300 BeadChip (v1.1). The 10 T2D SNPs reported in Table 1 of Scott et al. [2007] were confirmed by a powerful meta-analysis (14,586 cases and 17,968 controls). The p-values of the FUSION Stage 1 association analyses of 306,284 autosomal SNPs were computed by logistic regression with additive SNP coding. We downloaded them from NCBI dbGaP (phs000100.v1.p1). Among the 10 T2D SNPs listed in Table 1 of Scott et al. [2007], 5 are imputed SNPs (rs4402960, rs7754840, rs10811661, rs1801282, rs5219) and were not available from dbGaP. Therefore, we added the Stage 1 association p-values and the base-pair positions of these 5 SNPs obtained from Table 1 of Scott et al. [2007] to the dbGaP FUSION Stage 1 GWA data.
Table 1.
Comparison of the FDR ranks of the ten confirmed T2D SNPs reported in FUSION GWA study (FUSION stage 1 p-values) with the ranks using the SFDR and WFDR methods incorporating both real and simulated prior GWL scans
| No Prior Information |
Fusion Linkage |
Simulated Linkage |
|||||||
|---|---|---|---|---|---|---|---|---|---|
| SNP | Chr. | P-value | Rank | Rank | Null | μl=1 | μl=2 | μl=3 | |
| rs7903146 | 10 | 1.25E-05 | 4 | SFDR | 1 | 13 | 9 | 1 | 1 |
| WFDR | 4 | 7 | 3 | 2 | 1 | ||||
|
|
|||||||||
| rs9300039 | 11 | 5.99E-05 | 19 | SFDR | 19 | 25 | 21 | 6 | 6 |
| WFDR | 21 | 36 | 16 | 9 | 7 | ||||
|
|
|||||||||
| rs4402960 | 3 | 1.20E-04 | 50 | SFDR | 50 | 57 | 53 | 12 | 12 |
| WFDR | 50 | 77 | 35 | 17 | 12 | ||||
|
|
|||||||||
| rs13266634 | 8 | 0.001 | 418 | SFDR | 439 | 420 | 424 | 390 | 93 |
| WFDR | 297 | 602 | 273 | 123 | 71 | ||||
|
|
|||||||||
| rs1801282 | 3 | 0.0011 | 530 | SFDR | 497 | 416 | 416 | 387 | 89 |
| WFDR | 471 | 619 | 289 | 138 | 72 | ||||
|
|
|||||||||
| rs5219 | 11 | 0.0022 | 902 | SFDR | 902 | 909 | 902 | 902 | 902 |
| WFDR | 1048 | 1169 | 566 | 266 | 160 | ||||
|
|
|||||||||
| rs7754840 | 6 | 0.021 | 6740 | SFDR | 6572 | 6843 | 6870 | 6634 | 6442 |
| WFDR | 7252 | 11388 | 6375 | 4012 | 2840 | ||||
|
|
|||||||||
| rs1111875 | 10 | 0.039 | 12593 | SFDR | 12196 | 12843 | 12570 | 12081 | 11361 |
| WFDR | 14374 | 20600 | 9008 | 4407 | 2263 | ||||
|
|
|||||||||
| rs10811661 | 9 | 0.082 | 26338 | SFDR | 24947 | 26480 | 26484 | 26799 | 30880 |
| WFDR | 33467 | 43820 | 18201 | 9180 | 4608 | ||||
|
|
|||||||||
| rs8050136 | 16 | 0.578 | 178670 | SFDR | 275498 | 178662 | 178114 | 182293 | 237108 |
| WFDR | 113281 | 183640 | 111687 | 57309 | 30430 | ||||
306,289 GWA autosomal SNPs were investigated. The Fusion linkage LOD scores from Silander et al. [2004] were used as the real prior GWL scan, and C=0.5 and B=1 were used for SFDR and WFDR respectively. The simulated linkage data mimic the allele-sharing NPL scores, C=1.64 and B=1 were used for SFDR and WFDR respectively, and the median ranks across 1,000 simulated linkage scans were reported.
The FUSION GWL analysis [Silander et al., 2004] included 1,709 affected subjects in 737 families (FUSION 1 and 2 samples), with samples genotyped at 408 microsatellite markers for FUSION 1 and 392 for FUSION 2 (34 markers in common). The combined linkage LOD scores were based on the likelihood-based allele-sharing method [Kong and Cox, 1997], and the genome-wide marker-specific numerical results were kindly provided by Dr. Boehnke and his colleagues. The maximum LOD score was 2.98 on chromosome 11, and LOD scores at the 10 T2D loci ranged from 0.0 to 0.73 with an average of 0.27.
The corresponding linkage score for each of the 306,289 SNPs (306,284 dbGaP SNPs + 5 imputed SNPs) was interpolated from the flanking linkage markers. (See Supporting Information for details of the interpolation method.) WFDR was performed with B=1, and SFDR was performed with C=0.5. A LOD score value of 0.5 is approximately 1.5 on the NPL score scale and was chosen because of the relatively small sample size of the GWL study.
The 10 confirmed T2D loci had FUSION Stage 1 association p-values ranging from 1.25×10⁻⁵ to 0.578 and ranks from 4 to 178,670 (Table 1), but none met significant q-value criteria (Table S1). Using the GWL scan data [Silander et al., 2004], SFDR ranked the 4th SNP as number one and WFDR gave the 418th SNP an improved rank of 297 (Table 1). The lack of substantial overall improvement may be due to low power of either the FUSION GWL scan, or the original GWA study or both.
To uncouple the two contributing factors, we also simulated GWL scans with various levels of informativeness at these 10 loci. The method of generating simulated GWL NPL scores was the same as in the simulation studies above, with mean linkage signal values varying from μl=0 (uninformative linkage) to 1, 2 or 3 (informative linkage) at each of the 10 T2D loci, using ARMA (2,1) with parameters ar1 = 1.51, ar2=−0.51, and ma1=0.22. We simulated 1,000 linkage datasets for each μl considered, and we applied SFDR (C=1.64 for the simulated NPL scores) and WFDR (B=1) to the FUSION stage 1 GWA p-values incorporating the linkage results from each of the simulated GWL scans. The ranks reported in Table 1 are the median ranks of the 10 T2D SNPs over the 1,000 simulated GWL scans. Ranks were obtained according to the SFDR and WFDR q-values and the original association p-values were used to break any ties among the q-values. The q-values reported in the Table S1 are the mean values averaged over the 1,000 replicates.
When the simulated prior GWL scan is truly informative, both SFDR and WFDR increase the chance of finding the top 5 associated SNPs, with comparable performance. However, none of the remaining 5 SNPs achieve top 100-ranking even when the prior is highly informative, due to their extreme low power in the GWA study. Notably, the performance of WFDR in improving the rank of a true SNP is superior to SFDR when confirmed loci from the original GWA study have large association p-values, e.g. rs8050136 with stage 1 p-value=0.578. However, when the prior is truly uninformative (column 7 of Table 1), WFDR tends to give the 10 T2D SNPs considerably worse ranks compared to those obtained without the prior, indicating power loss, while SFDR largely does not change the ranks reflecting its robustness to prior misspecification.
DCCT/EDIC RETINOPATHY GWA STUDY
Samples from the on-going DCCT/EDIC GWA study of long-term diabetic complications which includes 1,304 white probands were genotyped by the Illumina 1M BeadArray assay. SNPs that passed quality control criteria (MAF >1%, HWE > 10−6, and not significantly associated with gender) were analyzed for association with time-to-event phenotypes for several retinal and renal outcomes. We report on the severe retinopathy phenotype defined as severe non-proliferative diabetic retinopathy or scatter laser treatment. The time to event was modelled by the Cox proportional hazards regression for each SNP with an additive genotype coding. We analysed 841,347 autosomal SNPs for the SFDR and WFDR applications.
Prior GWL scan data were provided by a linkage study of diabetic retinopathy in the Pima Indians (607 siblings from 211 families) [Looker et al., 2007]. Genome-wide LOD scores were obtained with the variance component method [Amos et al., 1996], using 516 autosomal microsatellite markers, and the phenotype was the grade score of the worse eye retinal photograph adjusted for age and sex. The genome-wide marker-specific numerical results were kindly provided by Dr. Hanson and his colleagues. The maximum multipoint LOD score was 2.59 on chromosome 1. The corresponding linkage LOD score for each of the 841,347 GWA SNPs was interpolated from the flanking GWL markers in the same fashion as the FUSION study. SFDR was performed using a LOD score threshold value C=0.5 and WFDR with B=1.
Table 2 lists the 12 SNP with SFDR q-values ≤ 0.1; these SNPs are all from stratum 1. (See Table S2 for a list of SNPs that are among the top 20 by any of the FDR, SFDR and WFDR methods.) The original FDR q-values without linkage stratification are considerably larger and none of the WFDR q-values is smaller than 0.1. SFDR and WFDR give similarly improved rankings to the SNPs on chromosome 1, but the remaining SNPs from chromosomes 15 and 18 are given higher priority by SFDR than WFDR. A replication study of these SNPs is in progress.
Table 2.
Comparison of ranks and q-values of the top 12 SNPS (based on SFDR) of the DCCT/EDIC GWA study of diabetic retinopathy, using the SFDR and WFDR methods incorporating the GWL results of Looker et al. [2007]
| Rank |
q-value |
||||||||
|---|---|---|---|---|---|---|---|---|---|
| SNP | Chr. | Position (bp) | p-value | FDR | SFDR | WFDR | FDR | SFDR | WFDR |
| rs918837 | 18 | 49666395 | 4.67E-06 | 4 | 1 | 7 | 0.64 | 0.07 | 0.31 |
| rs2744772 | 1 | 25935243 | 7.30E-06 | 9 | 2 | 1 | 0.66 | 0.07 | 0.31 |
| rs2744768 | 1 | 25929896 | 8.71E-06 | 11 | 3 | 2 | 0.66 | 0.07 | 0.31 |
| rs4777949 | 15 | 92110772 | 1.14E-05 | 13 | 4 | 20 | 0.69 | 0.07 | 0.32 |
| rs4238481 | 15 | 92110385 | 1.18E-05 | 14 | 5 | 21 | 0.69 | 0.07 | 0.32 |
| rs2065970 | 1 | 25924110 | 1.25E-05 | 15 | 6 | 4 | 0.69 | 0.07 | 0.31 |
| rs807263 | 1 | 25970937 | 1.59E-05 | 17 | 7 | 5 | 0.76 | 0.07 | 0.31 |
| rs2786873 | 1 | 25913549 | 1.67E-05 | 18 | 8 | 6 | 0.76 | 0.07 | 0.31 |
| rs12439760 | 15 | 92123817 | 1.73E-05 | 19 | 9 | 23 | 0.76 | 0.07 | 0.42 |
| rs2246979 | 1 | 25937873 | 2.87E-05 | 25 | 10 | 10 | 0.81 | 0.09 | 0.31 |
| rs4777700 | 15 | 92118937 | 2.92E-05 | 27 | 11 | 27 | 0.81 | 0.09 | 0.60 |
| rs2744761 | 1 | 25913101 | 3.31E-05 | 31 | 12 | 11 | 0.81 | 0.10 | 0.31 |
841,346 GWA autosomal SNPs were investigated. The LOD scores from Looker et al. [2007] were used as the prior GWL scan, and C=0.5 and B=1 were used for SFDR and WFDR respectively. The SNPs reported here are the 12 SNPs with SFDR q-values ≤ 0.1.
DISCUSSION
In this study, we theoretically unify two distinctive approaches, stratified and weighted FDR control, proposed to improve power of genome-wide association studies via incorporating available prior information. We show that the SFDR approach can be formulated as a robust version of the WFDR method, and the corresponding stratum-specific weight is implicitly determined by two FDR-relevant features for a family of tests: the proportion of true associations and the average power to detect them. The WFDR method is equivalent to using a different significance threshold for each test, while SFDR adjusts the threshold for a family/stratum of tests.
Specifying a common within-stratum weighting factor, as in SFDR, provides robustness. When the prior is not informative, SNPs are effectively randomly assigned to different strata leading to similar characteristics across strata, i.e. and . As a result, the α(k) that satisfies the equation, , would be the same for all strata subject to sampling variation. Therefore α(k) = α and ᾱ = α, and the stratum-specific weight is data-driven to be W(k) = α(k) / ᾱ = 1 for all K strata. In contrast, the observed prior linkage NPL/LOD score Z from a single dataset is not necessarily zero when the prior is not informative (although the expected linkage score Z equals zero at any given locus, the NPL/LOD scores from a GWL scan simulated under the null of no linkage fluctuate around zero across the genome given finite sample size). Thus, the SNP-specific weight calculated in WFDR, W ~ exp(Z), can deviate substantially from 1 leading to inefficiency and power loss.
When the prior provides misleading information (e.g. a linkage peak is expected to appear at a locus many cM away from the true underlying location due to for example phenotypic or population differences between GWL and GWA data), WFDR gives high weight to a null SNP but not to a truly associated SNP. In contrast, in SFDR, if the high prior stratum fails to contain the majority of truly associated variants due to the misleading nature of the linkage results, those true positives will be captured by the other stratum which now may have a higher proportion of true associations than the overall value, leading to a higher weight for the low prior stratum. This highlights a robustness feature of SFDR that is absent from WFDR in which the externally assigned weights are independent of the relationship between the prior information and the current data.
In their work, Roeder et al. [2006] also considered binary weights, i.e. a fraction ε of SNPs with weights W1=B/(Bε+1−ε) and the remaining SNPs with weights W0=1/(Bε+1−ε), where B=2, 6 or 50. However, they concluded that the continuous weighting scheme is more suitable for GWL prior data because the linkage statistics are correlated between markers. Therefore, the performance of WFDR with binary weights remains to be determined for genome-wide genetic data. Nevertheless, it is not difficult to see that the binary weights proposed by Roeder et al. [2006] do not provide robustness to WFDR, because W1>1 (as long as B >1) regardless of the prior information. The simulation studies confirm our theoretical argument and show that only SFDR is robust to both uninformative and misleading prior information.
It is also important to note that there are cases when WFDR is superior to SFDR, as demonstrated in the application to the FUSION dataset (Table 1). When causal loci have large association p-values in the original GWA study (e.g. p-value=0.578 for rs8050136 in FUSION stage 1), the fact that such SNPs belong to the high-priority stratum may not change their statistical evidence significantly, because the stratum typically also contains many null SNPs some of which are expected to have small p-values by chance. (Realistic prior never unambiguously separates all the nulls from the alternatives. Otherwise, the prior alone has 100% testing power.) The stratum-specific weight could be greater than 1 but it will be applied to all SNPs in that stratum, and SFDR does not change the original rank order of significance within a stratum. Thus, a test/SNP with p-value around 0.5 would remain mid-ranked in a stratum based on SFDR. In contrast, WFDR could decrease the p-value of a single SNP if the corresponding SNP-specific weight is high. This observation indicates some of the limitations of our simulation studies. Compared to the FUSION stage 1 GWA study where 6 of the 10 confirmed T2D loci had p-values >10−3, the power of the simulated GWA studies was considerably higher: the median p-value of a causal SNP with μa=4 is of the order of 10−5 (10−9 for μa=6). Another possible limitation is the independence assumption made for the simulated GWA SNPs, although correlation was modeled for the linkage simulation component.
In general, the WFDR method is less applicable than SFDR due to the need for SNP-specific prior information. For example, in the case of using GWL results as the prior in the WFDR setting, the precise linkage result (e.g. LOD or NPL score) must be obtained or estimated for each SNP to up- or down-weight the corresponding association p-value. In contrast, to apply the SFDR method, one only needs to know if the linkage result of a SNP is above or below a threshold value. Other types of prior information, such as knowledge about SNPs, genes, phenotypes or platforms could be also used to stratify and prioritize the SNPs but are not so straightforward to apply using WFDR with continuous weights. Although Roeder et al. [2006] argued in favor of continuous weights for GWL prior data because of the correlation between linked markers, a binary weighting scheme of WFDR could be considered for those situations. As discussed above, however, the binary option does not provide robustness to WFDR.
In some cases, the readily available prior information may be so limited that even the SFDR method is not directly applicable. For example, the most commonly reported results for GWL studies are the peak LOD scores, the chromosomal location of such peaks and possibly the locations of the markers flanking the 1-LOD-unit down support intervals. In an affected-sib-pair design in which only the peak NPL/LOD scores are available, one could consider estimating the size of the intervals for stratification using the equation, , where d is the distance in cM between locus τ and locus t, and LODτ and LODt are the LOD scores at a peak and a nearby locus t. (See Appendix for details of the derivation.) We applied this method to the FUSION study for which the published numerical GWL results are available for peak regions only (Table 4 of Silander et al. [2004]), and we compared the estimated results to the original GWL data provided by Dr. Boehnke and his colleagues. Figure S8 shows the original GW linkage trace (black solid) and the estimated one (red dashed). Among the 306,289 GWA SNPs, 276,392 have both an observed and estimated LOD < 0.5, and 17,413 have both LOD ≥ 0.5. However, 6,526 had an observed LOD ≥ 0.5 but an estimated LOD < 0.5, and 5,958 had an observed LOD < 0.5 but and estimated LOD ≥ 0.5. Table S4 contrasts the SFDR application results using the observed linkage results with those from the estimated intervals. Although the proposed method provides rough estimation, further improvement is needed and acquisition of the original linkage results remains beneficial.
Ideally, maximal power improvement could be achieved by choosing optimal SFDR threshold(s) and WFDR weighting function(s). However, how to accomplish this is still an open question. For the weighted approach, a two-stage design has been suggested to obtain optimum group-specific weights in the context of family-wise error rate control [Roeder et al., 2007]. A related question is how to optimally combine a set of available priors, e.g. GWL results from various linkage studies of the same phenotype, results from both GWL and candidate gene studies, and information such as the heterozygosity of the linkage markers, in addition to the minor allele frequency and genotyping quality score of the GWA SNPs.
GWA studies have produced an avalanche of data, and the results of previous genome-wide linkage scans seem to be mostly relegated to the waste bin. Although few GWL studies produced significant results at the strict genome-wide level, the chance of a region with modest linkage evidence harboring susceptibility loci is more than random. Moreover, although the GWA study design allows us to interrogate common variation across the whole genome, its agnostic nature means that by design only a very small proportion of the SNPs are expected to be truly associated among all SNPs genotyped and tested (e.g. the estimated proportion based on the GWA p-values is <3% for FUSION stage 1 and <2% for DCCT/EDIC). This signal sparsity feature is detrimental from the multiple hypothesis testing point of view, and as a result it is extremely difficult to separate the wheat from the chaff unless the genetic effect of the causal variant and/or the sample size of the study are very large. The SFDR and WFDR methods provide simple ways to combine all available data, and SFDR in particular allows us to prioritize specific parts of the genome within the analysis of GWA data, while maintaining robustness to both uninformative and misleading prior information. The applications to the FUSION and DCCT/EDIC data show that previous GWL studies were not a waste of time and can provide information that improves the power of current GWA studies. However, our work also demonstrates that both GWL and GWA studies must be reasonably powered in the first place, so that the combined analysis achieves a meaningful gain in efficiency. The same SFDR and WFDR framework can be easily applied to other types of studies. For example, results of current GWL and GWA studies could be utilized as the available prior information to improve the power of statistical analyses of the impending sequencing data.
SOFTWARE
A user-friendly software package, SFDR, tailored for genome-wide association and linkage data is available at http://www.utstat.toronto.edu/sun/. SFDR implements the false discovery rate, stratified false discovery rate and weighted false discovery rate control methods and computes the corresponding ranks and q-values.
Supplementary Material
ACKNOWLEDGMENTS
This research was supported by research grants from Canadian Institute of Health Research (CIHR), Natural Sciences and Engineering Research Council of Canada (NSERC) and the US National Institutes of Health (NIH). S.B.B. received support from a CIHR Senior Investigator Award. A.D.P. received support from NIH and holds a Canada Research Chair in the Genetics of Complex Diseases. L.S. received support from CIHR, NSERC and NIH.
The authors sincerely thank Dr. Boehnke and Dr. Hanson and their colleagues for providing the application GWL datasets, and Dr. Roeder and Dr. Bacanu for providing their simulation program. The authors gratefully acknowledge Dr. Boehnke and two anonymous reviewers for their helpful comments and suggestions.
The content of this article is solely the responsibility of the authors and does not necessarily represent the official views of the National Institute of Diabetes and Digestive and Kidney Diseases or the National Institutes of Health
APPENDIX
DERIVATION OF STRATUM-SPECIFIC WEIGHTING FACTOR FOR SFDR
Controlling the FDR at level γ is equivalent to calling all tests with q-values ≤γ significant. The estimates of the q-values can be obtained by the use of the following recursive formula
where P(1) ≤…≤ P(m) is the ordered sequence of the m available p-values, q̂(m) = π̂0P(m), and π̂0 is an estimate of π0 = m0/m , the proportion of null hypotheses among the total tested.
The weighted p-value method [Genovese et al., 2006] applies the FDR control procedure to a set of weight adjusted p-values, where Wi is the weighting factor for test i with two constraints: Wi ≥ 0 and W̄ = ΣiWi/m = 1. To achieve FDR control at the nominal γ level, one could re-estimate the q-values corresponding to and reject all hypothesis tests with q-values ≤γ. Alternatively, one could declare a test significant if its weighted but otherwise unadjusted p-value, , where α satisfies the following equation [Sun et al., 2006]:
Here , the average (single-hypothesis) power to detect the m1 alternatives, each at the α level.
In the context of SFDR, the set/family of p-values are assigned to K disjoint strata/groups depending on the prior Z for the corresponding hypotheses. The FDR procedure is then applied separately to p-values in each stratum at the same γ level. The expression of α(k) for the kth stratum is identical to the above equation with the addition of superscript (k) for π0 and . That is, rejecting tests/SNPs with Pi ≤ α(k) controls FDR at the γ level in stratum k, where Pi is the unadjusted p-value of SNP i that was assigned to stratum k, and
To make a connection between SFDR and WFDR, note that with the following re-parameterization, α(k) = W(k) ᾱ, Pi is equivalent to Pi / W(k) ≤ ᾱ, a weighted p-value approach. Since α(k) = W(k) ᾱ must hold for all k=1,…,K with the constraint , one can solve the set of equations and obtain
Therefore, the original SFDR method can be formulated as WFDR control by re-scaling the p-values with the above weight, i.e.
where if test i belongs to stratum k.
ESTIMATION OF STRATA FOR SFDR USING LOD SCORES AT PEAK REGIONS ONLY
Under a set of reasonable assumptions (e.g. the affected sib-pair, ASP, design), we show that
where d is the distance in cM between locus τ and locus t, and is the expected square root of the LOD score at a peak (assumed to be the disease locus) and LODt is the LOD score at locus t. The derivation of the above equation requires 3 steps.
Step 1 specifies the relationship between IBD sharing at two different loci. Under the assumption of random mating, linkage equilibrium, no more than one susceptibility gene in the region of interest and generalized single ascertainment, Liang et al. [2001] derived a simple representation relating the expected IBD sharing at any position, t, to the sharing at the disease locus, τ , and the distance between t and τ:
where f(θt,τ,ASP) is a function that depends on the recombination fraction between t and τ and the relationship type of the two individuals. Assuming the no-interference model (Haldane's map function) and the ASP design,
where dt,τ is the genetic distance between t and τ in cM. Thus,
.
Note that the coefficient will be different for designs other than the ASP design, but the derivation requires no assumptions about the mode of inheritance, except that the region contains no more than one susceptibility gene. (See Biernacka et al. [2005] for two linked genes.) Since genetic distance in cM is additive, assuming t1 < t2 < τ, it is not difficult to show that
However, similar results cannot be obtained for t1 < τ < t2.
Step 2 specifies the relationship between the expected IBD sharing and the expected NPL score. Assuming that the GWL analysis was conducted using n ASPs, the NPL score at a locus t can be calculated as
where is the observed or inferred IBD sharing statistic for the ith ASP at locus t. The expected NPL score is
Step 3 specifies the relationship between the NPL score and the LOD score. Assuming the LOD score was calculated based on the likelihood ratio test with 1 d.f., the NPL is approximately normally distributed, and the score test and likelihood ratio test yield similar results. Then
Therefore, LOD ~ NPL2 /(2ln10).
Putting everything together, we obtain
Based on this result, LODτ = 3 and LODt = 2 leads to d ≈ 5cM, and LODτ = 3 and LODt = 0.5 leads to d ≈ 22cM . Note that the derivation provides the expected values. This leads to a “sharper” LOD curve. Therefore dt,τ typically underestimates the actual distances observed in GWL studies with finite sample size. In addition, the derivation does not take into account the edge effect (i.e. when the peak is at or close to the telomeres or centromere of a chromosome).
REFERENCES
- Al-Kateb H, Boright AP, Mirea L, Xie X, Sutradhar R, Mowjoodi A, Bharaj B, et al. Multiple superoxide dismutase 1/splicing factor serine alanine 15 variants are associated with the development and progression of diabetic nephropathy: the Diabetes Control and Complications Trial/Epidemiology of Diabetes Interventions and Complications Genetics study. Diabetes. 2008;57:218–28. doi: 10.2337/db07-1059. [DOI] [PMC free article] [PubMed] [Google Scholar]
- Amos CI, Zhu DK, Boerwinkle E. Assessing genetic linkage and association with robust components of variance approaches. Ann Hum Genet. 1996;60:143–160. doi: 10.1111/j.1469-1809.1996.tb01184.x. [DOI] [PubMed] [Google Scholar]
- Bacanu SA. Robust estimation of critical values for genome scans to detect linkage. Genet Epidemiol. 2005;28:24–32. doi: 10.1002/gepi.20030. [DOI] [PubMed] [Google Scholar]
- Benjamini Y, Hochberg Y. Controlling the false discovery rate: a practical and powerful approach to multiple testing. J R Stat Soc B. 1995;57:289–300. [Google Scholar]
- Biernacka J, Sun L, Bull SB. Simultaneous localization of two linked disease susceptibility genes. Genet Epidemiol. 2005;28:33–47. doi: 10.1002/gepi.20033. [DOI] [PubMed] [Google Scholar]
- Chen GK, Witte JS. Enriching the analysis of genomewide association studies with hierarchical modeling. Am J Hum Genet. 2007;81:397–403. doi: 10.1086/519794. [DOI] [PMC free article] [PubMed] [Google Scholar]
- Concannon P, Erlich HA, Julier C, Morahan G, Nerup J, Pociot F, Todd JA, Rich SS, the Type 1 Diabetes Genetics Consortium Evidence for susceptibility loci from four genome-wide linkage scans in 1,435 multiplex families. Diabetes. 2005;54:2995–3001. doi: 10.2337/diabetes.54.10.2995. [DOI] [PubMed] [Google Scholar]
- Craiu RV, Sun L. Choosing the lesser evil: trade-off between false discovery rate and non-discovery rate. Statistica Sinica. 2008;18:861–879. [Google Scholar]
- Dudbridge F, Gusnanto A. Estimation of significance thresholds for genomewide association scans. Genet Epidemiol. 2008;32:227–234. doi: 10.1002/gepi.20297. [DOI] [PMC free article] [PubMed] [Google Scholar]
- Genovese CR, Roeder K, Wasserman L. False discovery control with p-value weighting. Biometrika. 2006;93:509–24. [Google Scholar]
- Greenwood C, Rangrej J, Sun L. Optimal selection of markers for validation or replication from genome-wide association studies. Genet Epidemiol. 2007;31:396–407. doi: 10.1002/gepi.20220. [DOI] [PubMed] [Google Scholar]
- Huang B, Rangreg J, Paterson AD, Sun L. The multiplicity problem in linkage analysis of gene expression data - the power of differentiating cis- and trans-acting regulators. BMC Proceedings. 2007;1:S142. doi: 10.1186/1753-6561-1-s1-s142. [DOI] [PMC free article] [PubMed] [Google Scholar]
- Ioannidis JP, Trikalinos TA, Khoury MJ. Implications of small effect sizes of individual genetic variants on the design and interpretation of genetic association studies of complex diseases. Am J Epidemiol. 2006;164:609–614. doi: 10.1093/aje/kwj259. [DOI] [PubMed] [Google Scholar]
- Manolio TA, Brooks LD, Collins FS. A HapMap harvest of insights into the genetics of common disease. J Clin Invest. 2008;118:1590–1605. doi: 10.1172/JCI34772. [DOI] [PMC free article] [PubMed] [Google Scholar]
- Kong A, Cox N. Allele-sharing models: LOD scores and accurate linkage tests. Am J Hum Genet. 1997;61:1179–1188. doi: 10.1086/301592. [DOI] [PMC free article] [PubMed] [Google Scholar]
- NCBI dbGap http://www.ncbi.nlm.nih.gov/sites/entrez?Db=gap.
- Li C, Li M, Lange EM, Watanabe RM. Prioritized subset analysis: Improving power in genome-wide association analysis. Hum Hered. 2008;65:129–141. doi: 10.1159/000109730. [DOI] [PMC free article] [PubMed] [Google Scholar]
- Liang KY, Chiu YF, Beaty TH. A robust identity-by-descent procedure using affected sib-pairs: multipoint mapping for complex diseases. Hum Hered. 2001;51:64–78. doi: 10.1159/000022961. [DOI] [PubMed] [Google Scholar]
- Looker HC, Nelson RG, Chew E, Klein R, Klein BEK, Knowler WC, Hanson RL. Genome-wide linkage analyses to identify loci for diabetic retinopathy. Diabetes. 2007;56:1160–1166. doi: 10.2337/db06-1299. [DOI] [PubMed] [Google Scholar]
- Pe'er I, de Bakker PW, Maller J, Yelensky R, Altshuler D, Daly MJ. Evaluating and improving power in whole-genome association studies using fixed marker sets. Nat Genet. 2006;38:663–667. doi: 10.1038/ng1816. [DOI] [PubMed] [Google Scholar]
- Rodriguez-Murillo L, Greenberg DA. Genetic association analysis: a primer on how it works, its strengths and its weaknesses. Int J Androl. 2008;31:546–556. doi: 10.1111/j.1365-2605.2008.00896.x. [DOI] [PubMed] [Google Scholar]
- Roeder K, Bacanu SA, Wasserman L, Devlin B. Using linkage genome scans to improve power of association in genome scans. Am J Hum Genet. 2006;78:243–252. doi: 10.1086/500026. [DOI] [PMC free article] [PubMed] [Google Scholar]
- Roeder K, Devlin B, Wasserman L. Improving power in genome-wide association studies: Weights tip the scale. Genet Epidemiol. 2007;31:741–747. doi: 10.1002/gepi.20237. [DOI] [PubMed] [Google Scholar]
- Scott LJ, Mohlke K, Bonnycastle L, Willer CJ, Li Y, Duren WL, Erdos MR, et al. A Genome-wide association study of type 2 diabetes in Finns detects multiple susceptibility variants. Science. 2007;316:1341–1345. doi: 10.1126/science.1142382. [DOI] [PMC free article] [PubMed] [Google Scholar]
- Silander K, Scott LJ, Valle TT, Mohlke KL, Stringham HM, Wiles KR, Duren WL, et al. A large set of Finnish affected sibling pair families with type 2 diabetes suggests susceptibility loci on chromosomes 6, 11, and 14. Diabetes. 2004;53:821–829. doi: 10.2337/diabetes.53.3.821. [DOI] [PubMed] [Google Scholar]
- Storey JD. A direct approach to false discovery rates. J R Stat Soc B. 2002;64:479–498. [Google Scholar]
- Sun L, Craiu RV, Paterson AD, Bull SB. Stratified false discovery control for large-scale hypothesis testing with application to genome-wide association studies. Genet Epidemiol. 2006;30:519–530. doi: 10.1002/gepi.20164. [DOI] [PubMed] [Google Scholar]
- Tenesa A, Farrington SM, Prendergast JGD, Porteous ME, Walker M, Haq N, Barnetson RA, et al. Genome-wide association scan identifies a colorectal cancer susceptibility locus on 11q23 and replicates risk loci at 8q24 and 18q21. Nat Genet. 2008;40:631–637. doi: 10.1038/ng.133. [DOI] [PMC free article] [PubMed] [Google Scholar]
- Thomson D, Witte JS, Slattery M, Goldgar D. Increased power for case-control studies of single nucleotide polymorphisms through incorporation of family history and genetic constraints. Genet Epidemiol. 2004;27:215–224. doi: 10.1002/gepi.20018. [DOI] [PubMed] [Google Scholar]
- Todd JA, Walker NM, Cooper JD, Smyth DJ, Downes K, Plagnol V, Bailey R, et al. Robust associations of four new chromosome regions from genome-wide analyses of type 1 diabetes. Nat Genet. 2007;39:857–864. doi: 10.1038/ng2068. [DOI] [PMC free article] [PubMed] [Google Scholar]
- The Wellcome Trust Case Control Consortium Genome-wide association study of 14,000 cases of seven common diseases and 3,000 controls. Nature. 2007;447:661–678. doi: 10.1038/nature05911. [DOI] [PMC free article] [PubMed] [Google Scholar]
- Zeggini E, Scott LJ, Saxena R, Voight BF, Marchini JL, Hu T, de Bakker PIW, et al. Meta-analysis of genome-wide association data and large-scale replication identifies additional susceptibility loci for type 2 diabetes. Nat Genet. 2008;40:638–645. doi: 10.1038/ng.120. [DOI] [PMC free article] [PubMed] [Google Scholar]
Associated Data
This section collects any data citations, data availability statements, or supplementary materials included in this article.