Abstract
In 131I SPECT, image quality and quantification accuracy are degraded by object scatter as well as scatter and penetration in the collimator. The characterization of energy and spatial distributions of scatter and penetration performed in this study by Monte Carlo simulation will be useful for the development and evaluation of techniques that compensate for such events in 131I imaging.
Methods
First, to test the accuracy of the Monte Carlo model, simulated and measured data were compared for both a point source and a phantom. Next, simulations to investigate scatter and penetration were performed for four geometries: point source in air, point source in a water-filled cylinder, hot sphere in a cylinder filled with nonradioactive water, and hot sphere in a cylinder filled with radioactive water. Energy spectra were separated according to order of scatter, type of interaction, and γ-ray emission energy. A preliminary evaluation of the triple-energy window (TEW) scatter correction method was performed.
Results
The accuracy of the Monte Carlo model was verified by the good agreement between measured and simulated energy spectra and radial point spread functions. For a point source in air, simulations show that 73% of events in the photopeak window had either scattered in or penetrated the collimator, indicating the significance of collimator interactions. For a point source in a water-filled phantom, the separated energy spectra showed that a 20% photopeak window can be used to eliminate events that scatter more than two times in the phantom. For the hot sphere phantoms, it was shown that in the photopeak region the spectrum shape of penetration events is very similar to that of primary (no scatter and no penetration) events. For the hot sphere regions of interest, the percentage difference between true scatter counts and the TEW estimate of scatter counts was <12%.
Conclusion
In 131I SPECT, object scatter as well as collimator scatter and penetration are significant. The TEW method provides a reasonable correction for scatter, but the similarity between the 364-keV primary and penetration energy spectra makes it difficult to compensate for these penetration events using techniques that are based on spectral analysis.
Keywords: scatter correction, penetration, 131I imaging, SPECT, Monte Carlo simulated data
Quantification of 131I for internal dosimetry has gained renewed interest because of the recent success of radioimmunothempy in treating B-cell non-Hodgkin’s lymphoma (1–4). 131I quantification is performed both by conjugate view imaging (5–8) and by SPECT (9,10). The latter method is preferred for imaging tumors in the presence of significant activity in overlying tissue and for separating large, unresolved tumors into individual ones. Quantification is more difficult for 131I than for common nuclear medicine isotopes such as 99mTc because of the higher energy of the photopeak (364 keV) and the multiple γ-ray emissions. The four highest intensity emissions of 131I are 284 (6.1%), 364 (82%), 637 (7.2%), and 723 keV (1.8%) (11). The 637- and 723-keV photons are low in intensity but contribute significantly to the image because, compared with the 364-keV photons, they have relatively low attenuation in the patient and a higher probability of penetrating the collimators that are optimized for 364 keV. Inclusion of scattered photons in SPECT images degrades contrast, spatial resolution, and quantification. In the case of higher energy photon emitters such as 131I, both object scatter and scatter in the collimator are significant. In addition, image quality and quantification accuracy are affected by septal penetration.
Previous work assessing scatter and penetration in 131I imaging is limited. Bice et al. (12) used Monte Carlo similations to predict the fraction of scatter and penetration counts in the photopeak window when imaging 131I. In a recent study, Pollard et al. (13) compared several energy-based scatter correction methods for 131I. Although Monte Carlo characterization of scatter distributions in 99mTc SPECT has been performed (14–16), to our knowledge, such detailed studies for 131I have not been published. In this study we use Monte Carlo simulation to perform detailed characterization of energy and spatial distributions of photons that undergo scatter and septal penetration in 131I imaging. Investigation of scatter and penetration is important for the development of new techniques and evaluation of existing techniques that compensate for these events. For example, when scatter correction techniques that are based on spectral analysis such as the triple-energy window (TEW) method (17) or the spectrum-fitting method (18) are evaluated, it is necessary to study the energy spectrum shape of unscattered and scattered events. Experimental measurement of these spectra is not feasible but can be generated easily by Monte Carlo simulation because unscattered and scattered photons can be tracked separately.
The Monte Carlo code used in this work includes complete modeling of collimator interactions, which is essential when higher energy photon emitters are simulated. First, the accuracy of the code is validated by comparison of simulated and measured energy spectra and point spread functions (PSFs) for a point source in air and for a phantom. Next, a detailed investigation of 131I scatter and penetration is performed by simulation of point source and phantom geometries. On the basis of the energy distribution of scattered photons, the performance of the TEW scatter correction method currently used in the clinic is evaluated.
MATERIALS AND METHODS
Monte Carlo Code
In this work we use the SIMIND Monte Carlo code (19,20), which is well established for SPECT with low-energy photons. Because of the interest in simulating higher energy photon emitters such as 131I, this code was recently combined with the collimator routine that accounts for scatter and penetration (21). This collimator is restricted to a rectangular hale shape far ease of implementation. Therefore, in this work a square hole collimator in the simulation approximated the experimental hexagonal hole collimator. Previously, de Vries et al. (21) used such an approximation and showed good agreement between measured and simulated radially averaged PSFs for 99mTc, 51Cr and 85Sr. Their approximation was based on the fact that the geometric transfer function for collimators with rectangular and hexagonal holes of equal area are almost identical and that the radially averaged penetration and scatter components are expected to be independent of hole shape, although in the image the penetration tails exhibit a pattern that is dependent on hole shape. In this work the square hole approximation is justified by showing good agreement between measured and simulated energy spectra and radial PSFs for 131I. Initially, the hole size and septa were determined such that the square hole and hexagonal hole collimators have the same open area and lead content. In this case, comparison between measurement and simulation showed that simulation underestimates the penetration tails of the 131I PSF Therefore, it was necessary to reduce the septal thickness of the simulated collimator to get good agreement between measurement and simulation. The parameters of the experimental and simulated collimators are as follows: experimental, hexagonal hole diameter = 3.8 mm, septa = 1.73 mm, thickness = 58.4 mm; and simulated, square hole size = 3.54 mm, septa = 1 mm, thickness = 58.4 mm. Comparison of measured and simulated energy spectra for both a point source and a hot sphere phantom geometry further tested the validity of this empirical approximation.
In the case of 131I it is important to simulate the photons that re-enter the Nat crystal after backscattering off various structures behind the crystal such as the photomultiplier tubes and shielding. Previously, de Vries et al. (21) showed that a single slab of material (with a density of 66% of that of Pyrex [Coming, Coming, NY]) can be effective in modeling backscatter because explicit simulation of all structures is not practical. In this work, a 5-cm slab of this material was used directly below the NaI crystal to include the effect of backwater.
The SIMIND code is designed such that the parameters to be calculated in a particular simulation can be easily changed. This is achieved through a user-written scoring subroutine that is linked to the code. A call to the routine is made at different stages during a photon’s history. Several scoring routines were used to generate the images and spectra that were specific to this work.
SPECT System and Software
The SPECT system used in this study was a Prism XP3000 (Picker International, Inc., Cleveland Heights, OH) with high-energy, general-purpose, parallel hole collimators. The NaI crystal measured 24 × 40 cm and 0.95 cm in thickness. The measured energy resolution at 364 keV was 10.2% (full width at half maximum), and the system spatial resolution at 10 cm was 1.2 cm. All measurements and simulations were planar.
Measuring the energy spectra for validation was not straightforward. Standard SPECT clinic software does not allow saving the energy spectra or the generation of energy spectra corresponding to specific regions of the image because no energy information is saved with the position information for each event. However, we were able to generate x–y–energy data using the prototype Picker Prism multiwindow acquisition software that is now available in the clinic. With this software, data can be acquired simultaneously in eight nonoverlapping windows, and tallying counts in the images corresponding to each window generates the spectrum. Measured and simulated field-of-view (FOV) and region-of-interest (ROI) energy spectra were generated in the vicinity of the 364-keV photopeak because this is the critical region of the spectrum in typical acquisitions (acquisitions commonly obtained with a 20% window at 364 keV). A total of 32 adjacent windows of 5.1-keV width were used in four acquisitions to cover the energy range 283–442 keV. For the simulations, a user-written FORTRAN scoring routine was linked to SIMIND to generate the 32 image files corresponding to the 32 windows. Generating the experimental spectrum over a wide energy range that includes all 131I emissions by this method is time consuming. The total energy spectrum can be displayed on the screen but cannot be saved. Therefore, to validate the FOV energy spectrum for the range 0–800 keV, a photograph of the screen was digitized. With both multiple-window acquisitions and the digitization, the background was measured and subtracted from the source spectrum. For the energy range 283–442 keV, FOV energy spectra generated by both methods agreed.
Phantoms
The four geometries used in this study were point source in air, point source centered in a cylinder filled with nonradioactive water, hot sphere centered in a cylinder filled with nonradioactive water, and hot sphere centered in a cylinder filled with radioactive water, in which the background-to-sphere activity concentration ratio was 1:5. In all cases, the point source, sphere, and cylinder were centered with respect to the crystal and were at a distance of 19 cm from the collimator face. The sphere was 7.4 cm in diameter, whereas the cylinder was 22 cm in diameter and 21 cm in height. The phantom with background activity approximates a realistic imaging situation in the clinic where SPECT is performed to quantify minor uptake in abdominal or pelvic regions after 131I radioimmunotherapy. On the basis of our experience using approximate measurements on clinic patients a typical value for background-to-tumor activity concentration ratio is 1:5, although the range is large. For validation of the code, both experimental measurement and simulation were performed for the point source in air and the hot sphere in the nonradioactive cylinder. Simulations to investigate scatter and penetration were performed for all four of the geometries.
Simulations to Characterize Scatter and Penetration
Point Source in Air
To determine the significance of collimator interactions, SIMIND was used to separate the geometric, penetration, and scatter components of photopeak events for the point source in air. Geometric implies traversing the collimator hole without interaction, penetration implies penetration of one or more septa, and scatter implies scattering in the collimator lead. Separated images and radial point PSFs were generated to show the effect of collimator scatter and penetration on spatial resolution.
Point Source in Water-Filled Phantom
A simulation to separate events by order of scatter was performed for the point source in water. The events were separated according to the number of scattering interactions (incoherent and coherent) in the water to generate energy spectra in the range 283–442 keV.
Hot Sphere With and Without Background Activity
For the two hot sphere phantoms, simulations were performed to generate ROI energy spectra corresponding to primary, scatter, and penetration events. In this case primary implies no scatter in the phantom followed by geometric traversing of the collimator, scatter implies undergoing scatter in the phantom or collimator, and penetration implies penetration of the collimator septa without undergoing scatter in the phantom or collimator. ROI energy spectra were generated for the energy range 283–442 keV. The ROIs evaluated were hot sphere region, cold region, and background activity region. Events that undergo Compton scatter in the crystal were not distinguished from events that undergo photoabsorption in the crystal when the separated spectra were generated.
For the hot sphere phantom with background activity, the primary, scatter, and penetration energy spectra were further separated according to the energy of the original γ-ray emission. For the hot sphere ROI, separate energy spectra that included events corresponding to only 284-keV photons, 364-keV photons, and higher energy 637- and 723-keV photons were generated.
Scatter Correction
A preliminary assessment of the TEW scatter correction method in 131I imaging was performed by simulation. This correction method is used in the clinic for SPECT quantification of tumor activity after 131I radioimmunotherapy (22,23). The TEW method is a pixel-by-pixel correction that is easy to implement clinically because multiple-window SPECT acquisition systems are now routinely available. The scatter counts in the photopeak window are estimated from counts acquired in two adjacent narrow subwindows. Linear interpolation between the two subwindows can be used to obtain the following trapezoid approximation of the scatter counts:
| Eq. l |
where Cscatt = scattered photon counts in the photopeak window, Clow = counts in the low-energy subwindow, Chigh = counts in the high-energy subwindow, Wlow = width of the low-energy subwindow, Whigh = width of the high-energy subwindow, and Wmain = width of the photopeak window.
At each pixel the scattered photons are estimated using Equation 1 and subtracted from the total counts measured in the photopeak to obtain the unscattered photons. In this work, the method is assessed on the basis of a comparison between the trapezoid estimate of scatter counts and the counts in the simulated rise scatter spectrum in the photopeak window. In the simulation, the true scatter spectrum is obtained using a flag in the scoring subroutine to separate photons that scatter in the phantom or the collimator. As in the clinical SPECT acquisitions, the main window was set at 20% (centerline 364 keV) and the two adjacent subwindows were set at 6% (subwindow centerlines at 318 and 413 keV, respectively). The evaluation was performed for four ROIs in the two hot sphere phantoms.
RESULTS AND DISCUSSION
Monte Carlo Validation
Point Source
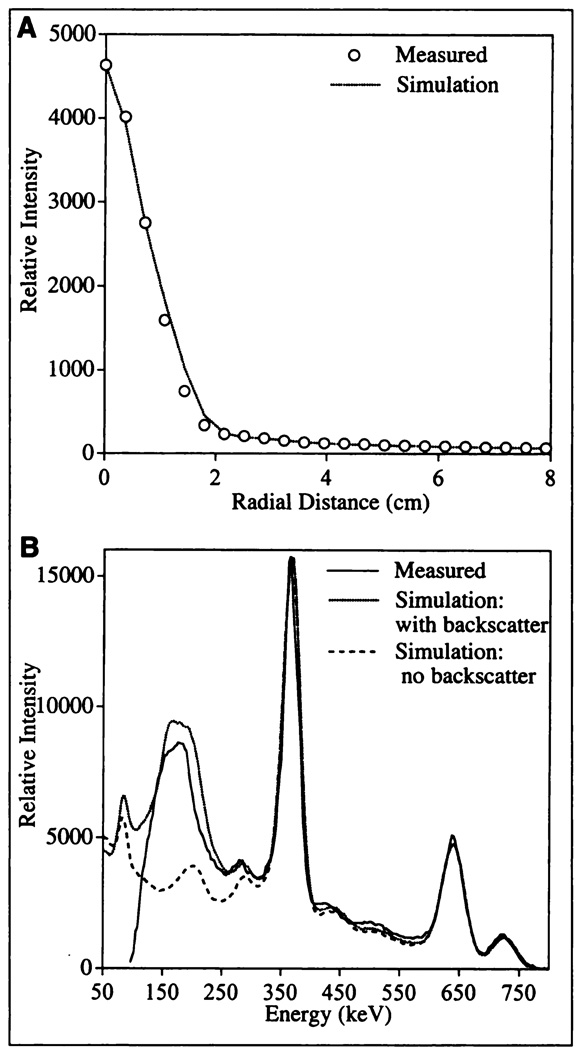
The good agreement between measured and simulated radial PSFs is illustrated in Figure 1A for the case of the 131I point source in air. The FOV energy spectra corresponding to this same source geometry are compared in Figure 1B. This figure also includes the simulated spectrum when the backscatter layer was not included in the camera model. Inclusion of the single-layer backscatter region substantially improves the agreement between measurement and simulation, although some discrepancies are to be expected because the structures behind the crystal were not modeled explicitly. Note that the sharp decrease in the measured spectrum at low energy is caused by the cutoff in camera electronics. The spectra of Figure 1B have been normalized to have the same maximum.
FIGURE 1.
Measured and simulated radial PSFs (A) and energy spectra (B) for point source in air.
Hot Sphere
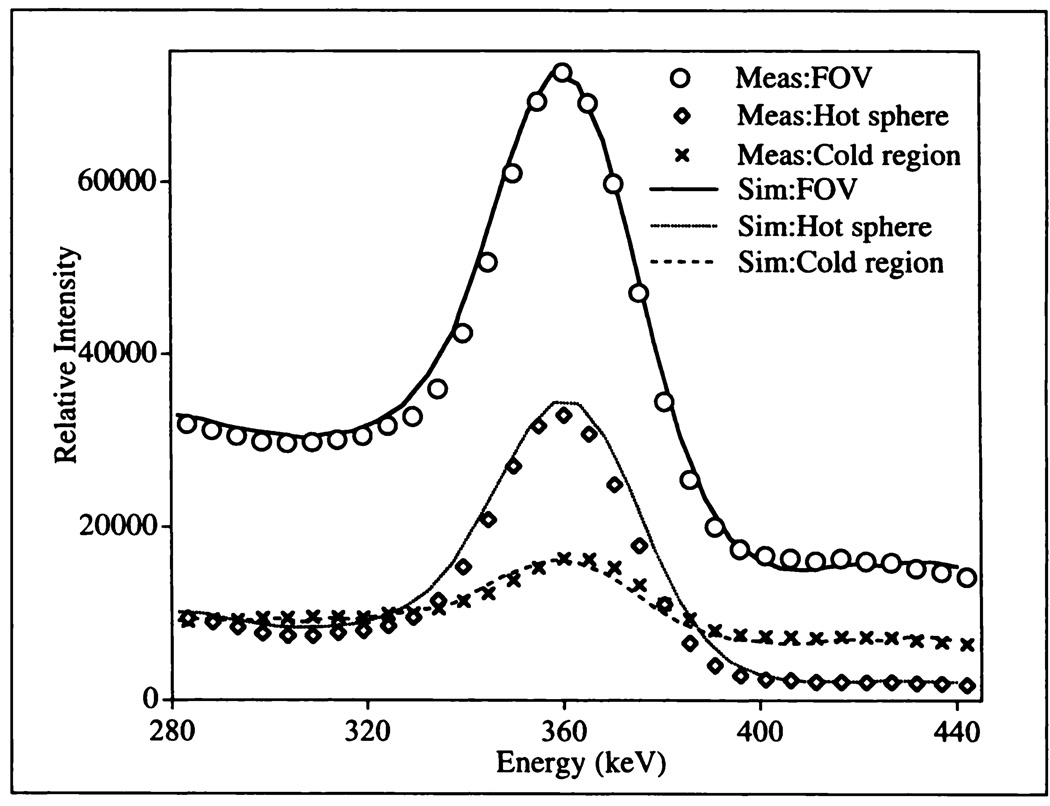
The point source validations indicate accurate modeling of collimator scatter and penetration. As a test of a case that includes object scatter, measurements and simulations were performed for an 131I hot sphere centered in a cylindric phantom filled with nonradioactive water. Total FOV and ROI energy spectra were generated by the described multiple-window acquisitions. Figure 2 compares the spectra in the vicinity of the photopeak for the entire camera FOV, the hot sphere region, and a cold region in the nonradioactive water. The plots have been normalized such that the measured and simulated FOV energy spectra have the same maximum. The excellent agreement between measurement and simulation shown in Figure 2 supports use of the code for evaluating scatter and penetration.
FIGURE 2.
Measured (Meas) and simulated (Sim) FOV and ROI energy spectra for hot sphere phantom with no background activity.
Simulation Results
Point Source in Air
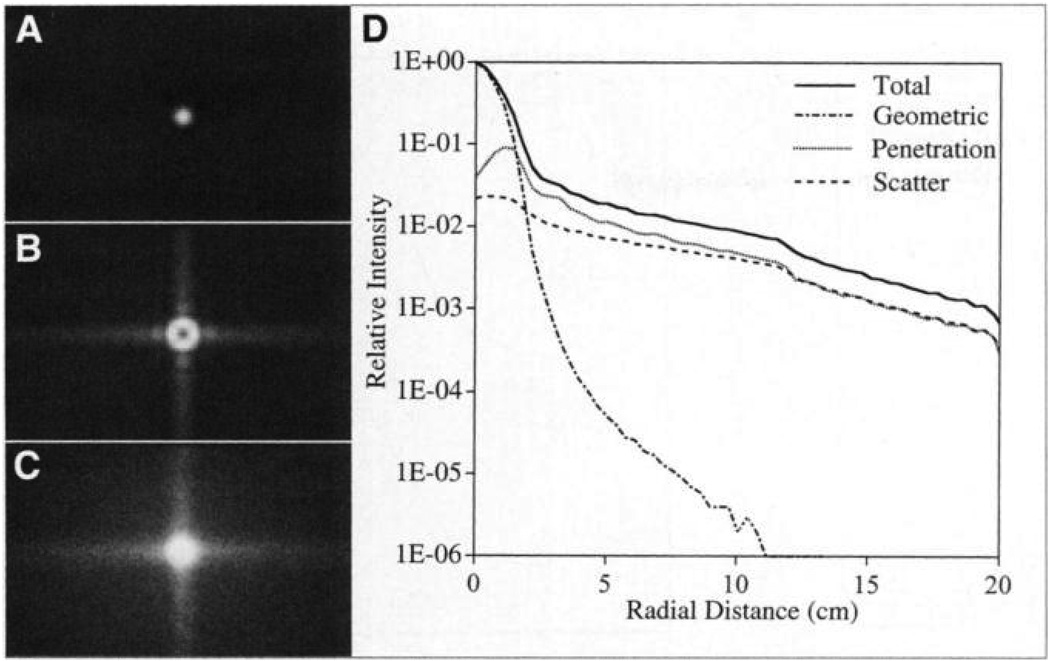
The major 131I γ-ray emissions and their geometric, penetration, and scatter contributions to the total counts within the 20% photopeak at 364 keV are shown in Table 1. The results are for the entire camera FOV. These results show that 73% of the events in the photopeak have penetrated or scattered in the collimator. This large value indicates the importance of modeling collimator interactions in 131I SPECT simulations. According to Table 1, more than 19% of photopeak events are associated with collimator penetration and scatter by the higher energy γ-ray emissions at 637 and 723 keV. This value agrees well with the findings of Bice et al. (12), who reported that for an 131I point source in air up to 20% of events in the photopeak window are from the higher energy photons. Their work did not specify the type of camera or source distance that was modeled.
TABLE 1.
Geometric, Penetration, and Scatter Components of Events Within 20% Window at 364 keV for Point Source in Air
| Energy* (keV) |
Component (%) | ||
|---|---|---|---|
| Geometric | Penetration | Scatter | |
| 364 | 26.8 | 34.8 | 17.8 |
| 637 | 0.22 | 6.4 | 8.4 |
| 723 | 0.04 | 1.8 | 2.7 |
Energy of orginal γ-ray emission.
The effect of collimator scatter and penetration on spatial resolution is illustrated by the simulated images and the corresponding radial PSFs of Figure 3. The images have been normalized to the same maximum intensity, and only events within a 20% photopeak window are included. The camera-wide tails of the 131I PSF associated with collimator scatter and penetration are clearly shown. Efforts in scatter-penetration compensation are directed toward eliminating these components of the image and retaining only the geometric component. Note that the 4-fold symmetry of the tails in Figure 3 is associated with the square hole collimator used in the simulation.
FIGURE 3.
Geometric (A) penetration (B), and scatter (C) components of image and components of radial PSF (D) for point source in air simulation.
Point Source in Water-Filled Phantom
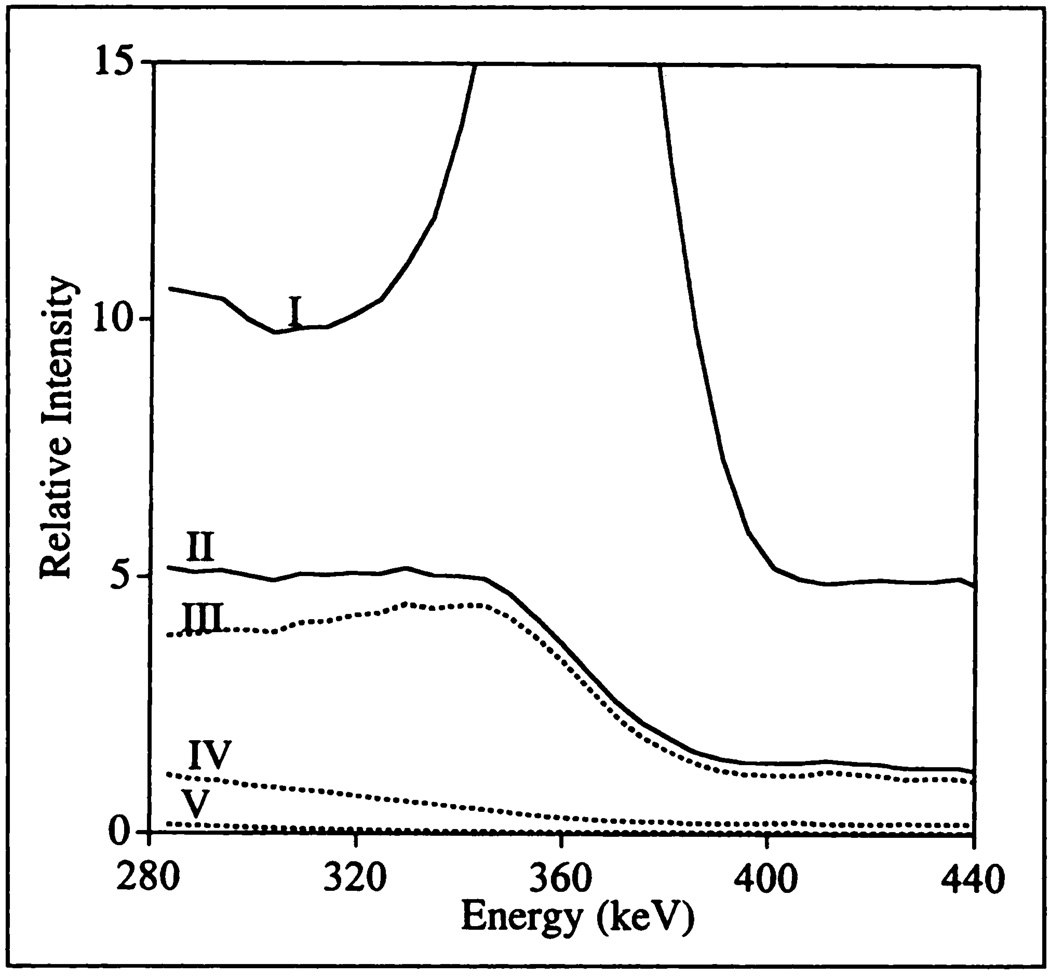
The energy spectra separated according to order of scatter in the phantom are shown in Figures 4. The curves corresponding to all scattered events and all detected events (scattered and nonscattered) are also plotted. In the simulation, the maximum number of scatter orders allowed in the phantom was set to 4, but only up to 3 orders are included in the figures for the sake of clarity. For 99mTc imaging, the simulations of Floyd et al. (14) showed that the energy distribution peaks at progressively lower energies as the scattering order increases. The 131I data of this study also appear to follow this trend in the limited energy range that was examined. The energy spectra show that use of a symmetric 20% photopeak window (327–400 keV) will eliminate most of the third-order and higher order scatter events. In a 20% photopeak window, the percentages of first-, second-, third-, and fourth-order scattered photons are 88%, 11%, 1%, and <0.1%, respectively. Simulation results show that of all events detected in the 20% window only 22% have undergone scatter in the phantom. Thus, scatter and penetration in the collimator (Table 1) are more significant than object scatter, and accurate modeling of the collimator is of great importance.
FIGURE 4.
Simulated separated energy spectra for point source in water. Curves are scattered and unscattered photons (I), all scattered photons (II), first-order scattered photons (III), second-order scattered photons (IV), and third-order scattered photons (V).
Hot Sphere
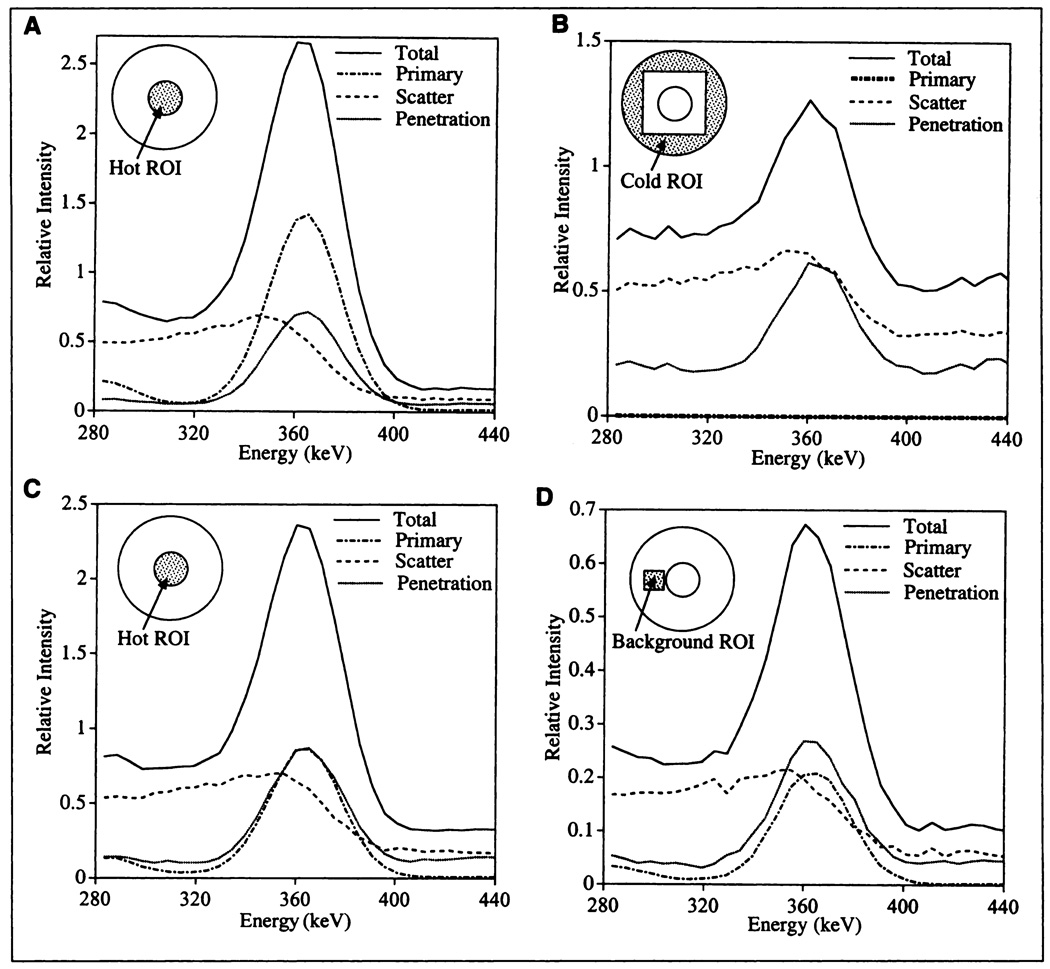
The separated primary, scatter, and penetration ROI energy spectra are plotted in Figure 5. Figures 5A and 5B correspond to the case with no background activity, and Figures 5C and 5D correspond to the case with background activity. The ROIs used are indicated in the inset, which shows a cross section of the phantom. Because of the low counting rate in the cold and background regions, the spectra corresponding to these regions are noisier than the spectra for the hot sphere ROIs. For the case of the phantom with background activity, the energy spectra of the hot sphere and background regions are quite similar, except that for the background ROI the penetration component is more intense than is the primary component. Penetration dominates because the background region selected is adjacent to a region of high activity. Figure 5 shows that even within a narrow photopeak window, a large fraction of the total energy spectrum is associated with scatter and penetration events. Although Compton scattered photons have lost part of their energy before reaching the detector, scatter events will be included in the photopeak window because of the small energy loss for small angle scattering and the finite energy resolution of the camera. The scatter spectra display a relatively flat tail beyond the photopeak because of the contribution from higher energy γ-rays (637 and 723 keV) that scatter in the phantom or collimator. As with the primary spectra, the penetration spectra display a photopeak at 364 keV. This is because as with the primary photons, events that penetrate the collimator do not suffer any energy loss before reaching the detector. On either side of the photopeak, the penetration spectrum is relatively flat. This contribution is from the 637- and 723-keV photons that penetrate the collimator followed by partial energy deposition in the crystal.
FIGURE 5.
Total, primary, scatter, and penetration components of energy spectrum corresponding to ROIs indicated by shaded regions in inset. (A) Hot sphere ROI for phantom with no background activity. (B) Cold ROI for phantom with no background activity. (C) Hot sphere ROI for phantom with background activity. (D) Background ROI for phantom with background activity.
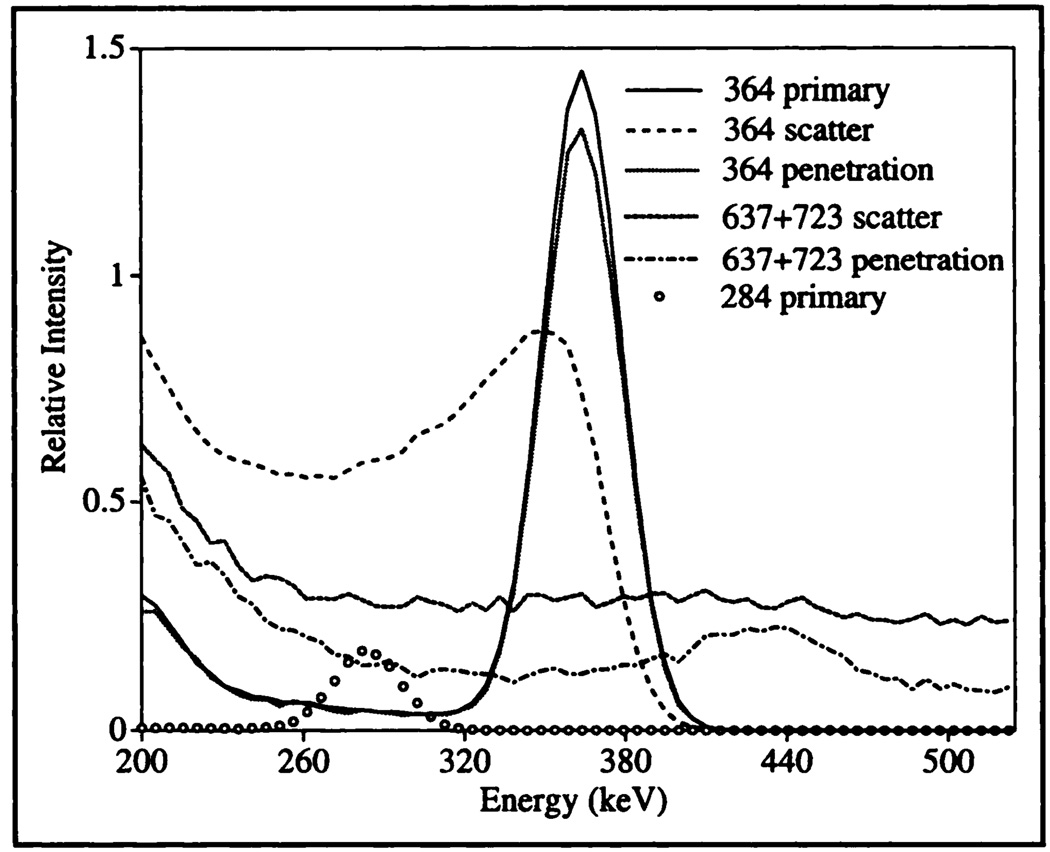
For the phantom with background activity, the primary, penetration, and scatter spectra further separated according to the emission energy of the γ-ray are shown in Figure 6. The spectra correspond to the hot sphere ROI. For the sake of clarity, the scatter and penetration components of the 284-keV emission and the primary component of the 637-and 723-keV emissions are, not shown because they are negligible near the 364-keV photopeak. According to Figure 6, the contribution of 284-keV photons to events in a 20% photopeak window is negligible. However, this emission is of significance when positioning the low-energy window in dual-energy window (24) and TEW scatter compensation methods. The low-energy distribution of the 364-keV primary component is associated with photons that undergo Compton scatter in the crystal with partial energy deposition. These events are correctly positioned but will be included in a scatter window located below the photopeak, thereby resulting in the subtraction of some good events in multiple-window scatter correction methods. The 364-keV scatter component peaks just below the photopeak energy but extends up to the maximum energy of the primary component because of the finite energy resolution. The 364-keV penetration spectrum is very similar in shape to that of the primary spectrum. The scatter and penetration spectra corresponding to 637- and 723-keV photons are relatively flat across the photopeak window. Note that the small bump at 440 keV in the 637- and 723-keV scatter spectrum is the Compton edge of 637-keV photons.
FIGURE 6.
Spectra of 284-, 364-, and 637 + 723-keV γ-rays separated according to type of interaction for ROI indicated in Figure 5C.
Separation of the 131I energy spectrum to observe the spectral shape of the various γ-ray emissions can be done only by simulation. Approximate shapes can be measured experimentally using monoenergetic isotopes that are close in energy to that of the 131I emissions. For example, both Macey et al. (5) and Pollard et al. (13) have proposed models for 131I scatter and penetration correction in which the spectrum shape of the 637-and 723-keV γ-rays was inferred from the measured energy spectrum of 137Cs (662 keV). Simulation results such as the separated energy spectra of Figure 5 and Figure 6 will eliminate the need for such approximations.
Ideally, in the case of 131I SPECT, a correction technique that compensates for both scatter and penetration is desired. However, it is difficult to compensate for penetration of 364-keV γ-rays using techniques that are based on spectral analysis because of the similarity between the 364-keV primary and penetration energy spectra shown in Figure 6. An alternative to compensation is to reduce septal penetration by better collimator design.
TEW Scatter Correction
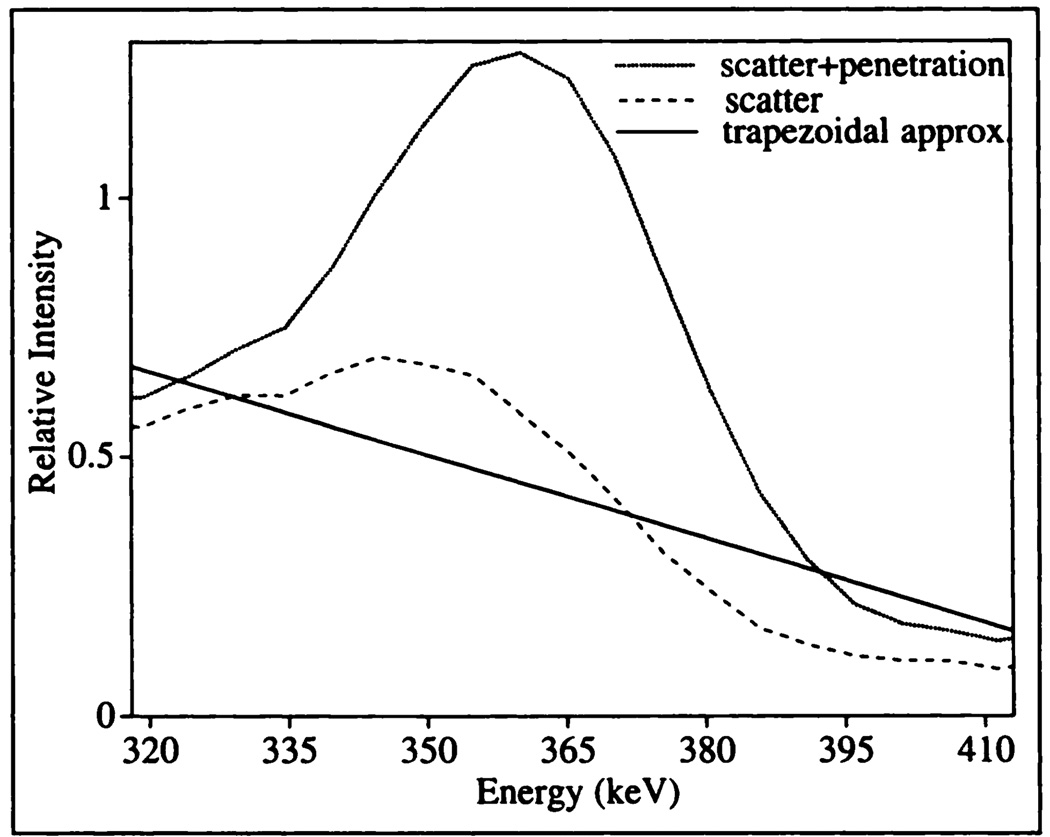
The characterization of scatter and penetration is valuable for assessing techniques that compensate for such events. As an example, the hot sphere phantom energy spectra are used to perform a preliminary evaluation of the TEW correction. For the hot sphere ROI without background activity, the scatter spectrum (object and collimator scatter) within the photopeak window is plotted in Figure 7 together with the trapezoid area that is based on the simulated total counts in the adjacent subwindows. In this case, the trapezoid area is a good approximation of the area under the scatter spectrum. For the four ROIs indicated in Figure 5, the percentage difference between the simulated true scatter counts and the TEW estimate of scatter counts is summarized in Table 2. In all cases the TEW method overestimates the scatter counts, but the agreement is reasonable, especially in the two hot sphere ROIs. The largest discrepancy is for the cold region and can be explained on the basis of the energy spectra of Figure 5. In the lower subwindow centered at 318 keV, the penetration counts corresponding to the cold region are much more significant than are the penetration counts for the hot spheres. Therefore, for the cold region, the fraction of total counts in the lower subwindow that is associated with scatter events is smaller than the corresponding fraction for the hot spheres, and the trapezoid area that is based on total counts in the subwindows substantially overestimates the scatter counts. For 99mTc imaging, Narita et al. (25) also reported larger errors associated with the TEW technique in cold regions than with high activity regions in a low-activity background.
FIGURE 7.
Scatter spectrum, scatter and penetration spectrum, and trapezoid approximation (approx) in photopeak window for ROI indicated in Figure 5A.
TABLE 2.
Percentage Difference Between True Scatter Counts and TEW Estimate of Scatter Counts
| Hot sphere region (%) | Cold region (%) |
Background region (%) |
|
|---|---|---|---|
| No background activity |
With background activity |
||
| 0.2 | 11.2 | 20.3 | 17.5 |
Regions are as indicated in Figure 5.
Figure 7 also shows the sum of both scatter and penetration counts in the photopeak window—i.e., all bad counts that ideally should be eliminated. Although the TEW correction is a reasonable approximation of scatter counts, Figure 7 indicates that it greatly underestimates the sum of scatter and penetration counts with the current window positions. On the basis of the spectra of Figure 5, this also will be true for the other three ROIs. In previous work on 131I quantification, measurements with a hot sphere phantom showed that the reconstructed counts within the sphere ROI increase with the background activity level even after TEW compensation has been performed (22). Figure 7 indicates that this is largely associated with penetration tails from the surrounding activity because scatter events are adequately compensated by the TEW correction. Further evaluation of the TEW method, including effects of window width and window location, needs to be performed.
CONCLUSION
The SIMIND Monte Carlo code was validated for 131I imaging and was used to perform a detailed investigation of scatter and penetration. This characterization will be useful for development of new techniques and evaluation of existing techniques that correct for scatter and penetration in 131I SPECT. Energy spectra were separated according to order of scatter, type of interaction, and γ-ray emission energy. On the basis of the separated scatter and penetration energy spectra, a preliminary evaluation of the TEW compensation method was performed. For the hot spheres, which are of interest in tumor quantification, the TEW method provides a reasonable correction for scatter. However, the similarity between the 364-keV primary and penetration energy spectra makes it difficult to compensate for these penetration events using techniques that are based on spectral analysis such as TEW.
ACKNOWLEDGMENTS
This work was supported by Public Health Service grants R01 CA80927 and R01 CA38790 awarded by the National Cancer Institute, Department of Health and Human Services, and grant 2535-B96–10XAA awarded by the Swedish Cancer Foundation. The contents of this work are solely the responsibility of the authors and do not necessarily represent the official views of the National Cancer Institute or the Swedish Cancer Foundation.
REFERENCES
- 1.Wahl RL, Zasadny KR, McFarlane D. Iodine-131 anti-B1 antibody for B-cell lymphoma: an update on the Michigan phase I experience. J Nucl Med. 1998;39 suppl:215–275. [PubMed] [Google Scholar]
- 2.Kaminski MS, Zasadny KR, Francis IR. Iodine-13l-anti B1 radioimmunotherapy for B-cell lymphoma. J Clin Oncol. 1996;14:1974–1981. doi: 10.1200/JCO.1996.14.7.1974. [DOI] [PubMed] [Google Scholar]
- 3.DeNardo GL, Lamborn KR, Goldstein DS, Kroger LA, DeNardo SJ. Increased survival associated with radiolabeled lym-1 therapy for non-Hodgkin’s lymphoma and chronic lymphocytic leukemia. Cancer. 1997;80:2706–2711. doi: 10.1002/(sici)1097-0142(19971215)80:12+<2706::aid-cncr49>3.3.co;2-m. [DOI] [PubMed] [Google Scholar]
- 4.Press O, Early J, Appelbaum F, et al. Phase II trial of I-131 B1 (anti-CD2O) antibody therapy with autologous stem cell transplantation for relapsed B-cell lymphomas. Lancet. 1995;346:336–340. doi: 10.1016/s0140-6736(95)92225-3. [DOI] [PubMed] [Google Scholar]
- 5.Macey DJ, Grant EJ, Bayouth JE. Improved conjugate view quantitation of I-131 by subtraction of scatter and septal penetration events with a triple energy window method. Med Phys. 1995;22:1637–1643. doi: 10.1118/1.597423. [DOI] [PubMed] [Google Scholar]
- 6.Pollard KR, Bice AN, Eary JF, Durack LD, Lewellen TK. A method of imaging therapeutic doses of iodine-131 with a clinical gamma camera. J Nucl Med. 1992;33:771–776. [PubMed] [Google Scholar]
- 7.Zasadny KR, Gates VL, Francis I, Fisher S, Kaminski MS, Wahl RL. Normal organ and tumor dosimetry of I-131-anti-B1 (anti CD-20) radioimmunotherapy at non-marrow ablative doses [abstract] J Nucl Med. 1997;38:230P. [Google Scholar]
- 8.Early JF, Appelbaum FL, Durack L, Brown P. Preliminary validation of the opposing view method for quantitative gamma camera imaging. Med Phys. 1989;16:382–387. doi: 10.1118/1.596347. [DOI] [PubMed] [Google Scholar]
- 9.Koral KF, Zasadny KR, Kessler ML. CT-SPECT fusion plus conjugate views for determining dosimetry in iodine-131-monoclonal antibody therapy of lymphoma patients. J Nucl Med. 1994;35:1714–1720. [PubMed] [Google Scholar]
- 10.Green AJ, Dewhurst SE, Begent RHJ, Bagshawe KD, Riggs SJ. Accurate quantification of 131I distribution by gamma camera imaging. Eur J Nucl Med. 1990;16:361–365. doi: 10.1007/BF00842793. [DOI] [PubMed] [Google Scholar]
- 11. [Accessed July 30, 1998];Upton, NY: National Nuclear Data Center, Brookhaven National Laboratory; Nuclear Data (NuDat) Retrieval Program. Available at: http://www.nndc.bnl.gov/htbin/nudat.cgi.
- 12.Bice AN, Durack LD, Pollard KR, Eary JF. Assessment of I-131 scattering and septal penetration in clinical gamma camera high energy parallel hole collimators [abstract] J Nucl Med. 1991;32:1058P. [Google Scholar]
- 13.Pollard KR, Lewellen TK, Kaplan MS. Energy-based scatter corrections for scintillation camera images of iodine-131. J Nucl Med. 1996;37:2030–2037. [PubMed] [Google Scholar]
- 14.Floyd CE, Jaszczak RJ, Harris CC, Coleman RE. Energy and spatial distribution of multiple order Compton scatter in SPECT: a Monte Carlo investigation. Phys Med Biol. 1984;29:1217–1230. doi: 10.1088/0031-9155/29/10/005. [DOI] [PubMed] [Google Scholar]
- 15.Ljungberg M, Msaki P, Strand S-E. Comparison of dual window and convolution scatter correction techniques using the Monte Carlo method. Phys Med Biol. 1990;35:1099–1110. [Google Scholar]
- 16.Rosenthal MS, Henry LJ. Scattering in uniform media. Phys Med Biol. 1990;35:265–274. [Google Scholar]
- 17.Ogawa K, Harata Y, Ichihara T, Kubo A, Hashimoto S. A practical method for position dependent Compton scatter compensation in single photon emission CT. IEEE Trans Med Imaging. 1991;10:408–412. doi: 10.1109/42.97591. [DOI] [PubMed] [Google Scholar]
- 18.Koral KF, Wang X, Zasadny KR, et al. Testing of local gamma-ray scatter fractions determined by spectral fitting. Phys Med Biol. 1991;36:177–190. doi: 10.1088/0031-9155/36/2/003. [DOI] [PubMed] [Google Scholar]
- 19.Ljungberg M, Strand S-E. A Monte Carlo program simulating scintillation camera imaging. Comput Methods Programs Biomed. 1989;29:257–272. doi: 10.1016/0169-2607(89)90111-9. [DOI] [PubMed] [Google Scholar]
- 20.Ljungberg M, Strand S-E, King MA. Monte Carlo Calculations in Nuclear Medicine. Bristol, UK: Institute of Physics Publishing; 1998. [Google Scholar]
- 21.de Vries DJ, Moore SC, Zimmerman RE, Mueller SP, Friedland B, Lanza RC. Development and validation of a Monte Carlo simulation of photon transport in an anger camera. IEEE Trans Med Imaging. 1990;9:430–438. doi: 10.1109/42.61758. [DOI] [PubMed] [Google Scholar]
- 22.Dewaraja YK, Li J, Koral KF. Quantitative I-131 SPECT with triple energy window Compton scatter correction. IEEE Trans Nucl Sci. 1998;45:3109–3114. [Google Scholar]
- 23.Koral KF, Dewaraja Y, Li J, et al. Preliminary report of tumor dosimetiy from 131I SPECT of previously untreated patients with B-cell lymphoma [abstract] J Nucl Med. 1998;39:112P. [Google Scholar]
- 24.Jaszcak RJ, Greer KL, Floyd CE, Harris CC, Coleman RE. Improved SPECT quantification using compensation for scattered photons. J Nucl Med. 1984;25:893–900. [PubMed] [Google Scholar]
- 25.Narita Y, Eberl S, Iida H, et al. Monte Carlo and experimental evaluation of accuracy and noise properties of two scatter correction methods for SPECT. Phys Med Biol. 1996;41:2481–2496. doi: 10.1088/0031-9155/41/11/017. [DOI] [PubMed] [Google Scholar]


