Abstract
A full-field hard-x-ray microscope at SSRL has successfully imaged samples of biological and environmental origin at 40 nm resolution. Phase contrast imaging of trabeculae from a female mouse tibia, loaded in vivo to study the effects of weight-bearing on bone structure, revealed a complex network of osteocytes and canaliculi. Imaging of cordgrass roots exposed to mercury revealed nanoparticles with strong absorption contrast. 3D tomography of yeast cells grown in selenium rich media showed internal structure.
1. Introduction
The full-field transmission x-ray microscope at SSRL [1] has been used to obtain images at 40 nm resolution of mouse bone, plant roots, and yeast cells, as described below.
2. Phase contrast imaging of mouse cancellous bone
The mammalian skeleton consists of bone, roughly a composite of collagen and mineral seeded with cells. Osteocytes, bone forming cells trapped within the tissue, are connected through a vast three-dimensional network of cellular processes known as canaliculi. As a result, osteocytes are presumed to act as a sensor network within the tissue that regulates remodeling in response to a variety of biophysical stimuli. Viewing the structure/morphology of the osteocytic network including the processes is desirable both for developing a mechanistic understanding of the regulation of healthy bone and to understand the adaptive changes that occur due to anabolic and catabolic stimuli. In collaboration with Eduardo Almeida of NASA Ames Research Center and Marjolein van der Meulen of Cornell University, mouse bone tissue was examined following experiments to either increase or decrease mechanical stimuli to the skeleton in vivo.
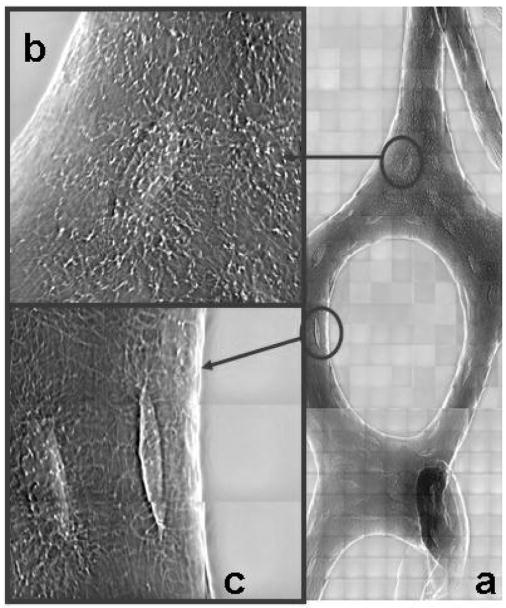
The TXM mosaic view of the mouse tibia trabecula (figure 1a) was obtained by raster scanning successive full-field images taken in phase contrast (14μm square fields at 8 keV). Higher resolution images were acquired of cells within the tissue, revealing elliptical osteocytic lacunae with emanating canaliculi (figure 1b,c) whose diameter approaches the resolution of the TXM. The use of phase contrast was critical: the lacunae were barely evident at 8 keV with absorption imaging. This level of detail, within the intact tissue structure, will be studied further to determine the effect of loading conditions on cell morphology, orientation and interaction via processes to understand how mechanical stimuli regulate bone mass.
Figure 1.
(a) Mosaic phase contrast image at 8 keV of mouse trabecula subjected to in vivo loading of the tibia. Detail images of individual osteocyte lacunae (b) and (c) show network of cellular processes (canaliculi) that facilitate communication and transport between cells.
3. Absorption contrast and tomography of mercury nanoparticles in plant roots
Spartina foliosa is a wetland cordgrass prevalent in San Francisco Bay, where past mercury mining has resulted in mercury contamination. Microorganisms in the rhizosphere of S. foliosa and other wetland plants are known to have a significant role in mercury methylation [2]. Methylated mercury can be biomagnified up the food web, resulting in levels in sport fish up to one million times greater than in surrounding waters and resulting in advisories to limit fish intake. Understanding the uptake and methylation of mercury in the plant rhizosphere can yield insight into ways to manage mercury contamination.
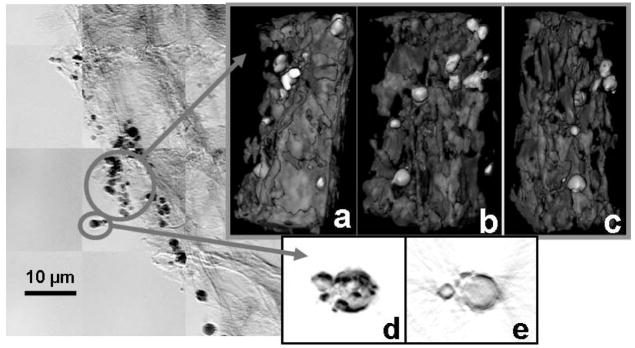
Figure 2 is a mosaic in absorption contrast of a root hair from S. foliosa that was exposed to 1 ppm Hg (as HgCl2) hydroponically for one week. The dark particles have been confirmed to be Hg with microprobe analysis. Figures 2a–2c are 2D stills from 3D tomography on a group of nanoparticles, which show that the particles are on the root surface, because the side closer to the root (the right side of (a) and the left side of (c)) do not contain particles, only the front (b) away from the root surface. The lower-density material surrounding the particles may be biofilm. Figure 2d is a 2D still from tomography of one of the particles. A slice from the tomographic reconstruction of this particle (figure 2e) reveals that it is hollow, consistent with microorganisms that have a monolayer of Hg on the surface.
Figure 2.
Absorption contrast mosaic image at 9 keV of cordgrass root exposed to mercury, and 2D stills (a–d) of tomographic reconstructions of Hg- containing nanoparticles (2-sec images taken every 1 degree from −70 to 70 degrees at 8 keV). In a-c highest absorption is rendered in white for best clarity, in d–e highest absorption is black. Slice from reconstruction of particle in (d) is shown in (e). In-house iterative reconstruction viewed with Amira.
4. Tomography of yeast cells grown in Se-rich media
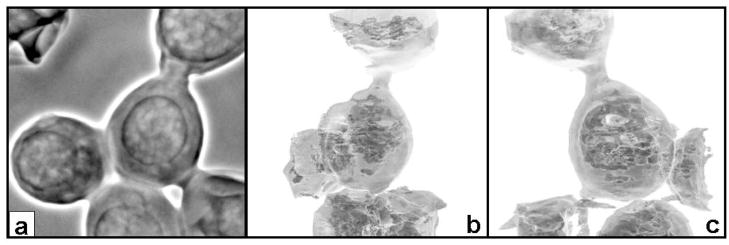
Selenized yeast is one of the primary sources of organoselenium in the nutrition supplement market, and better understanding of the distribution of Se in the yeast is of great interest. In collaboration with Zoltan Mester and Laurent Ouerdane of the Institute for National Measurement Standards in Canada, we obtained images of yeast cells that had been grown in Se-rich media. A wild-type strain of baker’s yeast, Saccharomyces cerevisiae, was grown on synthetic defined media optimized for S. cerevisiae, prepared to control sulfur during yeast growth. After growth in media containing 0.1 mM sodium selenate, yeast cells were fixed using glutaraldehyde buffer and spotted on a Si3N4 membrane for x-ray microscopy. TXM results indicate that the cells have excellent contrast (figure 3a), to a degree previously seen only in the water window (low-energy x-ray region). 3D tomography (stills in figure 3b and c) reveals a view of the inner cell in addition to the outer shell.
Figure 3.
Zernike phase contrast TXM at 8 keV of yeast cells grown in Se-rich media. (a) Average of 20 2-sec scans. In (b) and (c) single images at two different viewing angles from a 3D tomographic reconstruction (8-sec images taken every 5 degrees from −75 to 75 degrees at 8 keV) show transparent view of inner cell. In-house iterative reconstruction viewed with Amira.
5. Conclusion
In summary, the TXM at beam line 6-2 at SSRL has successfully imaged samples with biological and environmental applications. With this method we have been able to discern features not previously apparent with other methods.
Acknowledgments
This work has been supported by NIH/NIBIB grant number R01-EB004321. SSRL is supported by the Department of Energy, Office of Basic Energy Sciences.
References
- 1.Andrews JC, et al. this proceedings. [Google Scholar]
- 2.Mauro JB, Guimaraes JRD, Hintelmann H, Watras CJ, Haack EA, Coelho-Souza SA. Anal Bioanal Chem. 2002;374:983. doi: 10.1007/s00216-002-1534-1. [DOI] [PubMed] [Google Scholar]


