

Abstract
Objective
To improve global vascular risk prediction with behavioral and anthropometric factors.
Background
Few cardiovascular risk models are designed to predict the global vascular risk of MI, stroke, or vascular death in multi-ethnic individuals, and existing schemes do not fully include behavioral risk factors.
Methods
A randomly-derived, population-based, prospective cohort of 2737 community participants free of stroke and coronary artery disease were followed annually for a median of 9.0 years in the Northern Manhattan Study (mean age 69 years; 63.2% women; 52.7% Hispanic, 24.9% African-American, 19.9% white). A global vascular risk score (GVRS) predictive of stroke, myocardial infarction, or vascular death was developed by adding variables to the traditional Framingham cardiovascular variables based on the likelihood ratio criterion. Model utility was assessed through receiver operating characteristics, calibration, and effect on reclassification of subjects.
Results
Variables which significantly added to the traditional Framingham profile included waist circumference, alcohol consumption, and physical activity. Continuous measures for blood pressure and fasting blood sugar were used instead of hypertension and diabetes. Ten -year event-free probabilities were 0.95 for the first quartile of GVRS, 0.89 for the second quartile, 0.79 for the third quartile, and 0.56 for the fourth quartile. The addition of behavioral factors in our model improved prediction of 10 -year event rates compared to a model restricted to the traditional variables.
Conclusion
A global vascular risk score that combines both traditional, behavioral, and anthropometric risk factors, uses continuous variables for physiological parameters, and is applicable to non-white subjects could improve primary prevention strategies.
Keywords: Cardiovascular Disease, Cerebrovascular Disease, Prevention, Risk Factors, Epidemiology
Introduction
Cardiovascular diseases remain major threats to the future public health of multiple countries. Although success has been achieved in reducing mortality, the aging of the population and the lack of reduction in risk factor prevalence will require more innovative approaches to prevent cardiovascular disease and stroke. Approaches to predict who is at increased vascular risk can aid health care professionals to detect the “at-risk” individual. The use of risk assessment tools has been recommended to help identify individuals who could benefit from therapeutic interventions and who may not be treated on the basis of any one risk factor.1 Such tools need to consider a broader perspective and attempt to estimate the global risk of developing myocardial infarction, stroke or vascular death.
Various tools have been devised to predict a variety of adverse cardiovascular events with increasing sophistication. However, many of these studies have been limited by the use of a single gender,2-4 lack of racial diversity,4-6 or endpoints limited to either heart disease3, 6, 7 or stroke alone.4, 5, 8, 9 The Framingham-based models are the most widely-studied tools to predict the risk of developing coronary heart disease,6 stroke,5 and cardiovascular risk,10 however, they do not include many behavioral variables nor anthropometric indices. Although derived from a white population, the Framingham model has been found to be relatively accurate in certain ethnic populations, 11 but questioned in others.12-15 There are no prediction models derived from cohorts with a significant non-white population.
Our goal was to use the Northern Manhattan Study (NOMAS) to improve on currently available global cardiovascular disease risk prediction tools by incorporating both traditional and behavioral risk factors, and determine the incremental benefit of adding these risk factors. We wanted to develop a prediction tool from a racially and ethnically diverse cohort that would be useful for African-American and Hispanic persons at risk for vascular disease.
Methods
The Northern Manhattan Study (NOMAS) is a prospective, population-based cohort of 3,298 subjects. The primary goals of the study are to describe the prevalence of vascular risk factors and incidence of vascular outcomes in a community-based sample, identify new vascular risk factors, and characterize these factors among a racially and ethnically diverse cohort. The study was approved by the institutional review boards of Columbia University and the University of Miami, and informed consent was obtained from all participants.
Cohort Selection
The cohort was recruited between 1993 and 2001 as described elsewhere.16 Subjects were enrolled if they 1) were at least 40 years of age, 2) lived in a pre-defined geographic area of northern Manhattan for at least three months in a household with a telephone, and 3) did not have a history of stroke. Additionally, 561 subjects with baseline coronary artery disease (angina, MI, cardiac bypass surgery, or coronary angioplasty) were excluded for this analysis. Subjects were contacted by using random digit dialing of both published and unpublished telephone numbers. The telephone response rate was 91% (9% refused to be screened), and 87% of eligible subjects indicated they were willing to participate. The enrollment response rate was 75%, resulting in an overall response rate of 68%.
Baseline Assessment
All participants underwent a thorough baseline examination including comprehensive medical history, physical examination, review of medical records, and fasting blood samples. Standardized questions were adapted from the Centers for Disease Control and Prevention Behavioral Risk Factor Surveillance System. Race-ethnicity was based upon self-identification modeled after the US census. Smoking was defined as either non-smoker, current smoker (within the last year), or former smoker. Alcohol use, with non-drinking as the reference, was defined as moderate if the subject asserted to currently drinking at least one drink per month, but no more than two drinks per day. Leisure-time physical activity was recorded using a simple questionnaire adapted from the National Health Interview Survey and categorized as either none (reference), mild, or moderate-to-heavy based on the type of activities performed.17
Blood pressure and waist circumference were measured at baseline. Other cardiovascular conditions were recorded including atrial fibrillation, valvular heart disease, and peripheral vascular disease (defined by self-report as a history of vascular disease in the legs or pain in the back of the legs with walking which stops with rest). Fasting high density lipoprotein (HDL) and total cholesterol were obtained using a Hitachi 705 automated spectrometer and low density lipoprotein (LDL) levels were derived from the Friedwald equation.
Prospective Follow-Up
Subjects were followed annually by telephone. Only 2 subjects were completely lost to follow-up after their baseline exam and the average annual contact rate was 99%. The telephone interview assessed any change in vital status, neurological or cardiac symptoms and events, and hospitalizations. A positive screen for any potential cardiac or neurological event was followed by an in-person assessment to determine whether a vascular outcome had occurred. We prospectively screened all admissions and discharges to detect hospitalizations and outcomes that may not have been captured by telephone interview. Nearly 70% of our vascular events led to hospitalizations at Columbia-Presbyterian Hospital.
Classification of Outcomes
Hospital records were reviewed to classify all outcomes as previously reported.16 The three main outcomes of interest included stroke, myocardial infarction, and vascular death. At least two stroke neurologists were responsible for verifying and classifying every case of stroke. Myocardial infarction was defined by criteria from the Cardiac Arrhythmia Suppression Trial18 and the Lipid Research Clinics Coronary Primary Prevention Trial19 and adjudicated by a study team cardiologist. Death was classified as either vascular or non-vascular based on information from family, medical records, death certificate, and primary care physicians. Vascular causes of death were stroke, MI, heart failure, pulmonary embolus, cardiac arrhythmia, and other vascular causes. Non-vascular causes of death included accidents, cancer, pulmonary (pneumonia, COPD, etc.), and other non-vascular causes.
Statistical Analysis
Model Building
Our goal was to construct a survival model to predict combined cardiovascular outcomes, which included stroke (ischemic or intracerebral hemorrhage), MI, and vascular death. We started Cox proportional hazard models by including all of the traditional risk factors from the Framingham models. Although certain variables were less predictive in our cohort, we chose to retain them since our goal was to build a predictor model adding to the traditional Framingham variables. Some traditional variables were used in a different functional form: diabetes was replaced by continuous measure of fasting blood sugar; and dichotomous smoking status was trichotomized as never, past, and current smoking. We replaced the traditional categorical risk factors with continuous variables to enhance the fit of the model. We evaluated the goodness of fit of using continuous measures instead of categorical variables and whether the specified linear relationship on log hazard function was appropriate by generating smoothed curve fit of martingale residuals omitting each continuous variable.20
We retained basic sociodemographic variables (age, gender, and race-ethnicity) and selectively added other vascular risk factors that could be ascertained through history or blood tests. Variables that were assessed included sibling history of stroke or MI, waist circumference, body mass index, waist to hip ratio, alcohol consumption, physical activity, peripheral vascular disease, atrial fibrillation, valvular heart disease, homocysteine, white blood cell count, and creatinine levels. We kept risk factor variables with significant contribution to the fit using the likelihood ratio criterion. All two-way interaction terms, including by age, gender and race-ethnicity, were examined and the terms contributing significantly to the fit by the likelihood ratio criterion are included in the final model.
A global vascular risk score (GVRS) was computed by summing a product of a linear predictor from our final model. Kaplan- Meier curves for survival free of stroke, MI or vascular death were plotted for the quartiles of the GVRS. We constructed plots of probabilities having the combined event within five years and ten years as a function of the GVRS.
Model Assessments
We reported a deviance analysis to quantify the relative contribution of the newly added variables to the goodness of fit that utilized the additive property of the sum of squares.21 We compared receiver operating characteristics (ROC) for our new model, a model with only traditional variables, and another model developed using an automated model selection method [Akaike's Information Criterion (AIC)].22 To select the model using AIC criterion, we examined all the models that had additional risk factor variables beyond the traditional variable set and all possible two-way interactions. We compared the area under the curves (AUC) for these 3 models. Using every linear predictor value as a cutoff, we formed a 2×2 table (failure/no failure vs. above cutoff/below cutoff) to obtain sensitivity and one minus specificity. To handle censoring, we calculated sensitivity by using Kaplan-Meier estimates for survival. After sorting values by false positives, areas of successive trapezoids were summed to compute the area under the curve. We compared the degree of subject reclassification between a model with traditional variable coefficients derived for our cohort and our new model by constructing a cross-tabulation of predicted probability categories (<10%, 10-20%, >20% over 10 years) for the 2 models.2, 23
We report two statistics: (1) predictability based on categorical outcome whether the reclassification is correct; and (2) predictability based on continuous degree of correct reclassification. We constructed a novel graphical approach to compare the 2 predicted probabilities derived from the models and evaluate whether the classification was correct or not based on the 10-year outcome of the subject.24 25 We calculated a modified version of the integrated discrimination improvement (IDI) measures proposed by Pencina24 by weighting each improvement based upon the actual observed proportion of uncensored and censored. To conduct hypothesis testing of equal predictability between the two models, we generated the null distribution of the statistic by computing predicted probabilities of the traditional variables and predicted probabilities of the same model from a bootstrap sample, and repeating this procedure 1000 times. We also compared Hosmer-Lemeshow (HL) statistics to check 10-year event predictability accounting for censoring using the Breslow estimator as an alternative to Kaplan-Meier.
Results
The cohort consisted of 2737 community subjects free of stroke and known coronary artery disease. The majority of the subjects (63.2%) were women and 52.7% were Hispanic, 24.9% African-American, and 19.9% white. Baseline characteristics are shown in table 1. Based on the recruitment telephone data, our non-response analysis demonstrated that subjects who were enrolled in-person had a similar frequency of diabetes, smoking, and moderate alcohol use, but were more likely to be overweight, than subjects who did not participate. After a median follow up of 9.0 years, 166 ischemic strokes, 24 hemorrhagic strokes, 158 MIs, and 314 vascular deaths were observed.
Table 1. Baseline Characteristics of the Northern Manhattan Cohort.
| Overall (n=2737) N % |
Hispanics (n=1443) N % |
Blacks (n=681) N % |
Whites (n=546) N % |
p-value | |
|---|---|---|---|---|---|
| Age – mean (SD) | 68.8 (10.4) | 65.9 (9.5) | 71.6 (10.5) | 72.9 (10.2) | <0.0001 |
| Gender | |||||
| Men | 1006 (36.8) | 541 (37.5) | 225 (33.0) | 207 (37.9) | 0.0268 |
| Women | 1731 (63.2) | 902 (62.5) | 456 (67.0) | 339 (62.1) | |
| Behavioral | |||||
| Moderate alcohol consumption | 929 (34.0) | 441 (30.6) | 220 (32.3) | 246 (45.2) | <0.0001 |
| Former smoking | 954 (34.9) | 466 (32.3) | 243 (35.7) | 225 (41.2) | 0.0021 |
| Current smoking | 491 (18.0) | 239 (16.6) | 161 (23.7) | 79 (14.5) | <0.0001 |
| Moderate-to-heavy physical activity | 237 (8.7) | 92 (6.4) | 57 (8.4) | 77 (14.1) | <0.0001 |
| Cardiovascular | |||||
| Systolic BP (mm Hg) mean (SD) | 143 (21) | 143 (21) | 147 (21) | 139 (19) | <0.0001 |
| Diastolic BP (mm Hg) mean (SD) | 83 (11) | 84 (11) | 84 (12) | 80 (11) | <0.0001 |
| Fasting blood sugar – (mg/dL) mean(SD) | 104.6 (47.4) | 107.0 (51.2) | 104.1(47.4) | 99.0 (35.8) | 0.0104 |
| Diabetes – n (%) | 552 (20.2) | 317 (22.0) | 152 (22.4) | 72 (13.2) | <0.0001 |
| Waist circumference (inches) – mean (SD) | 36.6 (5.0) | 36.8 (4.5) | 36.8 (5.5) | 36.1 (5.6) | 0.0079 |
| Peripheral vascular disease – n (%) | 354 (12.9) | 203 (14.1) | 92 (13.5) | 54 (9.9) | 0.0436 |
| Anti-hypertensive meds – n (%) | 1089 (40.3) | 581 (40.9) | 324 (48.2) | 172 (31.5) | <0.0001 |
| Total cholesterol (mg/dL) Mean (SD) | 203 (40) | 202 (40) | 201 (39) | 208 (39) | 0.0067 |
| HDL (mg/dL) Mean (SD) | 47(15) | 44 (13) | 52 (16) | 49 (15) | <0.0001 |
| Outcome events | |||||
| All vascular events | 525 (19.2) | 206 (14.3) | 181 (26.6) | 128 (23.4) | <0.0001 |
| Stroke | 190 (6.9) | 91 (6.3) | 66 (9.7) | 31 (5.7) | 0.0079 |
| MI | 158 (5.8) | 65 (4.5) | 32 (4.7) | 57 (10.4) | <0.0001 |
| Vascular death | 314 (11.5) | 109 (7.6) | 117 (17.2) | 81 (14.8) | <0.0001 |
Variables in the final NOMAS global vascular risk model are shown in table 2. Newly added significant variables included the behavioral risk factors of alcohol consumption and physical activity, and the anthropometric variable of waist circumference. To improve precision, our final model used continuous variables rather than dichotomous variables for blood pressure and blood sugar. Martingale residuals plots demonstrated a gradual increasing trend supporting the use of continuous variables. The Framingham model included an interaction for systolic blood pressure and anti-hypertension medications, while our model had only an interaction term for diastolic blood pressure and anti-hypertensive medications. The only other two-way interaction term was for male gender and moderate physical activity. None of other two-way interactions involving our risk variables and gender or race-ethnicity had p-value smaller than 0.10, suggesting that we did not need separate risk models for each gender or race-ethnic group.
Table 2.
Multivariate parameters estimates, p-values and risk equation from final Cox Proportional Hazards model including all variables for predicting stroke, MI or vascular death in the Northern Manhattan Cohort.
| Parameter Estimate | p-value | |
|---|---|---|
| New Risk Factor Variables | ||
| Waist (inches) | 0.02156 | 0.03 |
| Moderate alcohol consumption | -0.18039 | 0.09 |
| Moderate-to-heavy physical activity | -0.16333 | 0.53 |
| Moderate-to-heavy physical activity*Male gender | -1.01324 | 0.03 |
| Peripheral vascular disease | 0.26737 | 0.04 |
| Sociodemographic Variables | ||
| Age (years) | 0.08338 | <0.0001 |
| Black race | 0.02770 | 0.83 |
| Hispanic race | -0.22214 | 0.08 |
| Male gender | 0.37949 | 0.0004 |
| Traditional Risk Factor Variables | ||
| Systolic blood pressure (mm Hg) | 0.00158 | 0.58 |
| Diastolic blood pressure (mm Hg) | 0.01195 | 0.03 |
| Diastolic blood pressure * anti-hypertensive medication | 0.00247 | 0.04 |
| Fasting blood sugar (mg/dL) | 0.00432 | <0.0001 |
| Former smoking | 0.16383 | 0.14 |
| Current smoking | 0.69142 | <0.0001 |
| Total cholesterol:HDL (mg/dL) | 0.05678 | 0.07 |
NOMAS GLOBAL VASCULAR RISK SCORE = Age*0.08338 + Male Gender*0.37949 + AfricanAmerican*0.02770 + Hispanic Ethnicity*-0.22214 + Waist(inches)*0.02156 + Moderate alcohol consumption*-0.18039 + Former smoking*0.16383 + Current smoking*0.69142 + Moderate-to-heavy physical activity*-0.16333 + Moderate-to-heavy physical activity*male gender*-1.01324 + Systolic blood pressure (mm Hg)*0.00158 + Diastolic blood pressure (mm Hg)*0.01195 + Diastolic blood pressure*anti-hypertensive medication*0.00247 + Peripheral vascular disease*0.26737 + Fasting blood sugar*0.00432 + Total Cholesterol:HDL (mg/dL)*0.05678
Probability of stroke, MI or vascular death within 10 years = 1 - exp(-0.0000306931*exp(GVRscore)).
In the NOMAS cohort, GVRS ranged from 4.4 to 11.6 (mean 8.6 +/- standard deviation 1.0). Ten-year event-free probabilities were 0.95 for the first quartile of GVRS, 0.89 for the second quartile, 0.79 for the third quartile, and 0.56 for the fourth quartile.(Figure 1) The second to fourth quartiles had significantly different survival curves from the first quartile by logrank tests (all p values<0.0001). A GVRS of 9.0 implied a 10-year probability of 0.20, a GVRS of 6.6 a 10-year probability of 0.02, and a GVRS of 8.2 a 10-year probability of 0.10.
Figure 1. Survival Free of Stroke, MI or Vascular Death stratified by NOMAS quartiles of Global Vascular Risk Scores.

GVRS 1st quartile: 4.4-8.0, 2nd quartile: 8.0-8.7, 3rd quartile: 8.7-9.3, 4th quartile: 9.3-11.6
We tested whether the new variables added to our model contributed to the goodness of fit. The addition of the traditional Framingham variables to a model with just age and gender accounted for 3.8% of the maximum possible improvement of the log likelihood (Chi-squared 9 degrees of freedom, p-value<0.0001). Our GVRS model accounted for 5.6% of maximum possible improvement and was significantly different than the model with only traditional variables (Chi-squared 12 degrees of freedom, p-value<0.0001). The areas under the ROC curves (AUC) was greatest for our NOMAS GVRS model (0.747) compared to the model including only traditional variables (0.736) and a third model developed using the AIC method that included traditional variables, waist circumference, and an interaction between alcohol use and physical activity (0.739). (Figure 2)
Figure 2. Comparative Receiver Operating Characteristics.

Receiver Operating Characteristics (ROC) for a model consisting of Framingham traditional variables, model chosen by AIC method (Framingham traditional variables and waist circumference and an interaction between alcohol use and physical activity) and the NOMAS global vascular risk score. Areas under the curve (AUC) for traditional variable model are 0.736, for the traditional variables and waist circumference and an interaction between alcohol use and physical activity 0.739, and for NOMAS GVRS 0.747.
The NOMAS GVRS reclassified 25.4% of subjects classified by the model restricted to traditional variables. (Table 3) However, this does not account for whether the reclassifications were correct. Figure 3 provides more information by plotting predicted probabilities between the two competing models. The crude summary proportion of correctly reclassified points by the NOMAS GVRS compared to a traditional model was 54.8%. The summary statistic (weighted versions of the IDI measures proposed by Pencina) between NOMAS model and traditional variables model was 8.66 and p-value computed from the bootstrap procedure of 0.055.
Table 3.
Comparison of the 10-year estimated vascular risks by the model with traditional Framingham variables* and the NOMAS Global Vascular Risk Score.
| 10-Year Risk NOMAS model | |||||
|---|---|---|---|---|---|
| 10-Year Risk Traditional Framingham variables | <10% | 10%-20% | >=20% | Total | No(%) Reclassified |
| <10% | |||||
| No (%) of participants | 685 (90.61) | 70 (9.26) | 1 (0.13) | 756 | 71 (9.39) |
| Actual event risk | 2.5 | 11.4 | 1.00 | ||
| 10%-20% | |||||
| No (%) of participants | 157 (20.58) | 467 (61.21) | 139 (18.22) | 763 | 296 (38.79) |
| Actual event risk | 3.8 | 16.3 | 21.6 | ||
| >=20% | |||||
| No (%) of participants | 14 (1.50) | 118 (12.66) | 800 (85.84) | 932 | 132 (14.16) |
| Actual event risk | 14.3 | 18.6 | 29.9 | ||
The Framingham model included the following variables: age, sex, diabetes (yes vs. no), current smoking (yes vs. no), systolic blood pressure (continuous), systolic blood pressure*anti-hypertensive medication use, HDL (continuous), Total cholesterol (continuous)
Figure 3. Comparison of 10-year Predicted Probabilities of Global Vascular Risk.

Comparison of 10-year predicted probabilities between the NOMAS GVRS and the model with traditional variables. Points above (below) the dashed line are the subjects whose 10-year risk is predicted higher (lower) with the NOMAS GVRS compared to the model with traditional variables. Black crosses show subjects who failed within 10 years and red dots show those who are free of the outcome for 10 years of follow-up. Note that black points above and red points below the dashed line represent correct reclassification. The crude summary proportion of correctly reclassified points by the NOMAS GVRS compared to Framingham was 54.8%. The summary statistic (weighted versions of the integrated discrimination improvement measures proposed by Pencina) between NOMAS model and traditional variables model is 8.66 and p-value computed from the bootstrap procedure of 0.055.
A calibration of the GVRS comparing the Kaplan-Meir 10-year risks of stroke, MI or vascular death to the predicted probabilities by deciles of the GVRS showed reasonable agreement (Figure 4). The Hosmer-Lemeshow (HL) statistic was 32.3 (p<0.0001) for the model with traditional variables and 23.9 (p=0.0024) for the GVRS model. Although our proposed model has a better fit than one with traditional variables, the HL statistic suggests that there are additional factors needed to explain the variability of outcome particularly among the highest risk group.
Figure 4. Calibration by decile for NOMAS GVR Score.

Comparison of 10-year Kaplan-Meier (gray bar) and NOMAS model-based predicted (decile specific means; black bar) probabilities of stroke, MI or vascular death events by deciles of the NOMAS global vascular risk score.
Discussion
While numerous tools have been developed for the purpose of estimating risk of coronary heart disease alone or stroke alone, risk prediction models for combined vascular outcomes (stroke, MI, vascular death) may be more useful.10 This is increasingly relevant as most of our current preventative medications, such as antiplatelets and statins, prevent MI and stroke. Moreover, stroke and MI may be considered “hard endpoints,” be less likely to be influenced by subjective components or socioeconomic biases, have a greater combined public health impact, and be of particular relevance in the evaluation of non-white populations where stroke may be more frequent. The aim of primary prevention of cardiovascular disease should be to prevent both stroke and cardiac events, and a risk tool that predicts the overall combined risk of these outcomes is a more comprehensive approach to primary prevention.
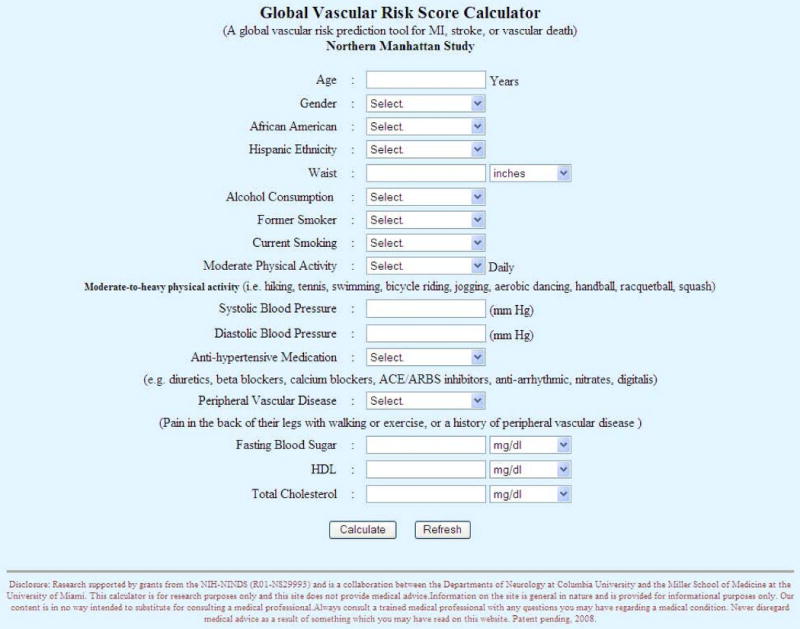
We have demonstrated an improvement in the prediction of global vascular risk by adding behavioral risk factors (alcohol consumption and physical activity) and the anthropometric measure, waist circumference, to the traditional cardiovascular profile. Waist circumference has not been included in prior models, and was a better predictor than BMI in our cohort. Moreover, our GVRS tool utilized continuous variables, rather than categorical classifications that are used in other risk tools (fasting blood sugar instead of diabetes, blood pressure instead of hypertension), that may provide more precise risk assessments. All of these risk factors can be easily recorded in a primary care setting. Although less valid than specific quantitative measures, we used simple questions for self-reported physical activity and alcohol use derived from reliable survey instruments. Just as smoking has been incorporated in most practice settings, other practical lifestyle assessments could be added to office-based clinical histories. Rather than use multiple risk factor tables, we also sought to design a model adaptable to web-based or hand-held programmable devices. Simple online entry of the basic variables into a screen is available to permit calculation of the global vascular risk score. (http://neurology.med.miami.edu/gvr/gvr.htm) (Figure 5) The NOMAS score is also derived from a multi-ethnic cohort that may improve applicability to non-white individuals compared to those tools derived from white or single gender populations.
Figure 5. Web-based screen for entry of Global Vascular Risk Score.
The Framingham Models are well-known risk prediction tools.5, 6, 10 Our model included the basic traditional cardiovascular risk profile and other modifiable risk factors that were independent predictors of global vascular risk. Our GVRS accounted for a greater percentage of the log-likelihood and had a greater AUC in the ROC curve. We caution, however, that the AUC should not be used as a model selection criterion, since the AUC does not change unless relative standings of subjects change. Limitations of using ROC curves for the purpose of variable selection is well documented.23 24 Our model correctly reclassified 54.8% compared to predicted 10-year probabilities from the model with traditional variables (p= 0.055).
Other models have also been developed for cardiovascular disease prediction. Some have included only fatal events,26 27 were intended for use in patients with stable angina,28 or have included community deprivation indices not readily available in a physicians office.29 Previous studies have also assessed the benefits of adding non-traditional risk factors, such as high-sensitivity C-reactive protein (hsCRP).2 Some have found that including novel factors, including cardiovascular disease-associated biomarkers, only marginally improved vascular prediction.8, 30, 31 Other predictors were not considered in our NOMAS GVRS, including carotid measurements, echocardiography, and more extensive inflammatory markers. We felt there were advantages to building an inexpensive model that could be more widely utilized for screening in primary care settings, where there is limited access to expensive testing of less proven screening value.32
In our cohort, the ratio of total cholesterol to HDL was the lipid parameter with the most significant p-value. This ratio has been found to be predictive of first events in Framingham, as well as used in the QRISK score developed in the UK.29 33 Lipids appeared less predictive in our multi-ethnic, elderly cohort. Serum LDL levels, for example, have been strongly correlated with CHD, but their relationship with stroke is less certain.34 Our cohort was also older than in Framingham and the effects of dyslipidemia on coronary heart disease may diminish with age.35, 36 Moreover, the inclusion of an anthropometric measure, missing in the traditional Framingham cardiovascular profile, may have improved risk prediction and substituted for the effects of lipids.37 38
We did not detect interactions for most of our vascular risk factors by age, gender, or race-ethnicity, other than an interaction between physical activity and gender. Therefore, we did not need to use separate models for men and women or by race-ethnic group. The interaction between physical activity and gender indicated that men had a greater protection from moderate to heavy physical activity than women. Although three different race-ethnic groups were represented, there may have been insufficient power to detect interactions and identify racial differences amongst risk factors. Moreover, ethnic differences were attenuated by the addition of the other vascular risk factors. Similar to the Framingham model, the NOMAS global vascular risk score also contains an interaction term for blood pressure and treatment. indicating a greater risk among those on treatment which likely is due to the severity of the condition.5 10 The reason for the better relationship between global vascular risk and diastolic, compared to systolic, blood pressure is not entirely clear, however we have included both measurements. Although previous studies championed a single BP component (DBP or SBP) as the best predictor of cardiovascular outcomes, recent results from Framingham indicate that a combination of BP components, such as SBP and DBP or pulse pressure and mean arterial pressure, may improve stratification of risk.39
There are several important limitations to our NOMAS GVRS. Our model did not include other cardiovascular outcomes such as congestive heart failure, angina pectoris, transient ischemic attacks, and revascularization procedures which are sometimes less well-validated. Therefore, the NOMAS score may underestimate the risk of all adverse cardiovascular events. The use of a single baseline measurement can also lead to inaccurate effect estimates due to regression dilution bias. We did not have enough repeat measurements to adequately estimate this potential bias inherent to many prediction models. Since we used the entire cohort to derive the NOMAS model, we also were unable to validate it using other NOMAS subjects. The accuracy and validity of this model will need to be validated in other independent populations.
In conclusion, we have presented a model for assessing global vascular risk for an urban, multi-ethnic population which incorporates traditional, behavioral, and anthropometric risk factors and utilizes continuous variables. With the more widespread use of the web and handheld electronic devices, global vascular risk models can provide the clinician with a simple inexpensive tool to stratify patients into high, medium and low risk groups. The adoption and more widespread use of global vascular risk prediction tools that emphasize behavioral, as well as pharmacological, approaches to risk factor management could greatly improve the primary prevention of cardiovascular diseases and stroke.40
Acknowledgments
This work was presented in part at the International Stroke Conference, New Orleans, February 2006. The authors gratefully acknowledge the work of Janet DeRosa (Project Manager) and all of the Northern Manhattan Study Coordinators. Dr. Sacco had full access to all of the data in the study and takes responsibility for the integrity of the data and the accuracy of the data analysis.
Disclosures: This work is supported by grants from the National Institute of Neurological Disorders and Stroke (R01 NS 29993). Dr. Sacco has received consulting income from Boehringer Ingelheim for work on clinical trials of secondary stroke prevention. Dr. Elkind receives research support from BMS-Sanofi and disDexus, Inc.; compensation for consulting work from Boehringer-Ingelheim, Daiichi-Sankyo, GlaxoSmithKline, Jarvik Heart, Novartis and Pfizer; and honoraria for lecturing from BMS-Sanofi and Boehringer-Ingelheim.
Footnotes
Publisher's Disclaimer: This is a PDF file of an unedited manuscript that has been accepted for publication. As a service to our customers we are providing this early version of the manuscript. The manuscript will undergo copyediting, typesetting, and review of the resulting proof before it is published in its final citable form. Please note that during the production process errors may be discovered which could affect the content, and all legal disclaimers that apply to the journal pertain.
References
- 1.Goldstein LB, Adams R, Alberts MJ, Appel LJ, Brass LM, Bushnell CD, Culebras A, Degraba TJ, Gorelick PB, Guyton JR, Hart RG, Howard G, Kelly-Hayes M, Nixon JV, Sacco RL. Primary prevention of ischemic stroke: A guideline from the American Heart Association/American Stroke Association Stroke Council. Stroke. 2006;37:1583–1633. doi: 10.1161/01.STR.0000223048.70103.F1. [DOI] [PubMed] [Google Scholar]
- 2.Ridker PM, Buring JE, Rifai N, Cook NR. Development and validation of improved algorithms for the assessment of global cardiovascular risk in women: the Reynolds Risk Score. JAMA. 2007;297(6):611–9. doi: 10.1001/jama.297.6.611. [DOI] [PubMed] [Google Scholar]
- 3.Assmann G, Cullen P, Schulte H. Simple scoring scheme for calculating the risk of acute coronary events based on the 10-year follow-up of the Prospective Cardiovascular Munster (PROCAM) study. Circulation. 2002;105:310–315. doi: 10.1161/hc0302.102575. [DOI] [PubMed] [Google Scholar]
- 4.Tanne D, Yaari S, Goldbourt U. Risk profile and prediction of long-term ischemic stroke mortality: A 21-year follow-up in the Israeli Ischemic Heart Disease (IIHD) project. Circulation. 1998;98:1365–1371. doi: 10.1161/01.cir.98.14.1365. [DOI] [PubMed] [Google Scholar]
- 5.D'Agostino RB, Wolf PA, Belanger AJ, Kannel WB. Stroke risk profile: Adjustment for antihypertensive medication. The Framingham Study. Stroke. 1994;25:40–43. doi: 10.1161/01.str.25.1.40. [DOI] [PubMed] [Google Scholar]
- 6.Wilson PW, D'Agostino RB, Levy D, Belanger AM, Silbershatz H, Kannel WB. Prediction of coronary heart disease using risk factor categories. Circulation. 1998;97:1837–1847. doi: 10.1161/01.cir.97.18.1837. [DOI] [PubMed] [Google Scholar]
- 7.Chambless LE, Folsom AR, Sharrett AR, Sorlie P, Couper D, Szklo M, Nieto FJ. Coronary heart disease risk prediction in the atherosclerosis risk in communities (ARIC) study. J Clin Epidemiol. 2003;56:880–890. doi: 10.1016/s0895-4356(03)00055-6. [DOI] [PubMed] [Google Scholar]
- 8.Chambless LE, Heiss G, Shahar E, Earp MJ, Toole J. Prediction of ischemic stroke risk in the Atherosclerosis Risk In Communities study. Am J Epidemiol. 2004;160:259–269. doi: 10.1093/aje/kwh189. [DOI] [PubMed] [Google Scholar]
- 9.Lumley T, Kronmal RA, Cushman M, Manolio TA, Goldstein S. A stroke prediction score in the elderly: Validation and web-based application. J Clin Epidemiol. 2002;55:129–136. doi: 10.1016/s0895-4356(01)00434-6. [DOI] [PubMed] [Google Scholar]
- 10.D'Agostino RB, Vasan RS, Pencina MJ, Wolf PA, Cobain M, Massaro JM, Kannel WB. General cardiovascular risk profile for use in a primary care - The Framingham Heart Study. Circulation. 2008;117:743–753. doi: 10.1161/CIRCULATIONAHA.107.699579. [DOI] [PubMed] [Google Scholar]
- 11.D'Agostino RB, Sr, Grundy S, Sullivan LM, Wilson P. Validation of the Framingham coronary heart disease prediction scores: Results of a multiple ethnic groups investigation. JAMA. 2001;286:180–187. doi: 10.1001/jama.286.2.180. [DOI] [PubMed] [Google Scholar]
- 12.de Visser CL, Bilo HJ, Thomsen TF, Groenier KH, Meyboom-de Jong B. Prediction of coronary heart disease: A comparison between the Copenhagen risk score and the Framingham risk score applied to a Dutch population. J Intern Med. 2003;253:553–562. doi: 10.1046/j.1365-2796.2003.01137.x. [DOI] [PubMed] [Google Scholar]
- 13.Diverse Populations Collaboration Group. Prediction of mortality from coronary heart disease among diverse populations: Is there a common predictive function? Heart. 2002;88:222–228. doi: 10.1136/heart.88.3.222. [DOI] [PMC free article] [PubMed] [Google Scholar]
- 14.Thomsen TF, McGee D, Davidsen M, Jorgensen T. A cross-validation of risk-scores for coronary heart disease mortality based on data from the Glostrup population studies and Framingham Heart Study. Int J Epidemiol. 2002;31:817–822. doi: 10.1093/ije/31.4.817. [DOI] [PubMed] [Google Scholar]
- 15.Menotti A, Puddu PE, Lanti M. Comparison of the Framingham risk function-based coronary chart with risk function from an Italian population study. Eur Heart J. 2000;21:365–370. doi: 10.1053/euhj.1999.1864. [DOI] [PubMed] [Google Scholar]
- 16.Sacco RL, Anand K, Lee HS, Boden-Albala B, Stabler S, Allen R, Paik MC. Homocysteine and the risk of ischemic stroke in a triethnic cohort: The Northern Manhattan Study. Stroke. 2004;35:2263–2269. doi: 10.1161/01.STR.0000142374.33919.92. [DOI] [PubMed] [Google Scholar]
- 17.Moss AJ, Parsons VL. Current estimates from the national health interview survey. United States, 1985. Vital Health Stat. 1986;10:i–iv. 1–182. [PubMed] [Google Scholar]
- 18.Echt DS, Liebson PR, Mitchell LB, Peters RW, Obias-Manno D, Barker AH, Arensberg D, Baker A, Friedman L, Greene HL, et al. Mortality and morbidity in patients receiving encainide, flecainide, or placebo. The Cardiac Arrhythmia Suppression trial. N Engl J Med. 1991;324:781–788. doi: 10.1056/NEJM199103213241201. [DOI] [PubMed] [Google Scholar]
- 19.Schaefer EJ, Lamon-Fava S, Jenner JL, McNamara JR, Ordovas JM, Davis CE, Abolafia JM, Lippel K, Levy RI. Lipoprotein(a) levels and risk of coronary heart disease in men. The Lipid Research Clinics Coronary Primary Prevention trial. JAMA. 1994;271:999–1003. doi: 10.1001/jama.1994.03510370051031. [DOI] [PubMed] [Google Scholar]
- 20.Cleveland WS. Robust locally weighted regression and smoothing scatterplots. Journal of the American Statistical Association. 1979;74:829–836. [Google Scholar]
- 21.McCullagh P, Nelder J. Generalized Linear Models. London: Chapman and Hall; 1989. [Google Scholar]
- 22.Akaike H. A new look at the statistical model identification. IEEE Transactions on Automatic Control. 1974;19(6):716–723. [Google Scholar]
- 23.Cook N. Use and misuse of the ROC curve in risk prediction. Circulation. 2007;115:928–935. doi: 10.1161/CIRCULATIONAHA.106.672402. [DOI] [PubMed] [Google Scholar]
- 24.Pencina MJ, D'Agostino RB, Sr, D'Agostino RB, Jr, Vasan RS. Evaluating the added predictive ability of a new marker: From area under the ROC curve to reclassification and beyond. Stat Med. 2008;27:157–72. doi: 10.1002/sim.2929. [DOI] [PubMed] [Google Scholar]
- 25.Pepe MS, Feng Z, Gu JW. Comments on ‘Evaluating the added predictive ability of a new marker: From area under the ROC curve to reclassification and beyond’ by M. J. Pencina et al. Stat Med. 2008;27:173–81. doi: 10.1002/sim.2991. [DOI] [PubMed] [Google Scholar]
- 26.Pocock SJ, McCormack V, Gueyffier F, Boutitie F, Fagard RH, Boissel JP. A score for predicting risk of death from cardiovascular disease in adults with raised blood pressure, based on individual patient data from randomised controlled trials. BMJ. 2001;323:75–81. doi: 10.1136/bmj.323.7304.75. [DOI] [PMC free article] [PubMed] [Google Scholar]
- 27.Houston MC, Basile J, Bestermann WH, Egan B, Lackland D, Hawkins RG, Moore MA, Reed J, Rogers P, Wise D, Ferrario CM. Addressing the global cardiovascular risk of hypertension, dyslipidemia, and insulin resistance in the southeastern united states. Am J Med Sci. 2005;329:276–291. doi: 10.1097/00000441-200506000-00008. [DOI] [PubMed] [Google Scholar]
- 28.Clayton TC, Lubsen J, Pocock SJ, Voko Z, Kirwan BA, Fox KA, Poole-Wilson PA. Risk score for predicting death, myocardial infarction, and stroke in patients with stable angina, based on a large randomised trial cohort of patients. BMJ. 2005;331:869. doi: 10.1136/bmj.38603.656076.63. [DOI] [PMC free article] [PubMed] [Google Scholar]
- 29.Hippisley-Cox J, Coupland C, Vinogradova Y, Robson J, May M, Brindle P. Derivation and validation of QRISK, a new cardiovascular disease risk score for the United Kingdom: a prospective open cohort study. BMJ. 2007;335:136–47. doi: 10.1136/bmj.39261.471806.55. [DOI] [PMC free article] [PubMed] [Google Scholar]
- 30.Folsom AR, Chambless LE, Ballantyne CM, Coresh J, Heiss G, Wu KK, Boerwinkle E, Mosley TH, Jr, Sorlie P, Diao G, Sharrett AR. An assessment of incremental coronary risk prediction using C-reactive protein and other novel risk markers: The Atherosclerosis Risk In Communities study. Arch Intern Med. 2006;166:1368–1373. doi: 10.1001/archinte.166.13.1368. [DOI] [PubMed] [Google Scholar]
- 31.Wang TJ, Gona P, Larson MG, Tofler GH, Levy D, Newton-Cheh C, Jacques PF, Rifai N, Selhub J, Robins SJ, Benjamin EJ, D'Agostino RB, Vasan RS. Multiple biomarkers for the prediction of first major cardiovascular events and death. N Engl J Med. 2006;355:2631–2639. doi: 10.1056/NEJMoa055373. [DOI] [PubMed] [Google Scholar]
- 32.Greenland P, Lloyd-Jones D. Defining a rational approach to screening for cardiovascular risk in asymptomatic patients. J Am Coll Cardiol. 2008;52(5):330–2. doi: 10.1016/j.jacc.2008.04.029. [DOI] [PubMed] [Google Scholar]
- 33.Wilson PW, Bozeman SR, Burton TM, Hoaglin DC, Ben-Joseph R, Pashos CL. Prediction of first events of coronary heart disease and stroke with consideration of adiposity. Circulation. 2008;118:124–30. doi: 10.1161/CIRCULATIONAHA.108.772962. [DOI] [PubMed] [Google Scholar]
- 34.Cholesterol diastolic blood pressure, and stroke: 13,000 strokes in 450,000 people in 45 prospective cohorts. Prospective studies collaboration. Lancet. 1995;346:1647–1653. [PubMed] [Google Scholar]
- 35.Corti MC, Guralnik JM, Salive ME, Harris T, Ferrucci L, Glynn RJ, Havlik RJ. Clarifying the direct relation between total cholesterol levels and death from coronary heart disease in older persons. Ann Intern Med. 1997;126:753–760. doi: 10.7326/0003-4819-126-10-199705150-00001. [DOI] [PubMed] [Google Scholar]
- 36.Krumholz HM, Seeman TE, Merrill SS, Mendes de Leon CF, Vaccarino V, Silverman DI, Tsukahara R, Ostfeld AM, Berkman LF. Lack of association between cholesterol and coronary heart disease mortality and morbidity and all-cause mortality in persons older than 70 years. JAMA. 1994;272:1335–1340. [PubMed] [Google Scholar]
- 37.Gaziano TA, Young CR, Fitzmaurice G, Atwood S, Gaziano JM. Laboratory-based versus non-laboratory-based method for assessment of cardiovascular disease risk: the NHANES I Follow-up Study cohort. Lancet. 2008 Mar 15;371(9616):923–31. doi: 10.1016/S0140-6736(08)60418-3. [DOI] [PMC free article] [PubMed] [Google Scholar]
- 38.Gelber RP, Gaziano JM, Orav EJ, Manson JE, Buring JE, Kurth T. Measures of obesity and cardiovascular risk among men and women. J Am Coll Cardiol. 2008 Aug 19;52(8):605–15. doi: 10.1016/j.jacc.2008.03.066. [DOI] [PMC free article] [PubMed] [Google Scholar]
- 39.Franklin SS, Lopez VA, Wong ND, Mitchell GF, Larson MG, Vasan RS, Levy D. Single versus combined blood pressure components and risk for cardiovascular disease: the Framingham Heart Study. Circulation. 2009 Jan 20;119(2):243–50. doi: 10.1161/CIRCULATIONAHA.108.797936. [DOI] [PMC free article] [PubMed] [Google Scholar]
- 40.Califf RM, Armstrong PW, Carver JR, D'Agostino RB, Strauss WE. 27th Bethesda Conference: matching the intensity of risk factor management with the hazard for coronary disease events. Task Force 5. Stratification of patients into high, medium and low risk subgroups for purposes of risk factor management. J Am Coll Cardiol. 1996 Apr;27(5):1007–19. doi: 10.1016/0735-1097(96)87733-3. [DOI] [PubMed] [Google Scholar]