Abstract
Overexposure to intense sound can cause temporary or permanent hearing loss. Postexposure recovery of threshold sensitivity has been assumed to indicate reversal of damage to delicate mechano-sensory and neural structures of the inner ear and no persistent or delayed consequences for auditory function. Here, we show, using cochlear functional assays and confocal imaging of the inner ear in mouse, that acoustic overexposures causing moderate, but completely reversible, threshold elevation leave cochlear sensory cells intact, but cause acute loss of afferent nerve terminals and delayed degeneration of the cochlear nerve. Results suggest that noise-induced damage to the ear has progressive consequences that are considerably more widespread than are revealed by conventional threshold testing. This primary neurodegeneration should add to difficulties hearing in noisy environments, and could contribute to tinnitus, hyperacusis, and other perceptual anomalies commonly associated with inner ear damage.
Introduction
Noise-induced hearing loss (NIHL) is a major health problem (DHHS, 2009), because opportunities for overexposure abound, and exposures that damage hearing are not necessarily painful or even annoying. After overexposure, NIHL recovers with an exponential time course (Miller et al., 1963) for 2–3 weeks, depending on initial severity. Thresholds may fully recover (“temporary” threshold shift) or stabilize at an elevated value (“permanent” threshold shift). Permanent NIHL is due to destruction of cochlear hair cells or damage to their mechano-sensory hair bundles (Liberman and Dodds, 1984). Hair cells normally transduce sound-evoked mechanical motion into receptor potentials, which lead to transmitter release at their glutamatergic synapses with cochlear afferent fibers (see Fig. 1). Hair cell damage can be visible within minutes after overexposure, and hair cell death can continue for days (Wang et al., 2002). In contrast, noise-induced loss of spiral ganglion cells (SGCs), the cell bodies of the cochlear afferent neurons contacting these hair cells, is delayed by months and can progress for years (Kujawa and Liberman, 2006).
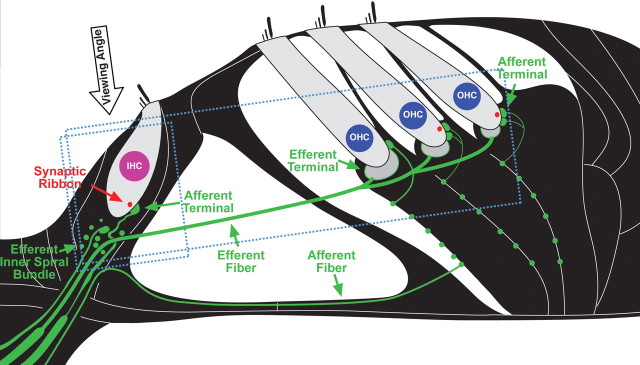
Figure 1.
Schematic of the cochlear sensory epithelium showing inner and outer hair cells and their afferent innervation as they appear in tissue immunostained for neurofilament (green) and a synaptic ribbon protein (CTBP2: red). The approximate orientations of the confocal z stacks shown in subsequent figures are also indicated (small box for Figs. 4 and 8; larger box for Fig. 7): the viewing angle for the xy projections is noted. Efferent terminals in IHC and OHC areas have few neurofilaments and thus do not stain brightly in the confocal images.
There is no hair cell death in temporary NIHL; however, swelling of cochlear nerve terminals at their hair-cell synapses, suggestive of glutamate excitotoxicity, is seen within 24 h after exposure (Spoendlin, 1971; Liberman and Mulroy, 1982; Robertson, 1983). Such sound-evoked excitotoxicity can be blocked by glutamate antagonists and mimicked by glutamate agonists in the absence of sound (Pujol et al., 1993; Sun et al., 2001; Puel et al., 2002; Ruel et al., 2007). Some noise or drug exposures can be followed by rapid postexposure recovery of cochlear synaptic ultrastructure and auditory thresholds, suggesting that swollen terminals have recovered or regenerated (Zheng et al., 1997; Puel et al., 1998; Zheng et al., 1999). Neuronal counts have not been made, however, and long survivals after apparently reversible noise exposures have not been evaluated.
Here, we revisit the issue of neural degeneration in ears with temporary noise-induced threshold shifts. We show rapid, extensive, and irreversible loss of synapses within 24 h postexposure, and delayed and progressive loss of cochlear neurons over many months, although hair cells remain and recover normal function. Despite recovery of threshold sensitivity, the consequences of such primary neuronal loss on auditory processing of suprathreshold sounds are likely dramatic, especially in difficult listening environments.
Materials and Methods
Animals and groups.
Mice of the CBA/CaJ strain were used in this study, because they show excellent cochlear sensitivity and limited age-related elevation in cochlear thresholds. Male CBA/CaJ mice were noise exposed at 16 weeks of age and held without further treatment for various postexposure times. Age-, strain-, and gender-matched animals held identically, except for the exposure, served as controls. All procedures were approved by the Institutional Animal Care and Use Committee of the Massachusetts Eye and Ear Infirmary.
Acoustic overexposures.
The acoustic overexposure stimulus was an octave band of noise (8–16 kHz) at 100 dB SPL, for 2 h. During exposures, animals were unrestrained within small cells in a subdivided cage (1 animal/cell). The cage was suspended directly below the horn of the sound-delivery loudspeaker in a small, reverberant chamber. Noise calibration to target SPL was performed immediately before each exposure session. Sound pressure levels varied by <1 dB across the cages.
Physiological tests.
Mice were anesthetized with ketamine (100 mg/kg, i.p.) and xylazine (10 mg/kg, i.p.). Acoustic stimuli were delivered via a custom acoustic assembly consisting of two electrostatic drivers as sound sources (EC-1, Tucker Davis Technologies) and a miniature electret microphone at the end of a probe tube to measure sound pressure in situ. Auditory brainstem responses (ABRs) were recorded via subdermal needle electrodes (vertex– ventrolateral to pinna). For compound action potentials (CAPs) of the cochlear nerve, the recording electrode was placed at the round window niche. Stimuli were 5 ms tone pips with a 0.5 ms rise-fall time delivered at 30/s (ABR) or 16/s (CAP). The response from the electrodes was amplified, filtered, and averaged (512 samples, for ABR, or 128 samples, for CAP; polarity alternating). Sound level was incremented in 5 dB steps, from ∼10 dB below threshold to 90 dB SPL. Threshold for ABR was defined as the lowest stimulus level at which a repeatable wave I could be identified in the response waveform. CAP threshold was defined as the sound pressure required to produce a wave I response of 6 μV peak to peak. For both neural responses, the wave I component was identified and the peak to peak amplitude computed by off-line analysis of stored waveforms. Distortion product otoacoustic emissions (DPOAEs) were recorded for primary tones with a frequency ratio of 1.2, and with the level of the f2 primary 10 dB less than f1 level, incremented together in 5 dB steps. Ear-canal sound pressure was amplified and digitally sampled, then fast Fourier transforms were computed and averaged by both waveform and spectral averaging. The 2f1-f2 DPOAE amplitude and surrounding noise floor were extracted. Iso-response contours were interpolated from plots of amplitude versus sound level. “Threshold” is defined as the f1 level required to produce a DPOAE of −5 dB SPL. To avoid distortion of nonphysiologic origin, stimulus levels were kept <80 dB SPL; in all cases, however, the range of noise-induced threshold shifts did not exceed the dynamic range available for response monitoring; i.e., there was no artificial “ceiling” limiting the measured threshold shifts. ABRs and DPOAEs were recorded from all animals, CAPs from subsets of animals just before tissue recovery for histological processing.
Histologic preparation, confocal imaging and synaptic counts.
For immunostaining and quantification of synaptic degeneration, cochleae were perfused with 4% paraformaldehyde and 0.25% glutaraldehyde, postfixed for 1–2 h, decalcified in EDTA, microdissected into 6 pieces and immunostained with antibodies to (1) C-terminal binding protein 2 (mouse anti-CtBP2 from BD Biosciences used at 1:200), and either (2) heavy neurofilaments (chicken anti-NF-H from Millipore Bioscience Research Reagents used at 1:1000), or (3) parvalbumin (goat anti-parvalbumin from Swant at 1:5000) and appropriate secondary antibodies coupled to Alexafluors in the red and green channels. A nuclear dye, TOPRO-3 was added to aid in hair cell counting, and in some cases, phalloidin (coupled to Alexafluor 568) was added to image stereocilia bundles. Immunostaining with postsynaptic markers such as glutamate receptors (rabbit anti-GluR2/3 from Millipore Bioscience Research Reagents) or proteins associated with the postsynaptic density (mouse anti-PSD-95 from Millipore Bioscience Research Reagents) did not survive the decalcification process required to reliably dissect entire cochleas from base to apex. Cochlear lengths were obtained for each case, and a cochlear frequency map computed to precisely localize inner hair cells (IHCs) from the 5.6, 8.0, 11.3, 22.6, 32, 45.2 and 64 kHz regions in each case. Confocal z-stacks of these 7 regions from each ear were obtained using a high-resolution [1.4 numerical aperture (N.A.)] oil-immersion objective and 2× digital zoom on a Leica TCS SP2. Care was taken to span the entire synaptic pole of the hair cells in the z-dimension, with a z-step-size of 0.25 mm, from the subjacent inner spiral bundle to the apical most ribbon or nerve terminal in the supranuclear region. Image stacks were ported to image-processing software (Amira: Visage Imaging), where synaptic ribbons were counted and divided by the total number of IHC nuclei in the microscopic field (including fractional estimates, when necessary, at the apical and basal ends of the image stack). To avoid underestimating ribbon counts due to superposition in the image stacks, three-dimensional (3-D) renderings were produced, using the “isosurface” feature in Amira, and rotated to disambiguate the xy projection images.
Histologic preparation and ganglion cell counts.
For quantification of SGC death, animals were intravascularly perfused with a buffered solution of glutaraldehyde and paraformaldehyde. The temporal bones were removed, postfixed, osmicated, decalcified (0.1 m EDTA), dehydrated and embedded in Araldite in a strictly stereotyped orientation. Serial sections (40 μm thickness) were cut and mounted on microscope slides, and the precisely mid-modiolar section through the upper basal turn was identified: this area is known from 3-D reconstruction and cochlear mapping to correspond to the 32 kHz region. Using high-N.A. oil-immersion objectives and DIC optics, Rosenthal's canal in this cochlear region was live-imaged with a digital camera interfaced to Neurolucida software (MicroBrightField). Although the ganglion cell region appears darkly stained when viewed with low-power objectives, individual cells could be easily resolved with high-power objectives and high illumination levels (Supplemental Fig. 1, available at www.jneurosci.org as supplemental material). A mask corresponding to a rectangle 90 × 60 μm was superimposed on the image, and all ganglion cells with a nucleolus within that area (throughout the entire section thickness) were counted. Accuracy was insured by using the software to place a small marker at the xy position of each nucleolus, while repeatedly rolling the focus to image the entire depth of the section. To correct for possible variation in section thickness, the cell counts were divided by the true thickness of each section, as determined by imaging the top and bottom surface with DIC optics and reading output values of the calibrated z-axis sensor.
Results
In the mammalian inner ear (Fig. 1), the two classes of sensory cells have different roles: IHCs act as mechanoelectric transducers, releasing neurotransmitter to excite the sensory fibers of the cochlear nerve, whereas outer hair cells (OHCs) act as biological motors to amplify motion of the sensory epithelium. We use two complementary techniques for assessing cochlear function and the degree of noise-induced threshold shift in mice. When combined, they allow differential diagnosis of OHC versus IHC/neuronal dysfunction throughout the cochlea, from the low-frequency apical turn to the high-frequency basal tip.
The auditory brainstem response (ABR) and the compound action potential (CAP), measured from scalp or round-window electrodes respectively, are sound-evoked potentials generated by neuronal circuits in the ascending auditory pathways: the first ABR or CAP wave represents summed activity of the cochlear nerve (Buchwald and Huang, 1975; Antoli-Candela and Kiang, 1978). ABRs can be recorded noninvasively at serial postexposure times. Although more invasive, the CAP potentials have a larger signal-to-noise ratio, and therefore can be a more sensitive indicator of subtle abnormalities.
To complement these measures of cochlear output, we assess OHC function via DPOAEs, which can be measured in the ear-canal sound pressure (Shera and Guinan, 1999). When two tones are presented to the normal ear, distortion components at additional frequencies are produced in the hair cell receptor potentials that can drive the OHCs' biological motors to move the sensory epithelium at the distortion frequencies. The resultant pressure waves from the motion of the epithelium are conducted back through the middle ear to the eardrum, which moves like a loudspeaker diaphragm to produce DPOAEs, which can be measured in the ear canal.
Noise-induced decrements in cochlear neural responses without changes in hair cell function
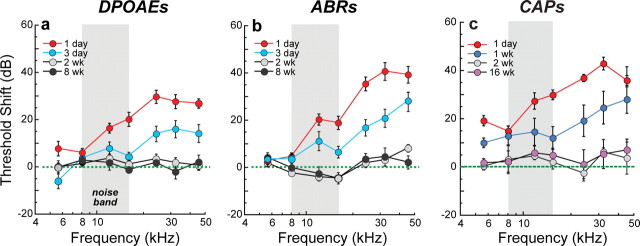
We adjusted the sound level and duration of an octave-band noise exposure to produce a moderate, but reversible, threshold elevation. At 24 h postexposure, this 2 h long, 100 dB SPL noise-band produced a 40 dB elevation of neural response thresholds (ABRs, CAPs) at high frequencies (Figs. 2 b,c) coupled with slightly smaller threshold elevations in DPOAEs (Fig. 2 a), suggesting substantial OHC dysfunction and an additional contribution of neural damage. Indeed, swelling of the peripheral terminals of cochlear nerve fibers in the IHC area is seen following these exposures (Wang et al., 2002). The upward spread of cochlear damage with respect to the exposure spectrum (Fig. 2) is typical of acoustic injury (Cody and Johnstone, 1981) and is well explained by level-dependent nonlinearities in cochlear mechanics (Robles and Ruggero, 2001). By 2 weeks postexposure, response thresholds returned to normal preexposure values and remained stable 8–16 weeks later (Fig. 2).
Figure 2.
The level and duration of an acoustic overexposure were adjusted so that cochlear thresholds were elevated for several days before returning to normal. a–c, A 2 h exposure to an octave-band (8–16 kHz) noise at 100 dB SPL produced ∼40 dB maximum threshold shifts 1 d postexposure that recovered by 2 weeks to normal preexposure values, as assessed via DPOAEs (a), ABRs (b), and CAPs (c). Thresholds are expressed re age-matched unexposed controls. Group means ± SEMs are shown: n = 6–21 ears per group. ABR and DPOAE measurements are from the same animals; CAP thresholds are from a separate group.
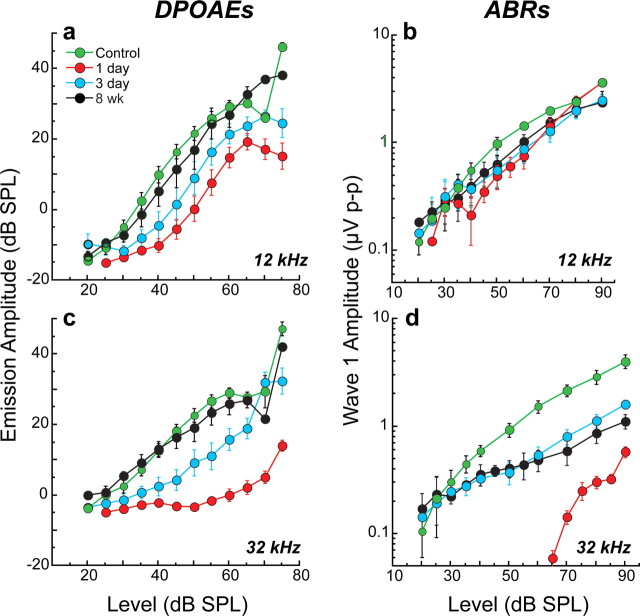
Although threshold sensitivity recovered, suprathreshold response decrements suggested loss of neurons in some cochlear regions (Fig. 3). At 32 kHz, where acute threshold shifts were large (Fig. 2), ABR amplitudes recovered to only ∼40% of preexposure values (Fig. 3 d), whereas at 12 kHz, where initial shifts were small, amplitude recovery was more complete (∼80%) (Fig. 3 b). In contrast, the amplitude-versus-level functions for the DPOAEs recovered completely at all test frequencies: mean data for 12 and 32 kHz are shown Figure 3, a and c, respectively. This neural response decrement coupled with full recovery of DPOAE amplitudes suggests neuronal loss in high-frequency regions, despite complete OHC recovery.
Figure 3.
Despite threshold recovery, suprathreshold neural responses at high frequencies were permanently attenuated, although recovery of otoacoustic emissions suggests cochlear sensory cells are normal. b, d, At 8 weeks postexposure, suprathreshold amplitudes of ABR wave 1, the far-field response of the cochlear nerve, were less than half their preexposure values (d) in regions where temporary threshold shift was maximal (Fig. 2: 32 kHz), but recovered more completely (b) where initial shifts were less severe (Fig. 2: 12 kHz). a, c, In contrast, mean DPOAE amplitudes returned to normal by 8 weeks postexposure at both 12 kHz (a) and 32 kHz (c), suggesting complete recovery of OHC function, endolymphatic potentials, and cochlear mechanics. Together, these data suggest a primary loss of afferent innervation in the 32 kHz region. Group means ± SEMs are shown: n = 7–21 ears per group.
Noise-induced neural degeneration without loss of hair cells
Control ears
To quantify degeneration of cochlear hair cells and nerve terminals, and the synapses that connect them, we used confocal imaging of the sensory epithelium. As schematized in Figure 1, synapses were rendered visible by immunostaining for a component of the presynaptic “ribbon” (CtBP2), a structure characteristic of hair cell afferent synapses and likely involved in vesicle delivery to the active zone (Khimich et al., 2005). To assess cochlear nerve terminals, we used either anti-neurofilament immunostaining (Figs. 4, 5), to reveal all the unmyelinated nerve fibers in the sensory epithelium, or anti-parvalbumin (a calcium buffer), which stains only the terminal swellings of cochlear nerve fibers under the IHCs (Fig. 6). Antibodies to the postsynaptic glutamate receptors (AMPA-type) that are present in cochlear nerve terminals (Matsubara et al., 1996) work well only in lightly fixed and undecalcified tissue, from which it is impossible to dissect the basal half of the cochlea, where the major noise-induced damage is seen.
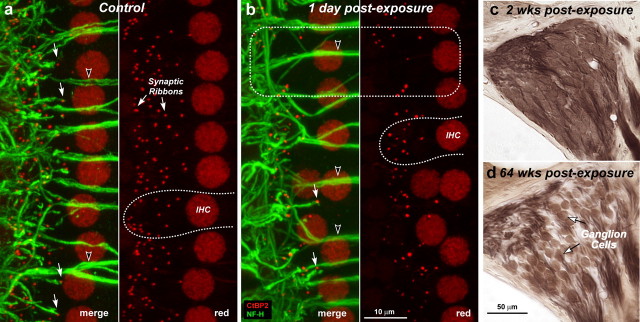
Figure 4.
a–d, Despite reversibility of threshold shift and intact sensory cells, noise-exposed ears show rapid loss of cochlear synaptic terminals (a, b) and delayed loss of cochlear ganglion cells (c, d). Immunostaining reveals synaptic ribbons (red, anti-CtBP2) and cochlear nerve dendrites (green, anti-neurofilament) in the IHC area of a control (a) and an exposed (b) ear at 1 d post noise. Outlines of selected IHCs are indicated (a, b: dashed lines); the position of IHC nuclei is more irregular in the traumatized ears. Each confocal image (a, b) is the maximum projection of a z-series spanning the IHC synaptic region in the 32 kHz region: the viewing angle is from the epithelial surface (see Fig. 1). Each image pair (red/merge) shows the same confocal projection without, or with, the green channel, respectively. Merged images show juxtaposed presynaptic ribbons and postsynaptic terminals, in both control and exposed ears (a, b: filled arrows), and the lack of both in denervated regions (b: dashed box). Anti-CtBP2 also stains IHC nuclei; anti-neurofilament also stains efferent axons to OHCs (a, b: unfilled arrowheads). Cochlear sections show normal density of ganglion cells 2 weeks postexposure (c) compared with diffuse loss after 64 weeks (d): both images are from the 32 kHz region of the cochlea.
Figure 5.
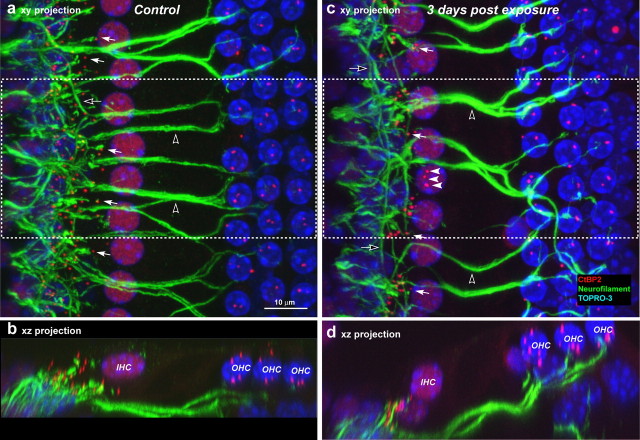
Double-staining for anti-neurofilament (green) and anti-CtBP2 (red) suggests cochlear nerve terminals have disappeared where there is loss of synaptic ribbons. a–d, Tissues double stained for anti-neurofilament (green) and anti-CtBP2 (red) are shown as confocal projections of the 45 kHz region from a control (a, b) and an exposed (c, d) ear 3 d after noise; viewed from the surface of the sensory epithelium (xy projections in a, c) and in cross-section views (xz projection, b, d) of half the extent in the x dimension (dashed box). The dramatic reduction in cochlear terminals is especially clear in the xz projections. In the xy projections, filled arrows indicate some of the synaptic ribbons paired with nerve terminals; filled arrows (c) point to three ribbons that are displaced from the basolateral IHC membrane and appear uncoupled from nerve terminals. Open arrows (a, c) point to spiraling efferent axons in the inner spiral bundle and the open arrowheads show efferents to OHCs crossing the tunnel of Corti. Scale bar in a applies to all panels.
Figure 6.
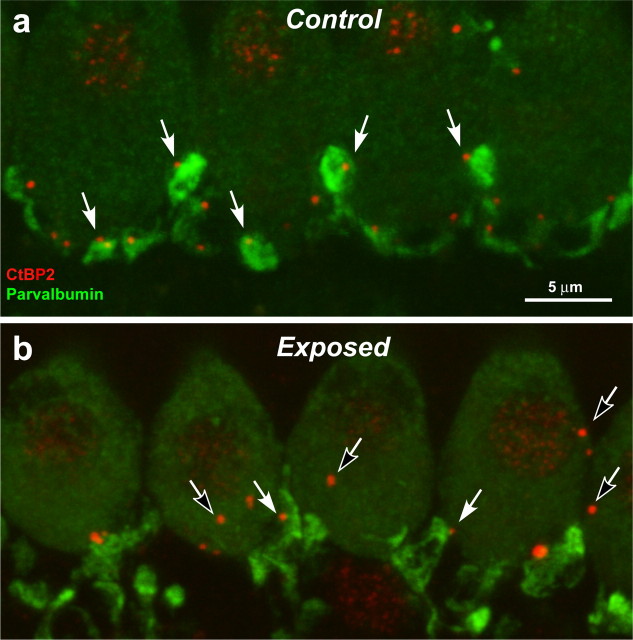
Immunostaining cochlear-nerve terminal swellings suggests that ribbon counts underestimate the degree of IHC denervation. a, b, These confocal projections of the IHC area in the 45 kHz region of a control ear (a) and an ear 3 d postexposure (b) are immunostained with anti-parvalbumin (green), which stains terminal swellings, and anti-CtBP2 (red), which stains synaptic ribbons. In the control ear, there is close to a one-for-one relation between ribbons and terminals (e.g., filled arrows). In the exposed ear, almost all terminals are near a ribbon (e.g., filled arrows); however, some ribbons are not paired with terminals (e.g., unfilled arrows): some appear intracellular, i.e., far from the IHC membrane. The vacuolization of terminals in the exposed ear is part of the acute excitotoxic response to overstimulation (Wang et al., 2002).
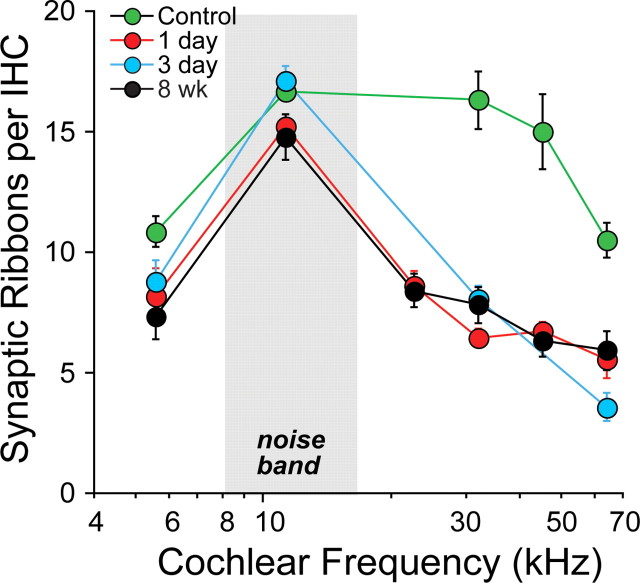
In the mammalian cochlea, outside of the extreme apex, >95% of cochlear nerve fibers are unbranched, contacting a single IHC via a single terminal swelling (Fig. 1), with a single active zone at which a single presynaptic ribbon is tethered to the IHC membrane (Liberman et al., 1990). Thus, ribbon counts in normal ears provide an accurate metric of the IHC afferent innervation. In 11 control ears, we used confocal z-stacks (Fig. 4 a) to count synaptic ribbons in five cochlear regions (from apex to base), converting cochlear location to cochlear frequency according to the map for the mouse (Taberner and Liberman, 2005). Mean counts in control ears showed a broad peak of ∼17 ribbons/IHC in mid-cochlear regions, declining to ∼10 ribbons/IHC toward the apical and basal ends (Fig. 7). These values closely match electron-microscopic counts of afferent synapses (mean = 16.8/IHC) from serial sections of IHCs in mid-cochlear regions of the mouse (Stamataki et al., 2006) and ribbon counts versus cochlear place determined by confocal microscopy (Meyer et al., 2009).
Figure 7.
Synaptic ribbon counts in six cochlear regions of control and noise-exposed ears show synaptic loss throughout the basal half of the cochlea. Mean numbers (±SEMs) of synaptic ribbons per IHC were computed from confocal z-stacks such as those in Figure 2 from control ears (n = 11) and exposed ears at 6 cochlear locations and 4 postexposure times: 1 d (n = 6), 3 d (n = 5), and 8 weeks (n = 6).
The neurofilament/CtBP2 double-immunostain reveals the normal relation between cochlear nerve terminals and hair cell synaptic ribbons. In the control ear, almost all IHC ribbons are coupled with a nerve terminal, if they are sufficiently isolated to be resolvable (Figs. 4 a and 5 a, filled arrows). Since neurofilaments do not fill the terminal swellings, we also used antibodies against parvalbumin (Fig. 6 a), which does fill them. The parvalbumin immunostaining reveals a one-for-one relation between terminal swellings and ribbons in the control ear (for some ribbons, the associated terminals are in deeper focal planes). These light-microscopic observations of a one-for-one coupling between ribbons and terminals are consistent with conclusions from serial section ultrastructural studies in both cat (Liberman, 1980b) and mouse (Stamataki et al., 2006).
Noise-exposed ears
In noise-exposed ears, there was no loss of hair cells, either IHCs or OHCs, at any postexposure time out to at least 1 year. Images from 1 and 3 d postexposure show the normal array of nuclei in both IHC and OHC areas: since anti-CtBP2 also stains IHC nuclei, they appear red in Figure 4; when a fluorescent nuclear stain is added (blue channel: TOPRO-3), IHC nuclei appear purple, and the three rows of OHC nuclei are blue (Fig. 5). Stereocilia bundles appeared normal at the light microscopic level, even at 24 h postexposure (Supplemental Fig. 2, available at www.jneurosci.org as supplemental material), when the temporary threshold shifts were 20–40 dB (Fig. 2).
Despite the normal hair cell populations, there was dramatic degeneration of both presynaptic and postsynaptic elements in the IHC area throughout the high-frequency (basal) half of the cochlea. This degeneration was observed at all postexposure times, beginning at 24 h, the earliest time examined. Presynaptic ribbons were decreased in number, many remaining ribbons were abnormally large, and some ribbons were displaced away from the basolateral IHC membrane toward the cell nucleus (Figs. 4 b, 5 c). Ribbons were counted in at least five cochlear regions from noise-exposed ears at three postexposure times from 1 d to 8 weeks (Fig. 7). In the 32 kHz region of noise-exposed ears, where acute threshold shifts were greatest (Fig. 2) and where persistent ABR amplitude decrements suggested significant neuronal loss (Fig. 3 d), ribbon counts were reduced from ∼16 to <7/IHC at 24 h postexposure. Numbers had not recovered 8 weeks later. In contrast, in the 12 kHz region, where initial threshold shifts were small (Fig. 2), and amplitude recovery was essentially complete (Fig. 3 b), decreases in ribbon number in the noise-exposed ears were correspondingly small (Fig. 7). Ribbons in the OHC area appeared unchanged in number and morphology in all cochlear regions at all survival times (Fig. 5 a,c).
In noise-exposed ears, fiber density in the IHC area was reduced, at all postexposure times, in proportion to the loss of ribbons. Although the terminal plexus under each IHC is too complicated to allow fiber counts or other quantitative measures, the decreased density of neurofilament-positive elements is obvious to qualitative assessment (Figs. 4 b, 5 c). The proportional loss of ribbons and terminals is particularly clear in xy projections in regions where ribbon counts are especially reduced (Fig. 4 b, e.g., dashed box) and in the xz projections where the organ of Corti is viewed in cross-section (Figs. 5 b,d). Note that many of the remaining neurofilament-positive elements in the noise-exposed ears are efferent fibers from the olivocochlear bundle (Fig. 1), which appear unaffected: the thick fibers crossing the tunnel of Corti (Figs. 4 and 5, open arrowheads) are medial olivocochlear neurons projecting to OHCs (Spoendlin and Gacek, 1963), and the thin fibers spiraling under the IHCs (Fig. 5, unfilled arrows) are lateral olivocochlear fibers in the inner spiral bundle targeting cochlear nerve dendrites (Liberman, 1980a).
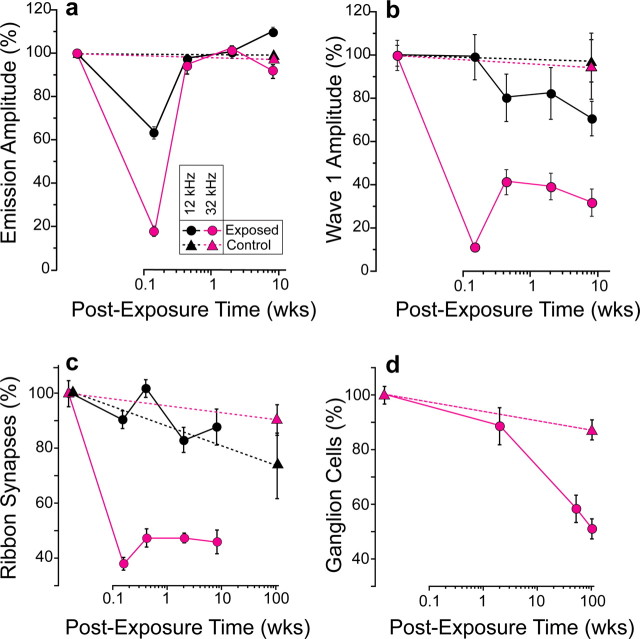
The ribbon counts in noise-exposed ears may underestimate the neural degeneration, because many ribbons included in these counts are far from the basolateral membrane (Fig. 5 c, filled arrowheads) and thus not at active zones where terminals are present. The parvalbumin staining shows that, in exposed ears, some of the ribbons we count lack apposed terminals (Fig. 6 b, open arrows), yet very few terminal swellings lack apposed ribbons. Such an underestimation is supported by the quantitative comparisons between neural response decrements and ribbon losses summarized in Figure 8: 8 weeks postexposure, neural amplitudes were decreased by >60% at 32 kHz, whereas ribbon counts were decreased by ∼50%; at 12 kHz, response amplitudes were reduced by ∼30%, whereas ribbon counts were decreased by ∼10%. Similar results were seen in the cochlear nerve CAPs, where amplitudes remained depressed by >60% out to at least 64 weeks postexposure (data not shown). In contrast, OHC-based DPOAE amplitudes (Fig. 8 a) returned to normal values within days of exposure and remained stable over the period of postexposure monitoring.
Figure 8.
a–d, Normalized functional and histopathological metrics versus postexposure time show a close match between synaptic loss (c) and loss of neural amplitudes (b); ganglion cell loss (d) is significantly delayed and hair cell responses (a) return to normal. There is a close match between synaptic loss (c) and loss of neural amplitudes (b); ganglion cell loss (d) is significantly delayed and hair cell responses (a) return to normal. Suprathreshold response amplitudes (a, b) are for 80 dB SPL; complete growth functions are in Figure 3. Values are expressed as a percentage of control means (± SEMs, n = 7–21 per group). Loss of ribbons was quantified (c) by comparing age-matched controls (n = 11) to exposed ears at four postexposure times: 1 d (n = 6), 3 d (n = 5), 2 weeks (n = 4), and 8 weeks (n = 6). Data from two cochlear regions are shown: 12 kHz and 32 kHz (see key). To control for aging, ribbons were counted in unexposed 104 week animals (n = 3: triangles in c). Loss of ganglion cells (d) was quantified at the 32 kHz place in control (n = 7) and exposed ears at 3 postexposure times: 2 weeks (n = 6), 52–64 weeks (n = 7) and 104 weeks (n = 6). To control for aging, cells were counted in unexposed 104 week animals (n = 12: triangles in e). For all counts (c, d), means ± SEMs are shown, and data are expressed as a percentage of values from unexposed 16 week animals.
Although the loss of peripheral terminals of the cochlear neurons was rapid, the death of the cell and the disappearance of the somata were extremely slow. To evaluate this delayed neural degeneration, we counted SGCs in tissue sections (Supplemental Fig. 1, available at www.jneurosci.org as supplemental material) from separate groups of noise-exposed animals. As quantified in Figure 8 d, ganglion cell numbers in the 32 kHz region were close to normal at 2 weeks postexposure. However, by ∼1 year, dramatic loss was seen throughout the basal turn in every ear (Figs. 4 d, 8 d), and by 2 years, cell counts near the 32 kHz region had decreased by ∼50% (Fig. 8 d), comparable to ribbon losses seen in the first 24 h after exposure (Figs. 7, 8 c). Hair cell populations remained intact in corresponding regions. Ganglion cell loss was modest (<10%) in unexposed, aging animals (Fig. 8 d, triangles), mirrored by similarly modest age-related decreases in both IHC ribbon counts (Fig. 8 c, triangles) and suprathreshold neural responses (data not shown).
Discussion
Threshold recovery despite neuronal loss: resolving the paradox
The rapid postexposure loss of presynaptic ribbons and postsynaptic terminals documented here must functionally silence the affected neurons, despite complete recovery of hair cell function. Such a conclusion is supported by the parity (Fig. 8) between the degree of ribbon loss and the fractional decrement in neural response amplitudes in the affected high-frequency cochlear regions. Such neurodegeneration is not inconsistent with the observed recovery of threshold sensitivity. Thresholds for sound-evoked neural potentials are insensitive to diffuse neuronal loss (Liberman et al., 1997; El-Badry and McFadden, 2007), so long as hair cells, particularly OHCs, are functioning normally. Behavioral thresholds also are unaffected by diffuse neuronal loss, as seen in a study of trained cats before and after partial section of the cochlear nerve (Schuknecht and Woellner, 1953).
To understand why neural degeneration is reflected in neural response amplitudes (Fig. 3 d), but not thresholds (Fig. 2), consider that threshold is defined by a criterion response amplitude, just above the measurement noise floor (∼0.1 μV for mouse ABRs: Fig. 3 b,d). With a criterion of 0.25 μV, thresholds are increased by <5 dB at 8 weeks postexposure (Fig. 3 d), although amplitudes are reduced by >50%. Consider also that ABR amplitude is a function of both the sound-evoked discharge probability of each responding fiber and the number of fibers responding synchronously (Kiang et al., 1976). Thus, diffuse loss of half the cochlear nerve and the resultant 50% decrease in response amplitude, can be compensated either by doubling the discharge rates in remaining neurons or doubling the number of neurons responding. Either of these compensatory increases is accomplished with only a few dB increase in stimulus level, because, discharge rate in cochlear neurons climbs steeply near threshold, and activity spreads quickly to neurons with higher or lower best frequencies (Taberner and Liberman, 2005).
Although DPOAE and ABR thresholds are sensitive metrics of hair cell damage, they are quite insensitive to “primary” neuronal degeneration, i.e., loss of cochlear neurons without loss of hair cells. Practically, using threshold as a high-throughput screening tool for deafness phenotype, e.g., in mutagenesis studies (Kermany et al., 2006), selects against discovery of primary neuronal disorders, thereby reinforcing the sense that such disorders are rare, compared to the “secondary” neuronal degeneration seen weeks and months after IHC death. Behavioral thresholds, too, can fail to provide evidence of underlying neurodegeneration (Schuknecht and Woellner, 1953). Thus, dependence on this measure, alone, to quantify noise-induced damage in humans is seriously flawed.
Primary versus secondary degeneration: how primary loss has gone unnoticed
After high-level noise exposure, hair cell loss can be seen in minutes to hours, whereas SGC loss is not seen for weeks to months (Spoendlin, 1971; Johnsson, 1974; Lawner et al., 1997). This difference in degenerative time course, and the correlation, in long-surviving ears, between regions of hair cell loss (particularly IHCs) and regions of SGC death (Liberman and Kiang, 1978), has suggested that hair cells are the primary targets of acoustic overexposure, whereas noise-induced SGC death occurs only as a secondary event to the loss of hair cells and, perhaps, of the neurotrophins they provide (Glueckert et al., 2008).
In contrast, the present results show that noise-induced SGC death can be extensive despite a normal hair cell complement. Prior evidence for direct noise-induced neuronal damage has not been lacking. Swelling of cochlear nerve terminals is seen in the IHC area 24–48 h after overexposure, even when threshold shifts are ultimately reversible (Liberman and Mulroy, 1982; Robertson, 1983). The same acute swelling is observed after cochlear perfusion of glutamate agonists, and the same recovery of cochlear neural thresholds has been noted (Zheng et al., 1997, 1999). Based on the lack of swollen terminals at longer survivals, the recovery of threshold sensitivity, and the occasional presence of growth-cones in damaged ears (Puel et al., 1998), previous studies have suggested that noise- or drug-damaged terminals either recover or regenerate (Pujol et al., 1993; Zheng et al., 1997; Puel et al., 1998; Pujol and Puel, 1999; Zheng et al., 1999; Ruel et al., 2007). However, neuronal counts were not made, and ears were not followed for extended postexposure times.
The present quantitative analysis of hair cell synapses, cochlear nerve terminals and SGCs suggests a different view, i.e., that the acute noise-induced damage to cochlear nerve terminals is irreversible in the adult, and that there is minimal nerve regeneration or renewed synaptogenesis after noise. Significant terminal regrowth and reconnection can be seen in neonatal cochleas in vitro after chemically mediated neurodegeneration (Brugeaud and Edge, 2009). In the adult ear, however, the close agreement between the acute loss of synapses/terminals and the delayed loss of cell bodies suggests that the long-term fate of SGCs is sealed within the first 24 h postexposure, although it may take years for the cells to degenerate. We previously observed a slow-onset loss of SGCs in exposed ears with damaged, but surviving, hair cells and a corresponding permanent noise-induced hearing loss of ∼40 dB (Kujawa and Liberman, 2006). Lacking knowledge of the rapid synaptic changes revealed here, we viewed this slow neurodegeneration as an age/noise interaction of indeterminate origin. Confocal analysis has since revealed a similar degree of acute synaptic degeneration (data not shown), suggesting that, whether or not surviving hair cells recover, noise-induced slow-onset primary neural degeneration may always be preceded by rapid loss of synaptic terminals.
Together, these observations suggest that much noise-induced degeneration of the cochlear nerve is primary, in that it will occur in the absence of hair cell damage. Such primary neural loss may never exceed 50–60% (the most we have observed), thus the less vulnerable 40–50% may die only secondarily to loss of hair cells or supporting cells in the organ of Corti.
Mechanisms of rapid synaptic loss versus slow neuronal death
The immunostaining patterns in our noise-exposed ears suggest that, within hours after an exposure at the limits of threshold-shift reversibility, roughly half the presynaptic ribbons disappear from IHCs, along with a corresponding proportion of the (unmyelinated) postsynaptic afferent terminals that formerly contacted them. At this early postexposure time, there is no obvious loss of myelinated peripheral axons. Thus, the terminal retraction apparently proceeds only as far centrally as the first node of Ranvier, where it pauses, before continuing in a second wave of degeneration in which the peripheral axon disappears (Liberman and Kiang, 1978). Several observations suggest that this terminal damage arises from a type of excitotoxicity involving AMPA receptors at these glutamatergic afferent synapses: (1) the phenomenon can be mimicked by cochlear perfusion of exogenous glutamate receptor agonists such as AMPA and kainate (Pujol et al., 1993), (2) it can be blocked by antagonists of AMPA receptor-mediated transmission (Ruel et al., 2000); and (3) it is not seen in the OHC area (Robertson, 1983), where, correspondingly, AMPA receptors are not expressed (Matsubara et al., 1996).
Once the terminal has retracted, the slow-onset degeneration of the cell body and axons may result from withdrawal of the neurotrophin signaling among hair cells, supporting cells and nerve terminals. In the cochlea, the key neurotrophin, NT-3, is expressed by IHCs and their support cells in response to neuregulin released by the neurons. Blockade of this signaling pathway, by dominant-negative neuregulin receptors in supporting cells leads to primary neuronal degeneration (Stankovic et al., 2004). Retraction of peripheral terminals after noise damage may suppress the neurotrophin cascade by increasing the distance between the ligand release sites and their respective receptors on neurons and epithelial cells in the organ of Corti. The reasons for the extremely slow time course remain unclear.
Relevance to sensorineural hearing loss in humans
The primary neural degeneration described here likely occurs in noise-exposed human ears as well: (1) acute noise-induced swelling of cochlear-nerve terminals has been observed in every mammal studied, including cat (Liberman and Mulroy, 1982), guinea pig (Robertson, 1983; Pujol et al., 1993) and mouse (Wang et al., 2002); (2) the mouse strain we use (CBA/CaJ) has noise vulnerability typical of other mammals (Yoshida et al., 2000); and (3) the same synaptic loss without hair cell damage is seen in guinea pigs after an exposure at the limit of threshold reversibility (data not shown). Indeed, human SGC counts decline dramatically with age (Otte et al., 1978) and can be seen in areas remote from regions of threshold elevation (Felder and Schrott-Fischer, 1995). Since IHC sensory fibers constitute 95% of the cochlear nerve (Spoendlin, 1972), dysfunction in this neural population must have important consequences for hearing, even if threshold sensitivity recovers. Loss of cochlear neurons should decrease the robustness of stimulus coding in low signal-to-noise conditions, for example speech in noise, where spatial summation via convergence of activity from groups of neurons must be important in signal processing. Peripheral neurodegeneration also can lead to changes in brainstem circuitry and cortical reorganization, with overrepresentation of surviving cochlear regions (Irvine et al., 2000). These changes may contribute to other postexposure perceptual anomalies, including tinnitus (perception of phantom sounds) and hyperacusis (intolerance of moderately intense stimuli), classic sequelae of sound overexposure that can occur with or without threshold elevation (Bauer et al., 2007; Eggermont, 2007).
It is sobering to consider that normal threshold sensitivity can mask ongoing and dramatic neural degeneration in noise-exposed ears, yet threshold sensitivity represents the gold standard for quantifying noise damage in humans. Federal exposure guidelines (OSHA, 1974; NIOSH, 1998) aim to protect against permanent threshold shifts, an approach that assumes that reversible threshold shifts are associated with benign levels of exposure. Moreover, lack of delayed threshold shifts after noise has been taken as evidence that delayed effects of noise do not occur (Humes et al., 2005). The present results contradict these fundamental assumptions by showing that reversibility of noise-induced threshold shifts masks progressive underlying neuropathology that likely has profound long-term consequences on auditory processing. The clear conclusion is that noise exposure is more dangerous than has been assumed.
Footnotes
Research was supported by grants from the National Institute on Deafness and Other Communicative Disorders (R01 DC8577, RO1 DC0188, P30 DC5209) and by a generous donation from Steve and Andrea Kaneb.
References
- Antoli-Candela F, Jr, Kiang NYS. Unit activity underlying the N1 potential. In: Naunton RF, Fernández C, editors. Evoked electrical activity in the auditory nervous system. New York: Academic; 1978. pp. 165–191. [Google Scholar]
- Bauer CA, Brozoski TJ, Myers K. Primary afferent dendrite degeneration as a cause of tinnitus. J Neurosci Res. 2007;85:1489–1498. doi: 10.1002/jnr.21259. [DOI] [PubMed] [Google Scholar]
- Brugeaud A, Edge AS. Characterization of in vitro regenerated synapses between auditory neurons and hair cells. Paper presented at the MidWinter Meeting of the Association for Research in Otolaryngology; February; Baltimore, MD. 2009. [Google Scholar]
- Buchwald JS, Huang C. Far-field acoustic response: origins in the cat. Science. 1975;189:382–384. doi: 10.1126/science.1145206. [DOI] [PubMed] [Google Scholar]
- Cody AR, Johnstone BM. Acoustic trauma: single neuron basis for the “half-octave shift”. J Acoust Soc Am. 1981;70:707–711. doi: 10.1121/1.386906. [DOI] [PubMed] [Google Scholar]
- DHHS. Washington, DC: U.S. Department of Health and Human Services; 2009. Healthy people 2010: understanding and improving health (Services USDoHaH, ed) Available at http://www.healthypeople.gov/Document/ [Google Scholar]
- Eggermont JJ. Pathophysiology of tinnitus. Prog Brain Res. 2007;166:19–35. doi: 10.1016/S0079-6123(07)66002-6. [DOI] [PubMed] [Google Scholar]
- El-Badry MM, McFadden SL. Electrophysiological correlates of progressive sensorineural pathology in carboplatin-treated chinchillas. Brain Res. 2007;1134:122–130. doi: 10.1016/j.brainres.2006.11.078. [DOI] [PMC free article] [PubMed] [Google Scholar]
- Felder E, Schrott-Fischer A. Quantitative evaluation of myelinated nerve fibres and hair cells in cochleae of humans with age-related high-tone hearing loss. Hear Res. 1995;91:19–32. doi: 10.1016/0378-5955(95)00158-1. [DOI] [PubMed] [Google Scholar]
- Glueckert R, Bitsche M, Miller JM, Zhu Y, Prieskorn DM, Altschuler RA, Schrott-Fischer A. Deafferentation-associated changes in afferent and efferent processes in the guinea pig cochlea and afferent regeneration with chronic intrascalar brain-derived neurotrophic factor and acidic fibroblast growth factor. J Comp Neurol. 2008;507:1602–1621. doi: 10.1002/cne.21619. [DOI] [PubMed] [Google Scholar]
- Humes L, Joellenbeck L, Durch J. Washington, DC: National Academies; 2005. Noise and military service: implications for hearing loss and tinnitus. Available at http://www.iom.edu/CMS/3795/20024/29957.aspx. [Google Scholar]
- Irvine DR, Rajan R, McDermott HJ. Injury-induced reorganization in adult auditory cortex and its perceptual consequences. Hear Res. 2000;147:188–199. doi: 10.1016/s0378-5955(00)00131-3. [DOI] [PubMed] [Google Scholar]
- Johnsson LG. Sequence of degeneration of Corti's organ and its first-order neurons. Ann Otol Rhinol Laryngol. 1974;83:294–303. doi: 10.1177/000348947408300303. [DOI] [PubMed] [Google Scholar]
- Kermany MH, Parker LL, Guo YK, Miller D, Swanson DJ, Yoo TJ, Goldowitz D, Zuo J. Identification of 17 hearing impaired mouse strains in the TMGC ENU-mutagenesis screen. Hear Res. 2006;220:76–86. doi: 10.1016/j.heares.2006.07.011. [DOI] [PubMed] [Google Scholar]
- Khimich D, Nouvian R, Pujol R, Tom Dieck S, Egner A, Gundelfinger ED, Moser T. Hair cell synaptic ribbons are essential for synchronous auditory signalling. Nature. 2005;434:889–894. doi: 10.1038/nature03418. [DOI] [PubMed] [Google Scholar]
- Kiang NYS, Moxon EC, Kahn AR. The relationship of gross potentials recorded from the cochlea to single unit activity in the auditory nerve. In: Ruben RJ, Eberling C, Solomon G, editors. Electrocochleography. Baltimore: University Park; 1976. [Google Scholar]
- Kujawa SG, Liberman MC. Acceleration of age-related hearing loss by early noise exposure: evidence of a misspent youth. J Neurosci. 2006;26:2115–2123. doi: 10.1523/JNEUROSCI.4985-05.2006. [DOI] [PMC free article] [PubMed] [Google Scholar]
- Lawner BE, Harding GW, Bohne BA. Time course of nerve-fiber regeneration in the noise-damaged mammalian cochlea. Int J Dev Neurosci. 1997;15:601–617. doi: 10.1016/s0736-5748(96)00115-3. [DOI] [PubMed] [Google Scholar]
- Liberman MC. Efferent synapses in the inner hair cell area of the cat cochlea: An electron microscopic study of serial sections. Hear Res. 1980a;3:189–204. doi: 10.1016/0378-5955(80)90046-5. [DOI] [PubMed] [Google Scholar]
- Liberman MC. Morphological differences among radial afferent fibers in the cat cochlea: An electron-microscopic study of serial sections. Hear Res. 1980b;3:45–63. doi: 10.1016/0378-5955(80)90007-6. [DOI] [PubMed] [Google Scholar]
- Liberman MC, Dodds LW. Single-neuron labeling and chronic cochlear pathology. III. Stereocilia damage and alterations of threshold tuning curves. Hear Res. 1984;16:55–74. doi: 10.1016/0378-5955(84)90025-x. [DOI] [PubMed] [Google Scholar]
- Liberman MC, Kiang NY. Acoustic trauma in cats. Cochlear pathology and auditory-nerve activity. Acta Otolaryngol. 1978;358(Suppl):1–63. [PubMed] [Google Scholar]
- Liberman MC, Mulroy MJ. Acute and chronic effects of acoustic trauma: cochlear pathology and auditory nerve pathophysiology. In: Hamernik RP, Henderson D, Salvi R, editors. New perspectives on noise-induced hearing loss. New York: Raven; 1982. pp. 105–136. [Google Scholar]
- Liberman MC, Chesney CP, Kujawa SG. Effects of selective inner hair cell loss on DPOAE and CAP in carboplatin-treated chinchillas. Aud Neurosci. 1997;3:255–268. [Google Scholar]
- Liberman MC, Dodds LW, Pierce S. Afferent and efferent innervation of the cat cochlea: quantitative analysis with light and electron microscopy. J Comp Neurol. 1990;301:443–460. doi: 10.1002/cne.903010309. [DOI] [PubMed] [Google Scholar]
- Matsubara A, Laake JH, Davanger S, Usami S, Ottersen OP. Organization of AMPA receptor subunits at a glutamate synapse: quantitative immunogold analysis of hair cell synapses in the rat organ of Corti. J Neurosci. 1996;16:4457–4467. doi: 10.1523/JNEUROSCI.16-14-04457.1996. [DOI] [PMC free article] [PubMed] [Google Scholar]
- Meyer AC, Frank T, Khimich D, Hoch G, Riedel D, Chapochnikov NM, Yarin YM, Harke B, Hell SW, Egner A, Moser T. Tuning of synapse number, structure and function in the cochlea. Nat Neurosci. 2009;12:444–453. doi: 10.1038/nn.2293. [DOI] [PubMed] [Google Scholar]
- Miller JD, Watson CS, Covell WP. Deafening effects of noise on the cat. Acta Oto-Laryngol. 1963;176(Suppl):1–91. [Google Scholar]
- NIOSH. Criteria for a recommended standard: occupational noise exposure. National Institute for Occupational Safety and Health Publication No 98-126. 1998. Available at http://www.cdc.gov/niosh/docs/98-126/
- OSHA. Occupational noise exposure - 1910.95. Federal Register 23502, June 27, 1974 as amended at 46 FR 4161, Jan. 16, 1981; 46 FR 62845, Dec. 29, 1981; 48 FR 9776, Mar. 8, 1983; 48 FR 29687, June 28, 1983; 54 FR 24333, June 7, 1989; 61 FR 5507, Feb. 13, 1996; 61 FR 9227, March 7, 1996; 71 FR 16672, April, 3, 2006; 73 FR 75584, Dec. 12, 2008. 1974. Available at http://www.osha.gov/pls/oshaweb/owadisp.show_document?p_table=STANDARDS&p_id=9735.
- Otte J, Schuknecht HF, Kerr AG. Ganglion cell populations in normal and pathological human cochleae. Implications for cochlear implantation. Laryngoscope. 1978;LXXXVIII:1231–1246. doi: 10.1288/00005537-197808000-00004. [DOI] [PubMed] [Google Scholar]
- Puel JL, Ruel J, Gervais d'Aldin C, Pujol R. Excitotoxicity and repair of cochlear synapses after noise-trauma induced hearing loss. Neuroreport. 1998;9:2109–2114. doi: 10.1097/00001756-199806220-00037. [DOI] [PubMed] [Google Scholar]
- Puel JL, Ruel J, Guitton M, Pujol R. The inner hair cell afferent/efferent synapses revisited: a basis for new therapeutic strategies. Adv Otorhinolaryngol. 2002;59:124–130. doi: 10.1159/000059250. [DOI] [PubMed] [Google Scholar]
- Pujol R, Puel JL. Excitotoxicity, synaptic repair and functional recovery in the mammalian cochlea: a review of recent findings. Ann N Y Acad Sci. 1999;884:249–254. doi: 10.1111/j.1749-6632.1999.tb08646.x. [DOI] [PubMed] [Google Scholar]
- Pujol R, Puel JL, Gervais d'Aldin C, Eybalin M. Pathophysiology of the glutamatergic synapses in the cochlea. Acta Otolaryngol. 1993;113:330–334. doi: 10.3109/00016489309135819. [DOI] [PubMed] [Google Scholar]
- Robertson D. Functional significance of dendritic swelling after loud sounds in the guinea pig cochlea. Hear Res. 1983;9:263–278. doi: 10.1016/0378-5955(83)90031-x. [DOI] [PubMed] [Google Scholar]
- Robles L, Ruggero MA. Mechanics of the mammalian cochlea. Physiol Rev. 2001;81:1305–1352. doi: 10.1152/physrev.2001.81.3.1305. [DOI] [PMC free article] [PubMed] [Google Scholar]
- Ruel J, Bobbin RP, Vidal D, Pujol R, Puel JL. The selective AMPA receptor antagonist GYKI 5387 blocks action potential generation and excitotoxicity in the guinea pig cochlea. Neuropharmacology. 2000;39:1959–1973. doi: 10.1016/s0028-3908(00)00069-1. [DOI] [PubMed] [Google Scholar]
- Ruel J, Wang J, Rebillard G, Eybalin M, Lloyd R, Pujol R, Puel JL. Physiology, pharmacology and plasticity at the inner hair cell synaptic complex. Hear Res. 2007;227:19–27. doi: 10.1016/j.heares.2006.08.017. [DOI] [PubMed] [Google Scholar]
- Schuknecht HF, Woellner RC. Hearing losses following partial section of the cochlear nerve. Laryngoscope. 1953;63:441–465. doi: 10.1288/00005537-195306000-00001. [DOI] [PubMed] [Google Scholar]
- Shera CA, Guinan JJ., Jr Evoked otoacoustic emissions arise by two fundamentally different mechanisms: a taxonomy for mammalian OAEs. J Acoust Soc Am. 1999;105:782–798. doi: 10.1121/1.426948. [DOI] [PubMed] [Google Scholar]
- Spoendlin H. Primary structural changes in the organ of Corti after acoustic overstimulation. Acta Otolaryng. 1971;71:166–176. doi: 10.3109/00016487109125346. [DOI] [PubMed] [Google Scholar]
- Spoendlin H. Innervation densities of the cochlea. Acta Otolaryng. 1972;73:235–248. doi: 10.3109/00016487209138937. [DOI] [PubMed] [Google Scholar]
- Spoendlin HH, Gacek RR. Electronmicroscopic study of the efferent and afferent innervation of the organ of Corti in the cat. Ann Otol Rhinol Laryngol. 1963;72:661–685. doi: 10.1177/000348946307200307. [DOI] [PubMed] [Google Scholar]
- Stamataki S, Francis HW, Lehar M, May BJ, Ryugo DK. Synaptic alterations at inner hair cells precede spiral ganglion cell loss in aging C57BL/6J mice. Hear Res. 2006;221:104–118. doi: 10.1016/j.heares.2006.07.014. [DOI] [PubMed] [Google Scholar]
- Stankovic K, Rio C, Xia A, Sugawara M, Adams JC, Liberman MC, Corfas G. Survival of adult spiral ganglion neurons requires erbB receptor signaling in the inner ear. J Neurosci. 2004;24:8651–8661. doi: 10.1523/JNEUROSCI.0733-04.2004. [DOI] [PMC free article] [PubMed] [Google Scholar]
- Sun H, Hashino E, Ding DL, Salvi RJ. Reversible and irreversible damage to cochlear afferent neurons by kainic acid excitotoxicity. J Comp Neurol. 2001;430:172–181. doi: 10.1002/1096-9861(20010205)430:2<172::aid-cne1023>3.0.co;2-w. [DOI] [PubMed] [Google Scholar]
- Taberner AM, Liberman MC. Response properties of single auditory nerve fibers in the mouse. J Neurophysiol. 2005;93:557–569. doi: 10.1152/jn.00574.2004. [DOI] [PubMed] [Google Scholar]
- Wang Y, Hirose K, Liberman MC. Dynamics of noise-induced cellular injury and repair in the mouse cochlea. J Assoc Res Otolaryngol. 2002;3:248–268. doi: 10.1007/s101620020028. [DOI] [PMC free article] [PubMed] [Google Scholar]
- Yoshida N, Hequembourg SJ, Atencio CA, Rosowski JJ, Liberman MC. Acoustic injury in mice: 129/SvEv is exceptionally resistant to noise-induced hearing loss. Hear Res. 2000;141:97–106. doi: 10.1016/s0378-5955(99)00210-5. [DOI] [PubMed] [Google Scholar]
- Zheng XY, Henderson D, Hu BH, McFadden SL. Recovery of structure and function of inner ear afferent synapses following kainic acid excitotoxicity. Hear Res. 1997;105:65–76. doi: 10.1016/s0378-5955(96)00188-8. [DOI] [PubMed] [Google Scholar]
- Zheng XY, Salvi RJ, McFadden SL, Ding DL, Henderson D. Recovery of kainic acid excitotoxicity in chinchilla cochlea. Ann N Y Acad Sci. 1999;884:255–269. doi: 10.1111/j.1749-6632.1999.tb08647.x. [DOI] [PubMed] [Google Scholar]


