

Abstract
The prediction of clinical drug-drug interactions (DDIs) due to mechanism-based inhibitors of CYP3A is complicated when the inhibitor itself is metabolized by CYP3Aas in the case of clarithromycin. Previous attempts to predict the effects of clarithromycin on CYP3A substrates, e.g., midazolam, failed to account for nonlinear metabolism of clarithromycin. A semiphysiologically based pharmacokinetic model was developed for clarithromycin and midazolam metabolism, incorporating hepatic and intestinal metabolism by CYP3A and non-CYP3A mechanisms. CYP3A inactivation by clarithromycin occurred at both sites. KI and kinact values for clarithromycin obtained from in vitro sources were unable to accurately predict the clinical effect of clarithromycin on CYP3A activity. An iterative approach determined the optimum values to predict in vivo effects of clarithromycin on midazolam to be 5.3 μM for Ki and 0.4 and 4 h−1 for kinact in the liver and intestines, respectively. The incorporation of CYP3A-dependent metabolism of clarithromycin enabled prediction of its nonlinear pharmacokinetics. The predicted 2.6-fold change in intravenous midazolam area under the plasma concentration-time curve (AUC) after 500 mg of clarithromycin orally twice daily was consistent with clinical observations. Although the mean predicted 5.3-fold change in the AUC of oral midazolam was lower than mean observed values, it was within the range of observations. Intestinal CYP3A activity was less sensitive to changes in KI, kinact, and CYP3A half-life than hepatic CYP3A. This semiphysiologically based pharmacokinetic model incorporating CYP3A inactivation in the intestine and liver accurately predicts the nonlinear pharmacokinetics of clarithromycin and the DDI observed between clarithromycin and midazolam. Furthermore, this model framework can be applied to other mechanism-based inhibitors.
The macrolide antibiotic clarithromycin is extensively metabolized by CYP3A to 14-hydroxyclarithromycin and N-desmethylclarithromycin (Suzuki et al., 2003) and exhibits nonlinear pharmacokinetics, demonstrated by reduced clearance with increasing doses. Accordingly, the ratio of 14-hydroxyclarithromycin to clarithromycin decreases with increasing doses, indicating saturation or autoinhibition of CYP3A-mediated metabolism (Chu et al., 1992). Clarithromycin forms a noncovalent metabolic-intermediate complex with CYP3A (Mayhew et al., 2000), leading to a time-dependent decrease in the clearance of midazolam by CYP3A. Covalent binding of a clarithromycin intermediate complex to CYP3A leads to an increased rate of enzyme degradation, defined by the maximum inactivation rate constant (kinact) and the concentration of inhibitor needed to achieve half of the maximum inactivation (KI). CYP3A inactivation leads to a reduction in the in vivo intrinsic clearance (CLint), reflected by an increase in the AUC of a CYP3A probe substrate, e.g., midazolam, and the nonlinear kinetics of clarithromycin. Clinically, clarithromycin increases the AUC of oral midazolam by 7-fold, resulting in prolonged sedation (Gorski et al., 1998).
Several studies have evaluated the effect of clarithromycin on oral or intravenous midazolam disposition (Yeates et al., 1996; Gorski et al., 1998, 2002; Wang et al., 2004; Pinto et al., 2005). Midazolam is a commonly used in vivo probe for CYP3A activity that undergoes CYP3A-mediated hydroxylation to form 1′-hydroxymidazolam and 4-hydroxymidazolam (Kronbach et al., 1989; Gorski et al., 1994). A small proportion, 1 to 2% of the dose, is glucuronidated (Hyland et al., 2009) and less than 1% of the administered dose is excreted unchanged in the urine. In contrast with other CYP3A substrates, midazolam does not appear to undergo P-glycoprotein-mediated transport (Schmiedlin-Ren et al., 1997; Kim et al., 1999). The clearance of intravenously administered midazolam correlates with hepatic CYP3A protein expression and activity (Thummel et al., 1994a,b). Administration of both oral and intravenous midazolam enables one to determine intestinal CYP3A activity (Gorski et al., 1998).
Clinical effects of mechanism-based inhibitors have been predicted from in vitro data using nonphysiological and semiphysiological models (Mayhew et al., 2000; Takanaga et al., 2000; Ito et al., 2003; Venkatakrishnan and Obach, 2005; Polasek and Miners, 2006; Einolf, 2007; Fahmi et al., 2008). Previous models of drug-drug interactions with clarithromycin (Ito et al., 2003; Polasek and Miners, 2006) fail to account for changes in CYP3A-mediated metabolism of clarithromycin, thus, not accounting for nonlinearity in the clearance of clarithromycin. Furthermore, these models do not incorporate the time course of intestinal CYP3A inactivation by clarithromycin.
A semiphysiologically based pharmacokinetic (PBPK) model including significant covariates, i.e., age, weight, and sex, was developed and validated to illustrate the effect of clarithromycin on CYP3A activity in vivo as demonstrated by changes in the AUC of midazolam. The time course for inactivation of CYP3A is predicted in both gut wall and liver, and both hepatic and intestinal enzymes influence the clearance of midazolam and clarithromycin. In addition, this model accounts for the nonlinear clearance of clarithromycin. Sensitivity of the model to changes in various parameters was evaluated to estimate the importance of accurate determination of inactivation parameters.
Materials and Methods
Overview.
The semi-PBPK models for clarithromycin and midazolam were developed separately using data from clinical studies and physiological parameters from the literature. The interaction models between clarithromycin and midazolam for the gut wall and liver were established from in vitro data and were subsequently validated by clinical studies (Gorski et al., 2002; Wang et al., 2004; Pinto et al., 2005). Further simulations and sensitivity analyses were performed from the validated model.
Simulated Study Population.
The simulated study population was drawn at random from an equal distribution of males and females. Weight was included as a covariate for calculation of hepatic blood flow (QH) and described by a normal distribution with males having a mean of 72 kg and females a mean of 65 kg, with a 20% coefficient of variation, similar to our study population.
Semi-PBPK Model.
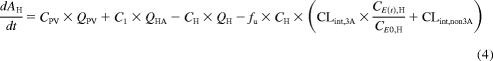
The semi-PBPK models derived for clarithromycin and midazolam were identical except that clarithromycin is fit to a one-compartment model, whereas midazolam fits a two-compartment model. Both models incorporated compartments representing the gut lumen, gut wall, portal vein, and liver. The model describing midazolam PK (Fig. 1; Table 1) was modified from Chien et al. (2006) and was been described previously by Zhang et al. (2009). The differential equations used to define this model are provided in eqs. 1 to 6. Pharmacokinetic parameters of clarithromycin were incorporated from literature sources (Table 1) to construct a similar one-compartment model for clarithromycin, incorporating first-pass intestinal metabolism and the well stirred model for hepatic clearance (Fig. 1). The mass balance equations for clarithromycin are provided by eqs. 1 to 4 and eq. 5b:
 |
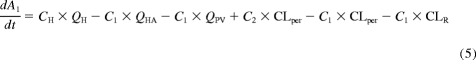 |
where AGL, AGW, APV, AH, A1, and A2 are the amounts of drug in the gut lumen, gut wall, portal vein, liver, central compartment, and peripheral compartment, respectively; VGL and VGW are the volumes of the gut lumen and gut wall; VGL is equivalent to the amount of fluid administered with drug (250 ml); CGL, CGW, CPV, CH, C1, and C2 are the volumes and concentrations of drug in gut lumen, gut wall, portal vein, liver, central compartment, and peripheral compartments, respectively; CLper is the clearance between the peripheral and central compartments; fu is the fraction of drug unbound in the plasma; kGL and kPV are the first-order rate constants for absorption from gut lumen to gut wall and gut wall to portal vein, respectively; and QH is hepatic blood flow calculated as an allometric expression of total body weight (eq. 7) (Brown et al., 1997):
QHA and QPV are hepatic artery and portal venous blood flow and represent 25 and 75% of QH, respectively. CLR is the renal clearance.
Fig. 1.

Midazolam and clarithromycin PK models. kGL and kPV are the first-order absorption rate constants from the gut lumen to the gut wall and gut wall to portal vein, respectively. VGL, VGW, VPV, VH, V1, and V2, volumes of the gut lumen, gut wall, portal vein, liver, central component, and peripheral compartment (midazolam only), respectively. CLper is the clearance rate between the peripheral and central compartments for midazolam. QH is the hepatic blood flow. QHA and QPV are the hepatic artery and portal venous blood flow, respectively. Drug is cleared renally and through CYP3A in the gut wall (CLint,GW) and CYP3A and non-CYP3A (midazolam only) mechanisms in the liver (CLint,H).
TABLE 1.
Model parameters for clarithromycin
| Parameter | Value | Reference |
|---|---|---|
| Midazolam PK parameters | ||
| kGL (h−1) | 1.2 ± 0.52 | Chien et al., 2006 |
| V1 (liters) | 43 ± 8.6 | Chien et al., 2006 |
| V2 (liters) | 88.4 ± 17.7 | Chien et al., 2006 |
| fu | 0.04 | Chien et al., 2006 |
| CLper (l/h) | 59.5 | Chien et al., 2006 |
| CLR (l/h) | 0.06 | Chien et al., 2006 |
| CLint, 3A (l/h) | 439 | Chien et al., 2006 |
| CLint, non3A (l/h) | 36 | Chien et al., 2006 |
| Vmax, 3A(mg/h) | 2600a | |
| Vmax, non3A (mg/h) | 250a | |
| Km (μM) | 5.8 | Chien et al., 2006 |
| Clarithromycin PK parameters | ||
| kGL (h−1) | 1.7 ± 0.73 | Chu et al., 1992 |
| V1 (liters) | 123 ± 24.6 | |
| CLR (l/h) | 7.5 | Chu et al., 1992 |
| CLint (l/h) | 67 | Chu et al., 1992 |
| Vmax, 3A (mg/h) | 4002 ± 800.4b | |
| Km (μM) | 60 | Rodrigues et al., 1997 |
| fu | 0.28 | Ito et al., 2003 |
| Physiological parameters | ||
| VGW (liters) | 0.25 | Chien et al., 2006 |
| VPV (liters) | 0.07 | Ito et al., 2003 |
| VH (liters) | 2.8 | Ito et al., 2003 |
| CYP3A enzyme parameters | ||
| kdeg (h−1) | 0.025c | |
| Ki, clar (μM) | 300 | Obach et al., 2006 |
Km was estimated in-house using human liver microsomes. Vmax was estimated by CLint, 3A × Km. Vmax, non3A was estimated as 10% of Vmax, 3A. Vmax, 3A was assumed to be equivalent between the gut wall and liver.
Calculated from CLint (Chu et al., 1992) and in vitro Km (Rodrigues et al., 1997).
kdeg was estimated from in vivo data on CYP3A recovery following clarithromycin (Gorski et al., 2002; Wang et al., 2004).
CLint, 3A and CLint,non3A are the CYP3A- and non-CYP3A-mediated intrinsic clearances of midazolam in the liver and are calculated by eqs. 8 and 9:
where Vmax, 3A and Vmax, non3A are the maximum velocity of metabolism by CYP3A and non-CYP3A mechanisms and Km is the Michaelis-Menten constant. Intrinsic clearance of drug in the gut wall (CLint, GW) was assumed to be entirely by CYP3A (eq. 10); thus,
where Vmax, GW indicates the maximum velocity of metabolism by CYP3A in the gut wall. Gut wall Km was assumed to be equivalent to hepatic Km.
Before initial dosing, no drug was present in the system. Orally dosed midazolam was assumed to be immediately present in the gut lumen and completely absorbed into the gut wall (Gorski et al., 1998). Intravenously dosed midazolam was infused into the central compartment. Midazolam PK parameters were obtained from our previous published studies and the literature (Table 1) (Chien et al., 2006). Clarithromycin was administered orally and assumed to be immediately present in the gut lumen and completely absorbed into the gut wall.
Because clarithromycin is a substrate for CYP3A, mechanistic inactivation of CYP3A by clarithromycin results in autoinhibition of its metabolism. Therefore, it was necessary to incorporate the inhibition of CYP3A into the model (see below). However, at lower (e.g., 100 mg) doses of clarithromycin, it was assumed that minimal CYP3A inactivation occurs and that this amount of inactivation is inconsequential to the pharmacokinetics of clarithromycin. Thus, intrinsic clearance was adjusted such that the model, assuming 100% CYP3A activity, would reproduce the pharmacokinetic parameters for a single 100-mg dose (Chu et al., 1992).
CYP3A Enzyme Model.
At steady state, the amount of active CYP3A enzyme (E0) available in the liver or intestinal wall is determined by a zero-order synthesis rate (R0) and first-order degradation rate (kdeg) of the enzyme. The rate of change of active enzyme (Et) in the absence of a modulating drug is given by eq. 11:
At steady state (eq. 12),
where E0 is the amount of active CYP3A at time 0.
In the presence of an inactivator, the degradation rate of enzyme is increased by an inactivation rate constant, kobs (eq. 13),
where kinact is the maximum rate of enzyme inactivation, KI is the dissociation rate constant of the inhibitor, and It is the unbound concentration of inhibitor at the enzyme site at time t (Zhou et al., 2004). The rate of change of CYP3A in response to inactivation may be described by eq. 14,
where E(t) is the amount of active CYP3A enzyme present at time t. Enzyme turnover was assumed to be 28 h based on in vivo data obtained by our group (Gorski et al., 2002; Wang et al., 2004). This resulted in R0 and kdeg of 0.025 h−1 in both the liver and gut wall. Initial estimates of KI and kinact were obtained from in vitro studies as reported in the literature (Table 2). Microsomal binding of clarithromycin and midazolam was assumed to be negligible (Hallifax and Houston, 2006; Gertz et al., 2008).
TABLE 2.
Comparison of KI and kinact for clarithromycin
| Source | KI | kinact | Reference |
|---|---|---|---|
| μM | h−1 | ||
| Human liver microsomes | 5.49 | 4.32 | Mayhew et al., 2000 |
| CYP3A4 + b5 Supersomes | 4.12 | 13.8 | Jones et al., 2007 |
| Human liver microsomes | 37.0–41.4 | 2.5–2.8 | Ito et al., 2003 |
| Recombinant CYP3A4a | 2.25 | 2.4 | Polasek and Miners, 2006 |
| Human liver microsomesa | 29.5 | 3.0 | Polasek and Miners, 2006 |
| In vivo estimate | 5.3 | 0.4 (liver); 4 (intestine) |
Determined by 6β-hydroxylation of testosterone.
Clarithromycin and Midazolam Interaction Models.
Changes in the CYP3A enzyme pool due to clarithromycin inactivation were integrated into the pharmacokinetic models of clarithromycin and midazolam, resulting in the alteration of intestinal and hepatic metabolism. Thus, gut wall intrinsic clearance of clarithromycin (CLAR) can be defined by eq. 15:
where E(t), GW and E0, GW are the enzyme concentrations at time t and at baseline (steady state) in the gut wall. The intrinsic clearance of clarithromycin by CYP3A in the liver is calculated as follows (eq. 16):
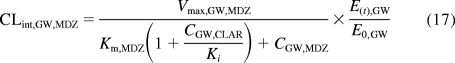
where E(t), H and E0, H are the enzyme concentrations at time t and at baseline in the liver. In addition to irreversibly inactivating CYP3A, clarithromycin is also a weak competitive inhibitor of CYP3A, so the clearance term for midazolam (MDZ) incorporated both mechanism-based and competitive inhibition (eqs. 17 and 18):
 |
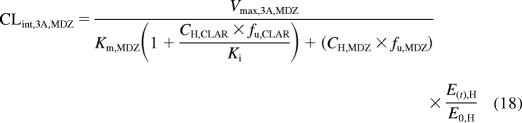 |
where Ki is the reversible equilibrium inhibition constant of clarithromycin determined in vitro (Obach et al., 2006).
Validation Data.
The clarithromycin and midazolam interaction model was validated using data from two clinical trials performed at the Indiana University School of Medicine (Gorski et al., 2002; Wang et al., 2004; Pinto et al., 2005). In both studies, healthy adult volunteers were administered 500 mg of clarithromycin orally every 12 h for 7 days. In one study (n = 10), upper intestinal biopsy samples were obtained before and 12 h after the last dose of clarithromycin (Pinto et al., 2005). Subjects received intravenous midazolam (2–13 mg) to achieve conscious sedation for endoscopy, and a single-point 1′-hydroxymidazolam/midazolam serum ratio, normalized to dose of midazolam, was used to determine hepatic CYP3A activity. Intestinal CYP3A activity was determined by formation of 1′-hydroxymidazolam in intestinal homogenates. In a separate study (Gorski et al., 2002; Wang et al., 2004), healthy adult volunteers (n = 15) were simultaneously administered 4 mg of [15N3]midazolam oral solution and 0.05 mg/kg midazolam (Versed, Roche Pharmaceuticals, Nutley, NJ) intravenously over a 30-min period before initiation of clarithromycin therapy, 1 h after the 13th dose of clarithromycin and 36, 72, and 144 h after the 14th dose of clarithromycin. Plasma samples were collected up to 12 h after midazolam administration for analysis of midazolam, 1′-hydroxymidazolam, [15N3]midazolam, 1′-hydroxy-[15N3]midazolam, and clarithromycin.
Model Validation.
Based on data published previously, the clarithromycin and midazolam interaction was simulated using Trial Simulator (version 2.1.2; Pharsight Mountain View, CA). WinNonlin (Pharsight) was used to calculate AUC∞ from the simulated data and the AUC ratio (AUCR) of midazolam in presence and absence of clarithromycin was estimated as follows (eq. 19):
Observed and simulated midazolam AUCRs were compared. To improve the model prediction of the observed midazolam AUCR, model validation was performed by tuning PK parameters such as KI and kinact. A grid search algorithm was performed to minimize
where i indicates study i. This optimization approach was implemented through an interactive procedure within Trial Simulator.
Sensitivity Analysis.
Sensitivity analyses were performed on the final model to determine the effect of altering key parameters in the inactivation equation. Each parameter (kdeg, KI, and kinact) was altered for intestinal and hepatic CYP3A while all other parameters were held constant. The effect of each parameter on extent of hepatic or intestinal enzyme inactivation and recovery was evaluated.
Results
Clarithromycin AUC∞ values after single doses (100–1200 mg) were simulated. Predicted AUC∞ values were within 25% of observed values (Chu et al., 1992) for all doses (Fig. 2, top). It is noteworthy that predicted AUC∞ values were within 5% of observed values for the 400- and 600-mg doses. Nonlinearity in clarithromycin bioavailability is clearly seen in Fig. 2, bottom. Model-predicted bioavailability was within 25% of observed bioavailability at all doses. Clinical studies of the clarithromycin-midazolam interaction (Gorski et al., 2002; Pinto et al., 2005; Wang et al., 2005) used the typical clinical dose of 500 mg of clarithromycin every 12 h for 7 days. Predicted and observed steady-state plasma concentrations of clarithromycin on day 6, after the 12th dose of clarithromycin are shown in Fig. 3. Although time to maximum concentration is earlier for the observed data, the predicted AUC12 (11 ± 0.73 μg/ml · h, mean ± S.D.) closely matched the observed AUC12 (11 ± 2.1 μg/ml · h) (Gorski et al., 2002; Wang et al., 2004).
Fig. 2.

Clarithromycin AUC∞ and relative bioavailability after single doses of clarithromycin. Top, predicted ( ) and observed (■) clarithromycin AUC∞ after single doses of clarithromycin. Error bars represent S.E. in 100 simulated subjects (predicted) or in observed subjects (n = 6 for 100 mg of clarithromycin; n = 8 for all other doses) (Chu et al., 1992). Bottom, relative bioavailability of clarithromycin compared with 100 mg oral dosage. ●, observed data; △, predicted values.
Fig. 3.

Simulated and observed clarithromycin plasma concentrations. A simulated dose of 500 mg of clarithromycin was administered every 12 h for a total of 12 doses to 100 virtual subjects. The mean (——) and 95% CI (–––) of the concentration-time curve of the 12th dose of clarithromycin is shown. The observed mean ± S.D. of 15 subjects is indicated by ● and error bars (Gorski et al., 2002; Wang et al., 2004).
A previously described PBPK model for midazolam (Chien et al., 2006) was modified to incorporate the inactivation of CYP3A enzyme on hepatic and intestinal clearance. Initial KI and kinact values were obtained from in vitro experiments (Table 2). However, these values were unable to correctly estimate the effects of clarithromycin on CYP3A activity and midazolam clearance. A grid search algorithm was therefore used to identify the optimal KI (5.3 μM) and kinact (0.4 h−1 in liver and 4 h−1 in intestine). This model accurately predicted mean change in the AUC∞ of intravenous midazolam from baseline after a 7-day course of oral clarithromycin (Table 3; Fig. 4). The mean rate of enzyme recovery in a simulated population of 100 individuals, indicated by -fold changes in AUC of midazolam administered 36, 72, and 144 h after the final dose of clarithromycin compared with baseline, was similar to that observed (Fig. 3). Although the mean predicted change in AUC of oral midazolam from baseline to day 7 of clarithromycin treatment was lower than the mean observed change (5.3 ± 0.85-fold versus 8.6 ± 4.5-fold), the predicted -fold changes in AUC fell within the ranges of those observed. The predicted rate of return of oral midazolam AUC to baseline after discontinuation of clarithromycin was similar to the observed rate. To further validate the model, the -fold change in oral midazolam AUC after 250 mg of clarithromycin twice daily for 5 days was simulated. The predicted increase in midazolam AUC for this regimen (3.0-fold) was similar to that observed (3.6-fold; Table 3) (Yeates et al., 1996).
TABLE 3.
Observed and predicted -fold change in oral or intravenous midazolam AUC after indicated course of clarithromycin
Fig. 4.

Predicted (●) and observed (○) -fold change in intravenous and oral midazolam AUC from baseline. Clarithromycin (500 mg) was administered orally every 12 h for 7 days. Intravenous midazolam (0.05 mg/kg) and oral [15N3]midazolam (4 mg) were administered simultaneously 1 h after the 13th dose of clarithromycin (day 7) and 36 (day 9), 72 (day 11), and 144 (day 13) h after the 14th dose of clarithromycin.
Figure 5, top, depicts the predicted plasma concentration-time course of clarithromycin after a standard regimen of 500 mg orally every 12 h. Steady-state plasma concentrations of clarithromycin were not achieved until the seventh dose, corresponding to the decline in hepatic CYP3A activity (Fig. 5, bottom), for which the maximum 70% loss of activity was reached on day 7. Intestinal CYP3A activity decreased after the initial dose of clarithromycin by 88%. With the second and subsequent doses of clarithromycin, intestinal CYP3A activity was reduced to 4% of baseline activity before recovering to approximately 24% of baseline within the 12-h dosing interval. The model-predicted recovery of intestinal and hepatic CYP3A activity to 99% of baseline required 7.5 days after the final dose of clarithromycin. The predicted reduction in intestinal CYP3A activity (24%) was in agreement with the observed change (25.7%) in 1′-hydroxymidazolam formation rate in homogenates from intestinal pinch biopsies obtained before and after the 13th dose of clarithromycin (500 mg orally every 12 h; Fig. 5) (Pinto et al., 2005).
Fig. 5.

Predicted plasma concentrations of clarithromycin during a week-long course of 500 mg orally every 12 h (top) and effect on intestinal (– – –) and hepatic (——) CYP3A activity (bottom). ● and bars indicate the observed rate of 1′-hydroxymidazolam formation in intestinal biopsy samples obtained before dose one and after dose 13 of clarithromycin (Pinto et al., 2005).
Effects of a mechanism-based inactivator on enzyme activity are dependent on kinact, KI, and kdeg. Sensitivity analyses were conducted for each of these parameters to determine their importance in the final model. The extent of reduction in intestinal CYP3A activity was insensitive to changes in kinact, KI, and kdeg (Fig. 6). The rate of return to baseline CYP3A activity in the intestine was dependent on the kdeg, with a longer enzyme half-life leading to a slower return to baseline conditions. Hepatic CYP3A activity was more sensitive to changes in all parameters. kinact and KI primarily alter the extent of inactivation, whereas reductions in kdeg increased the time required for enzyme to return to baseline after discontinuation of clarithromycin (Fig. 6).
Fig. 6.

Effect of altering kinact, KI, and kdeg on inactivation of CYP3A during a 7-day course of 500 mg of clarithromycin orally every 12 h. Top, intestinal/hepatic kinact values were 2/0.2 (·····), 4/0.4 (——), and 8/0.8 (– – –). Middle, KI values were 10 (·····), 4 (——), and 1 (– – –). Bottom, CYP3A half-life was 20 h (·····), 28 h (——), and 40 h (– – –).
Discussion
Modeling and simulation are becoming more prevalent for evaluation of potential drug-drug interactions. Physiological and nonphysiological models have been developed to describe the effect of mechanism-based inhibitors on enzyme activity (Mayhew et al., 2000; Takanaga et al., 2000; Gorski et al., 2002; Ito et al., 2003; Wang et al., 2004; Venkatakrishnan and Obach, 2005; Polasek and Miners, 2006; Einolf, 2007). A recent comparison of prediction methods found that the mechanistic static model with a single inhibitor concentration more accurately predicted mechanism-based interactions than the Simcyp dynamic model (Einolf, 2007). However, a dynamic model enables incorporation of interindividual variability and extrapolation to various dosing regimens. We developed a semi-PBPK model for the interaction between clarithromycin and midazolam, incorporating CYP3A inactivation in both the gut wall and liver. Furthermore, this model incorporates the effects of this inactivation on the disposition of clarithromycin.
Oral and intravenous midazolam exposure increases 7- and 2.7-fold after 500 mg of oral clarithromycin twice daily for 7 days (Gorski et al., 1998). Several approaches to predict this effect of clarithromycin on midazolam disposition have been reported. Using a nonphysiological model, our group predicted that a steady-state unbound plasma concentration of 0.1 μM clarithromycin reduces hepatic CYP3A4 by 61%, leading to a 2.6-fold increase in the AUC of oral midazolam (Mayhew et al., 2000). Polasek and Miners (2006) used a similar non-PBPK model with KI values of 2.25 and 29.5 μM and kinact values of 0.04 and 0.05 min−1, based on inactivation of testosterone β-hydroxylation in recombinant CYP3A4 and human liver microsomes, respectively, to predict a change in the oral AUC of midazolam of 12.7- and 4.6-fold. A physiologically based model by Ito et al. (2003) showed that the AUC of oral midazolam increased 2.5-fold after 7 days of treatment with 500 mg of clarithromycin twice daily. The approach described herein, incorporating time-dependent changes in intestinal and hepatic metabolism and nonlinear pharmacokinetics of clarithromycin, predicts a 5.3-fold increase in the oral AUC of midazolam and a 2.6-fold increase for intravenous midazolam. This increase in the AUC of intravenous midazolam is consistent with in vivo data. Although the predicted AUC increases for oral data are less than the mean observed change in AUC after oral dosing, it is within the range of variability observed in vivo (Fig. 4).
CYP3A is highly expressed in the gastrointestinal tract (Kolars et al., 1994; Paine et al., 2005, 2006). However, most predictive models of CYP3A inactivation fail to account for time-dependent changes in gut wall CYP3A activity. Some models incorporate intestinal CYP3A by increasing gut wall availability of midazolam (Ito et al., 2003; Galetin et al., 2006; Polasek and Miners, 2006). This results in overprediction of availability as intestinal CYP3A activity recovers as a result of synthesis of new enzyme. The model described in this article defines the time course of intestinal CYP3A inactivation and recovery. A limitation to this approach is the accurate determination of gut wall concentration. Gut lumen volume was defined as the volume of fluid administered with drug, resulting in a relatively high concentration of drug in the gut. At inhibitor concentrations greater than KI, enzyme inactivation is determined by kinact (eq. 13). Maximal inactivation will occur in the gut wall after each dose of clarithromycin. Drug exposure is transient as gastrointestinal motility and absorption rapidly reduce drug concentration, allowing the rate of enzyme recovery to be primarily determined by kdeg (Fig. 6). Thus, the overriding factor of CYP3A inhibition in gut wall is duration of exposure to inhibitor and not inhibitor concentration.
CYP3A metabolizes clarithromycin to 14-hydroxyclarithromycin and N-desmethyl-clarithromycin (Suzuki et al., 2003). Although these metabolites may also inactivate CYP3A, they occur at low systemic concentrations in vivo such that circulating metabolites will probably have an insignificant effect on CYP3A (Chu et al., 1992, 1993). It is possible that metabolites may inactivate CYP3A without exiting the liver. In this case, inactivation constants for clarithromycin account for inhibition by metabolites.
After a 250-mg oral dose of clarithromycin, 60% of the drug is excreted as 14-hydroxyclarithromycin and N-desmethyl-clarithromycin metabolites (Ferrero et al., 1990). However, these metabolites account for only 35% of a single oral 1200-mg dose (Ferrero et al., 1990). Thus, the nonlinear pharmacokinetics of clarithromycin may be explained by saturation of CYP3A. In this model, inactivation of CYP3A directly affects the metabolism of clarithromycin. As predicted by the model, the first dose of clarithromycin reduces hepatic CYP3A by approximately 25%. However, because clarithromycin accumulates after multiple doses, hepatic CYP3A is inactivated to a greater extent, resulting in a 75% decrease in hepatic CYP3A activity at steady state. Previous models of mechanism-based inhibition (Ito et al., 2003; Polasek and Miners, 2006) have not included the effects of the inactivation of CYP3A on the inactivating drug. Although these prior models may be adequate to describe the pharmacokinetic profile of the inactivator for the dosage regimen initially modeled, extrapolation to other doses will be limited. In contrast, incorporation of the nonlinear clearance of clarithromycin enables accurate predictions at different doses of inactivator.
In vitro KI and kinact values have been determined by a number of investigators (Table 2) (Mayhew et al., 2000; Ito et al., 2003; Polasek and Miners, 2006; Jones et al., 2007). A high degree of variability was observed among the studies. This inconsistency may be due to variability of enzyme sources for the in vitro experiments; KI determined in recombinant CYP3A4 systems was generally 10-fold lower than that determined in human liver microsomes (Table 2). Such differences between recombinant systems and human liver microsomes may be due to differential nonspecific binding or an increased CYP3A/NADPH oxidoreductase molar ratio (Polasek and Miners, 2007).
In contrast to our diltiazem model (Zhang et al., 2009), no combination of in vitro KI and kinact values estimated the in vivo effect of clarithromycin on midazolam clearance. In addition, the in vivo estimate of kinact in the gastrointestinal tract was 10-fold higher than that in the liver. The finding that in vivo inactivation efficiency was lower than in vitro estimates is consistent with rate-limiting, slow access of drug to the inactivation site. This slowness may be tissue-selective. At present, no mechanistic model of drug distribution is available to accurately predict rate of drug movement into hepatocytes or intestinal epithelial cells. Thus, it remains difficult to determine the effective concentration of inhibitor at the enzyme site.
Sensitivity analyses indicate that intestinal CYP3A is less responsive to changes in KI, kinact, and kdeg than hepatic CYP3A. Altering kinact or KI affects the extent of hepatic CYP3A inactivation, with kinact being more sensitive to smaller changes than KI (Fig. 6). The time line of the reduction and recovery of CYP3A activity after inactivation is influenced by the half-life of the CYP3A enzyme, a value that is debatable. In vivo approaches estimate the half-life for CYP3A to be between 1 and 6 days (Lai et al., 1978; Fromm et al., 1996; Hsu et al., 1997; Greenblatt et al., 2003; Obach et al., 2007; Yang et al., 2008). We have examined the recovery of intestinal and hepatic CYP3A activity after a week-long course of clarithromycin (Gorski et al., 2002; Wang et al., 2004). By fitting the inactivation rate equation to the data, a half-life of CYP3A was determined to be 28 h (kdeg = 0.025 h−1). The population-based absorption, distribution, metabolism, and excretion simulator Simcyp, using a default hepatic CYP3A half-life of 90 h, was found to overpredict the AUC change for mechanism-based inhibitors (Einolf, 2007). Reducing the half-life of CYP3A to 36 h improved the predictions such that the changes in AUC for seven of nine trials were predicted within 2-fold of the observed values. In our model, with CYP3A half-life estimated as 28 h, the predicted AUC ratio for intravenous midazolam was nearly identical to that observed.
Although our model predicted mean changes in the AUC of midazolam in the presence of clarithromycin, interindividual variability was typically underpredicted (Fig. 4). Variability was incorporated into the model for kGL, V1, V2, and Vmax of the drugs and body weight of individuals. Further exploration into interindividual differences in CYP3A half-life, pharmacogenetic variants in CYP3A enzymes, or impact of transport on the PK of clarithromycin may enhance the predictive capability of the model with regard to interindividual variability.
Mechanistic models such as this are important tools in collecting and explaining data regarding a drug and in designing future trials. This model incorporating the CYP3A metabolism of clarithromycin and midazolam in the liver and intestine predicts the nonlinear pharmacokinetics of clarithromycin and the effects of clarithromycin on midazolam clearance. In addition, this model allows the prediction of drug interactions with varying dosage regimens of clarithromycin. This general framework will be useful in the prediction of other mechanism-based drug-drug interactions. However, application of this model to clarithromycin illustrates that not all drug interactions can be accurately estimated from in vitro data. Advancements in mechanistic models of transport are needed to further improve in vitro-in vivo predictions.
Acknowledgments.
We acknowledge the contribution of Ying-Hong Wang to the clinical trial results presented in this article.
This work was supported in part by the National Institutes of Health National Institute of General Medical Sciences [Grants T32-GM08425, GM067308]; and the National Institutes of Health National Center for Research Resources [Grant MO1-RR00750].
Article, publication date, and citation information can be found at http://dmd.aspetjournals.org.
doi:10.1124/dmd.109.028746.
- AUC
- area under the plasma concentration-time curve
- PBPK
- physiologically based pharmacokinetic
- PK
- pharmacokinetic(s).
References
- Brown RP, Delp MD, Lindstedt SL, Rhomberg LR, Beliles RP. (1997) Physiological parameter values for physiologically based pharmacokinetic models. Toxicol Ind Health 13: 407–484 [DOI] [PubMed] [Google Scholar]
- Chien JY, Lucksiri A, Ernest CS, 2nd, Gorski JC, Wrighton SA, Hall SD. (2006) Stochastic prediction of CYP3A-mediated inhibition of midazolam clearance by ketoconazole. Drug Metab Dispos 34: 1208–1219 [DOI] [PubMed] [Google Scholar]
- Chu S, Wilson DS, Deaton RL, Mackenthun AV, Eason CN, Cavanaugh JH. (1993) Single- and multiple-dose pharmacokinetics of clarithromycin, a new macrolide antimicrobial. J Clin Pharmacol 33: 719–726 [DOI] [PubMed] [Google Scholar]
- Chu SY, Sennello LT, Bunnell ST, Varga LL, Wilson DS, Sonders RC. (1992) Pharmacokinetics of clarithromycin, a new macrolide, after single ascending oral doses. Antimicrob Agents Chemother 36: 2447–2453 [DOI] [PMC free article] [PubMed] [Google Scholar]
- Einolf HJ. (2007) Comparison of different approaches to predict metabolic drug-drug interactions. Xenobiotica 37: 1257–1294 [DOI] [PubMed] [Google Scholar]
- Fahmi OA, Maurer TS, Kish M, Cardenas E, Boldt S, Nettleton D. (2008) A combined model for predicting CYP3A4 clinical net drug-drug interaction based on CYP3A4 inhibition, inactivation, and induction determined in vitro. Drug Metab Dispos 36: 1698–1708 [DOI] [PubMed] [Google Scholar]
- Ferrero JL, Bopp BA, Marsh KC, Quigley SC, Johnson MJ, Anderson DJ, Lamm JE, Tolman KG, Sanders SW, Cavanaugh JH. (1990) Metabolism and disposition of clarithromycin in man. Drug Metab Dispos 18: 441–446 [PubMed] [Google Scholar]
- Fromm MF, Busse D, Kroemer HK, Eichelbaum M. (1996) Differential induction of prehepatic and hepatic metabolism of verapamil by rifampin. Hepatology 24: 796–801 [DOI] [PubMed] [Google Scholar]
- Galetin A, Burt H, Gibbons L, Houston JB. (2006) Prediction of time-dependent CYP3A4 drug-drug interactions: impact of enzyme degradation, parallel elimination pathways, and intestinal inhibition. Drug Metab Dispos 34: 166–175 [DOI] [PubMed] [Google Scholar]
- Galetin A, Houston JB. (2006) Intestinal and hepatic metabolic activity of five cytochrome P450 enzymes: impact on prediction of first-pass metabolism. J Pharmacol Exp Ther 318: 1220–1229 [DOI] [PubMed] [Google Scholar]
- Gertz M, Kilford PJ, Houston JB, Galetin A. (2008) Drug lipophilicity and microsomal protein concentration as determinants in the prediction of the fraction unbound in microsomal incubations. Drug Metab Dispos 36: 535–542 [DOI] [PubMed] [Google Scholar]
- Gorski J, Wang Z, Hall S. (2002) Duration of CYP3A inhibition by clarithromycin. Clin Pharmacol Ther 71: MPI-105 [Google Scholar]
- Gorski JC, Hall SD, Jones DR, VandenBranden M, Wrighton SA. (1994) Regioselective biotransformation of midazolam by members of the human cytochrome P450 3A (CYP3A) subfamily. Biochem Pharmacol 47: 1643–1653 [DOI] [PubMed] [Google Scholar]
- Gorski JC, Jones DR, Haehner-Daniels BD, Hamman MA, O'Mara EM, Jr, Hall SD. (1998) The contribution of intestinal and hepatic CYP3A to the interaction between midazolam and clarithromycin. Clin Pharmacol Ther 64: 133–143 [DOI] [PubMed] [Google Scholar]
- Greenblatt DJ, von Moltke LL, Harmatz JS, Chen G, Weemhoff JL, Jen C, Kelley CJ, LeDuc BW, Zinny MA. (2003) Time course of recovery of cytochrome p450 3A function after single doses of grapefruit juice. Clin Pharmacol Ther 74: 121–129 [DOI] [PubMed] [Google Scholar]
- Hallifax D, Houston JB. (2006) Binding of drugs to hepatic microsomes: comment and assessment of current prediction methodology with recommendation for improvement. Drug Metab Dispos 34: 724–726; author reply 727 [DOI] [PubMed] [Google Scholar]
- Hsu A, Granneman GR, Witt G, Locke C, Denissen J, Molla A, Valdes J, Smith J, Erdman K, Lyons N, et al. ( 1997) Multiple-dose pharmacokinetics of ritonavir in human immunodeficiency virus-infected subjects. Antimicrob Agents Chemother 41: 898–905 [DOI] [PMC free article] [PubMed] [Google Scholar]
- Hyland R, Osborne T, Payne A, Kempshall S, Logan YR, Ezzeddine K, Jones B. (2009) In vitro and in vivo glucuronidation of midazolam in humans. Br J Clin Pharmacol 67: 445–454 [DOI] [PMC free article] [PubMed] [Google Scholar]
- Ito K, Ogihara K, Kanamitsu S, Itoh T. (2003) Prediction of the in vivo interaction between midazolam and macrolides based on in vitro studies using human liver microsomes. Drug Metab Dispos 31: 945–954 [DOI] [PubMed] [Google Scholar]
- Jones DR, Ekins S, Li L, Hall SD. (2007) Computational approaches that predict metabolic intermediate complex formation with CYP3A4 (+b5). Drug Metab Dispos 35: 1466–1475 [DOI] [PubMed] [Google Scholar]
- Kim RB, Wandel C, Leake B, Cvetkovic M, Fromm MF, Dempsey PJ, Roden MM, Belas F, Chaudhary AK, Roden DM, et al. ( 1999) Interrelationship between substrates and inhibitors of human CYP3A and P-glycoprotein. Pharm Res 16: 408–414 [DOI] [PubMed] [Google Scholar]
- Kolars JC, Lown KS, Schmiedlin-Ren P, Ghosh M, Fang C, Wrighton SA, Merion RM, Watkins PB. (1994) CYP3A gene expression in human gut epithelium. Pharmacogenetics 4: 247–259 [DOI] [PubMed] [Google Scholar]
- Kronbach T, Mathys D, Umeno M, Gonzalez FJ, Meyer UA. (1989) Oxidation of midazolam and triazolam by human liver cytochrome P450IIIA4. Mol Pharmacol 36: 89–96 [PubMed] [Google Scholar]
- Lai AA, Levy RH, Cutler RE. (1978) Time-course of interaction between carbamazepine and clonazepam in normal man. Clin Pharmacol Ther 24: 316–323 [DOI] [PubMed] [Google Scholar]
- Mayhew BS, Jones DR, Hall SD. (2000) An in vitro model for predicting in vivo inhibition of cytochrome P450 3A4 by metabolic intermediate complex formation. Drug Metab Dispos 28: 1031–1037 [PubMed] [Google Scholar]
- Obach RS, Walsky RL, Venkatakrishnan K. (2007) Mechanism-based inactivation of human cytochrome P450 enzymes and the prediction of drug-drug interactions. Drug Metab Dispos 35: 246–255 [DOI] [PubMed] [Google Scholar]
- Obach RS, Walsky RL, Venkatakrishnan K, Gaman EA, Houston JB, Tremaine LM. (2006) The utility of in vitro cytochrome P450 inhibition data in the prediction of drug-drug interactions. J Pharmacol Exp Ther 316: 336–348 [DOI] [PubMed] [Google Scholar]
- Paine MF, Hart HL, Ludington SS, Haining RL, Rettie AE, Zeldin DC. (2006) The human intestinal cytochrome P450 “pie.” Drug Metab Dispos 34: 880–886 [DOI] [PMC free article] [PubMed] [Google Scholar]
- Paine MF, Ludington SS, Chen ML, Stewart PW, Huang SM, Watkins PB. (2005) Do men and women differ in proximal small intestinal CYP3A or P-glycoprotein expression? Drug Metab Dispos 33: 426–433 [DOI] [PubMed] [Google Scholar]
- Pinto AG, Wang YH, Chalasani N, Skaar T, Kolwankar D, Gorski JC, Liangpunsakul S, Hamman MA, Arefayene M, Hall SD. (2005) Inhibition of human intestinal wall metabolism by macrolide antibiotics: effect of clarithromycin on cytochrome P450 3A4/5 activity and expression. Clin Pharmacol Ther 77: 178–188 [DOI] [PubMed] [Google Scholar]
- Polasek TM, Miners JO. (2006) Quantitative prediction of macrolide drug-drug interaction potential from in vitro studies using testosterone as the human cytochrome P4503A substrate. Eur J Clin Pharmacol 62: 203–208 [DOI] [PubMed] [Google Scholar]
- Polasek TM, Miners JO. (2007) In vitro approaches to investigate mechanism-based inactivation of CYP enzymes. Expert Opin Drug Metab Toxicol 3: 321–329 [DOI] [PubMed] [Google Scholar]
- Rodrigues AD, Roberts EM, Mulford DJ, Yao Y, Ouellet D. (1997) Oxidative metabolism of clarithromycin in the presence of human liver microsomes. Major role for the cytochrome P4503A (CYP3A) subfamily. Drug Metab Dispos 25: 623–630 [PubMed] [Google Scholar]
- Schmiedlin-Ren P, Thummel KE, Fisher JM, Paine MF, Lown KS, Watkins PB. (1997) Expression of enzymatically active CYP3A4 by Caco-2 cells grown on extracellular matrix-coated permeable supports in the presence of 1α,25-dihydroxyvitamin D3. Mol Pharmacol 51: 741–754 [DOI] [PubMed] [Google Scholar]
- Suzuki A, Iida I, Hirota M, Akimoto M, Higuchi S, Suwa T, Tani M, Ishizaki T, Chiba K. (2003) CYP isoforms involved in the metabolism of clarithromycin in vitro: comparison between the identification from disappearance rate and that from formation rate of metabolites. Drug Metab Pharmacokinet 18: 104–113 [DOI] [PubMed] [Google Scholar]
- Takanaga H, Ohnishi A, Matsuo H, Murakami H, Sata H, Kuroda K, Urae A, Higuchi S, Sawada Y. (2000) Pharmacokinetic analysis of felodipine-grapefruit juice interaction based on an irreversible enzyme inhibition model. Br J Clin Pharmacol 49: 49–58 [DOI] [PMC free article] [PubMed] [Google Scholar]
- Thummel KE, Shen DD, Podoll TD, Kunze KL, Trager WF, Bacchi CE, Marsh CL, McVicar JP, Barr DM, Perkins JD. (1994a) Use of midazolam as a human cytochrome P450 3A probe: II. Characterization of inter- and intraindividual hepatic CYP3A variability after liver transplantation. J Pharmacol Exp Ther 271: 557–566 [PubMed] [Google Scholar]
- Thummel KE, Shen DD, Podoll TD, Kunze KL, Trager WF, Hartwell PS, Raisys VA, Marsh CL, McVicar JP, Barr DM. (1994b) Use of midazolam as a human cytochrome P450 3A probe: I. In vitro-in vivo correlations in liver transplant patients. J Pharmacol Exp Ther 271: 549–556 [PubMed] [Google Scholar]
- Venkatakrishnan K, Obach RS. (2005) In vitro-in vivo extrapolation of CYP2D6 inactivation by paroxetine: prediction of nonstationary pharmacokinetics and drug interaction magnitude. Drug Metab Dispos 33: 845–852 [DOI] [PubMed] [Google Scholar]
- Wang Y-H, Gorski JC, Hamman MA, Hall SD. (2004) Age and sex effect on the recovery time of CYP3A inhibition by clarithromycin. Drug Metab Rev 36: 287 [Google Scholar]
- Wang YH, Jones DR, Hall SD. (2005) Differential mechanism-based inhibition of CYP3A4 and CYP3A5 by verapamil. Drug Metab Dispos 33: 664–671 [DOI] [PubMed] [Google Scholar]
- Yang J, Liao M, Shou M, Jamei M, Yeo KR, Tucker GT, Rostami-Hodjegan A. (2008) Cytochrome p450 turnover: regulation of synthesis and degradation, methods for determining rates, and implications for the prediction of drug interactions. Curr Drug Metab 9: 384–394 [DOI] [PubMed] [Google Scholar]
- Yeates RA, Laufen H, Zimmermann T. (1996) Interaction between midazolam and clarithromycin: comparison with azithromycin. Int J Clin Pharmacol Ther 34: 400–405 [PubMed] [Google Scholar]
- Zhang X, Quinney SK, Gorski JC, Jones DR, Hall SD. (2009) Semiphysiologically based pharmacokinetic models for the inhibition of midazolam clearance by diltiazem and its major metabolite. Drug Metab Dispos 37: 1587–1597 [DOI] [PubMed] [Google Scholar]
- Zhou S, Chan E, Lim LY, Boelsterli UA, Li SC, Wang J, Zhang Q, Huang M, Xu A. (2004) Therapeutic drugs that behave as mechanism-based inhibitors of cytochrome P450 3A4. Curr Drug Metab 5: 415–442 [DOI] [PubMed] [Google Scholar]