

Abstract
N-formyl peptide receptor (FPR1) and N-formyl peptide receptor-like 1 (FPRL1, now known as FPR2) are G protein-coupled receptors involved in host defense and sensing cellular dysfunction. Because of the potential for FPR1/FPR2 as a therapeutic target, our recent high-throughput screening efforts have focused on the identification of unique nonpeptide agonists of FPR1/FPR2. In the present studies, we screened a chemolibrary of drug-like molecules for their ability to induce intracellular calcium mobilization in RBL-2H3 cells transfected with human FPR1 or FPR2. Screening of these compounds resulted in the identification of novel and potent agonists that activated both FPR1 and FPR2, as well as compounds that were specific for either FPR1 or FPR2 with EC50 values in the low micromolar range. Specificity of the compounds was supported by analysis of calcium mobilization in HL-60 cells transfected with human FPR1 and FPR2. In addition, all but one agonist activated intracellular calcium flux and chemotaxis in human neutrophils, irrespective of agonist specificity for FPR1 or FPR2. Molecular modeling of the group of FPR1 and FPR2 agonists using field point methodology allowed us to create pharmacophore models for ligand binding sites and formulate requirements for these specific N-formyl peptide receptor agonists. These studies further demonstrate that agonists of FPR1/FPR2 include compounds with wide chemical diversity and that analysis of such compounds can enhance our understanding of their ligand/receptor interaction.
Phagocytic leukocytes, such as neutrophils and monocyte/macrophages, are key components of the innate immune system and play an essential role in host defense. These cells use an array of oxygen-dependent and oxygen-independent microbicidal mechanisms to recognize, ingest, and destroy pathogens (Tosi, 2005). These responses are modulated by a variety of extrinsic factors, including bacterial products, lipids, cytokines, and chemokines, and it is now apparent that the nature of a given inflammatory response represents interplay between pro-inflammatory and anti-inflammatory immune modulators (Serhan, 2007; Gordon, 2007). Among these modulators are signals that recruit phagocytes to sites of inflammation (i.e., chemoattractants), which is a critical process during immune responses to tissue injury and infection (for review, see Ley et al., 2007).
One of the most studied phagocyte chemoattractants is N-formyl-methionyl-leucyl-phenyalanine (fMLF), which is a prototype for microbe-derived formylated peptides (Schiffmann et al., 1975). However, subsequent studies have shown that formylated peptides are produced by mitochondria and can be released when mitochondria are damaged during tissue injury (for review, see Ye et al., 2009). Thus, N-formyl peptides can also be considered alarmins, which are defined as endogenous molecules that signal tissue and cell damage (Oppenheim et al., 2007). N-formyl peptides activate phagocytes through G protein-coupled receptors known as formyl peptide receptors (FPR) (Le et al., 2002). FPR1 was the first FPR cloned and represents a high-affinity receptor for fMLF (Boulay et al., 1990). Subsequently, it was found that two additional FPRs exist in humans, and these were originally designated as FPR-like 1 (FPRL1; 69% identity to FPR1) and FPR-like 2 (FPRL2; 56% identity to FPR1) (Bao et al., 1992; Murphy et al., 1992; Ye et al., 1992). The International Union of Basic and Clinical Pharmacology recently revised this nomenclature such that FPRL1 and FPRL2 are now designated as FPR2 and FPR3, respectively (Ye et al., 2009). FPR1 is expressed on phagocytes and a small number of nonphagocytic cells (e.g., hepatocytes, immature dendritic cells, astrocytes, microglial cells), whereas FPR2 is expressed in an even wider variety of cell types, including phagocytic leukocytes, hepatocytes, epithelial cells, T lymphocytes, neuroblastoma cells, astrocytoma cells, and microvascular endothelial cells (for review, see Ye et al., 2009). These patterns of tissue expression suggest that FPR1/FPR2 may also participate in a number of functions other than host defense.
Compared with FPR1, FPR2 exhibits a high level of ligand promiscuity and is activated by numerous and chemically unrelated ligands, including synthetic peptides, pathogen-derived peptides, host-derived peptides, and lipids (for review, see Ye et al., 2009). In addition to natural peptides and endogenous arachidonic acid metabolites, novel synthetic peptides and several small-molecule nonpeptide agonists of FPR1 and FPR2 have been reported (e.g., Nanamori et al., 2004; Edwards et al., 2005; Bürli et al., 2006; Schepetkin et al., 2007, 2008). Indeed, the identification development of small-molecule ligands represents an ideal approach to analyzing FPR structure and function; because such small molecules are well defined and can be easily modified for structure-activity relationship (SAR) analysis, they have advantages over peptides or proteins as potential therapeutics and can provide a basis for construction of useful pharmacophore models of FPR1/FPR2 agonists.
Based on the importance of FPRs in health and disease pathogenesis and the need for additional receptor-specific FPR agonists, we screened a library of 6000 synthetic compounds to identify novel and potent agonists for FPR1 and FPR2. After further SAR analysis and analog screening, we identified 6 FPR1-specific agonists, 21 FPR2-specific agonists, and 9 mixed FPR1/FPR2 agonists with EC50 values in the low micromolar range. Specificity of the compounds was supported using a Ca2+ mobilization assay in HL-60 cells transfected with either human FPR1 or FPR2. In addition, all but one of these agonists activated intracellular Ca2+ mobilization and chemotaxis in human neutrophils, irrespective of agonist selectivity for the two receptors. Molecular modeling of selected agonist with additional FPR1- and FPR2-specific agonists allowed us to create pharmacophore models of the ligand-binding requirements for the two receptor subtypes. These studies further demonstrate that agonists of FPR1/FPR2 include compounds with wide chemical diversity and that analysis of such compounds can enhance our understanding of their ligand-receptor interactions.
Materials and Methods
Materials.
Dimethyl sulfoxide (DMSO), fMLF, and Histopaque 1077 were purchased from Sigma Chemical Co. (St. Louis, MO). Trp-Lys-Tyr-Met-Val-d-Met (WKYMVm) was from Calbiochem (San Diego, CA). Hanks' balanced salt solution (10× HBSS) (without Ca2+, Mg2+, and phenol red) was from Invitrogen (Carlsbad, CA). The chemical diversity set of 6000 compounds was obtained from TimTec Inc. (Newark, DE). The additional compounds were purchased from TimTec Inc., Scientific Exchange (Center Ossipee, NH), Princeton BioMolecular Research, Inc. (Monmouth Junction, NJ), ChemBridge (San Diego, CA), and Enamine (Kiev, Ukraine). The purity and identity of the compounds were verified using NMR spectroscopy, elemental analysis, and mass spectroscopy, as performed by the suppliers. The compounds were diluted in DMSO at a concentration of 2 mg/ml and stored at −80°C.
Cell Culture.
Rat basophilic leukemia RBL-2H3 cells transfected with human FPR1 (RBL-FPR1) or FPR2 (RBL-FPR2) were cultured in Dulbecco's modified Eagle's medium supplemented with 20% (v/v) fetal bovine serum (FBS), 10 mM HEPES, 100 μg/ml streptomycin, 100 U/ml penicillin, and G418 (250 μg/ml), as described previously (Nanamori et al., 2004). Human HL-60 cells stably transfected with human FPR1 (HL-60-FPR1) or FPR2 (HL-60-FPR2) were cultured in RPMI 1640 medium supplemented with 10% heat-inactivated fetal calf serum, 10 mM HEPES, 100 μg/ml streptomycin, 100 U/ml penicillin, and G418 (1 mg/ml), as described previously (Christophe et al., 2002). Wild-type RBL-2H3 and HL-60 cells were cultured under the same conditions, but without G418.
Isolation of Human Neutrophils.
Blood was collected from healthy donors in accordance with a protocol approved by the Institutional Review Board at Montana State University. Neutrophils were purified from the blood using dextran sedimentation, followed by Histopaque 1077 gradient separation and hypotonic lysis of red blood cells, as described previously (Schepetkin et al., 2007). Isolated neutrophils were washed twice and resuspended in HBSS without Ca2+ and Mg2+ (HBSS−). Neutrophil preparations were routinely >95% pure, as determined by light microscopy, and >98% viable, as determined by trypan blue exclusion.
Ca2+ Mobilization Assay.
Changes in intracellular Ca2+ were measured with a FlexStation II scanning fluorometer using Fluo-4 acetoxymethyl ester (Invitrogen) for human neutrophils, RBL-2H3 cells, and HL-60 cells. All active compounds were evaluated in wild-type HL-60 cells to verify that the agonists were inactive in nontransfected cells. Human neutrophils or HL-60 cells, suspended in HBSS− containing 10 mM HEPES, were loaded with Fluo-4 acetoxymethyl ester dye (1.25 μg/ml final concentration) and incubated for 30 min in the dark at 37°C. After dye loading, the cells were washed with HBSS− containing 10 mM HEPES, resuspended in HBSS containing 10 mM HEPES and Ca2+ and Mg2+ (HBSS+), and separated into aliquots, which were inserted into the wells of flat-bottomed, half-area-well black microtiter plates (2 × 10⁵ cells/well). The compound source plate contained dilutions of test compounds in HBSS+. Changes in fluorescence were monitored (λex = 485 nm, λem = 538 nm) every 5 s for 240 s at room temperature after automated addition of compounds. Maximum change in fluorescence, expressed in arbitrary units over baseline, was used to determine agonist response. Responses were normalized to the response induced by 5 nM fMLF (Sigma Chemical Co., St. Louis, MO) for RBL-FPR1, HL-60-FPR1, and neutrophils or by 5 nM WKYMVm (Calbiochem, San Diego, CA) for RBL-FPR2 and HL-60-FPR2 cells, which were assigned a value of 100%. Curve fitting (at least 5–6 points) and calculation of median effective concentration values (EC50) were performed by nonlinear regression analysis of the dose-response curves generated using Prism 5 (GraphPad Software, Inc., San Diego, CA).
Chemotaxis Assay.
Neutrophils were suspended in HBSS+ containing 2% (v/v) heat-inactivated FBS (2 × 10⁶ cells/ml), and chemotaxis was analyzed in 96-well ChemoTx chemotaxis chambers (Neuroprobe, Gaithersburg, MD), as described previously (Schepetkin et al., 2007). In brief, lower wells were loaded with 30 μl of HBSS+ containing 2% (v/v) FBS and the indicated concentrations of test compound, DMSO (negative control), or 1 nM fMLF as a positive control. Neutrophils were added to the upper wells and allowed to migrate through the 5.0-μm pore polycarbonate membrane filter for 60 min at 37°C and 5% CO2. The number of migrated cells was determined by measuring ATP in lysates of transmigrated cells using a luminescence-based assay (CellTiter-Glo; Promega, Madison, WI), and luminescence measurements were converted to absolute cell numbers by comparison of the values with standard curves obtained with known numbers of neutrophils. Curve fitting (at least 8–9 points) and calculation of median effective concentration values (EC50) were performed by nonlinear regression analysis of the dose-response curves generated using Prism 5.
Molecular Modeling.
Compounds for modeling the active sites of FPR1 and FPR2 were chosen according to their receptor specificity. We used structures of FPR1/FPR2 agonists identified in the present studies (AG-09/2, AG-09/5, AG-26, and AG-09/74), as well as several FPR agonists published previously: 1910-5441 from Edwards et al. (2005), compound 25 from Bürli et al. (2006) (designated here as Bürli-25), compound 11 from Frohn et al. (2007) (designated here as Frohn-11), and AG-14 from Schepetkin et al. (2008). Compounds AG-09/2, AG-14, and 1910-5441 are representative FPR1 agonists, whereas compounds AG-09/5, AG-09/74, AG-26, Bürli-25, and Frohn-11 are representative FPR2 agonists.
We used a ligand-based approach for molecular modeling founded on the use of field points (Cheeseright et al., 2007). The structures of the compounds in Tripos MOL2 format were imported into the FieldTemplater program (FieldTemplater Version 2.0.1; Cresset Biomolecular Discovery Ltd., Hertfordshire, UK). The conformation hunter algorithm was used to generate representative sets of conformations corresponding to local minima of energy calculated within the extended electron distribution (XED) force field (Vinter, 1994; Cheeseright et al., 2007). This algorithm incorporated in the FieldTemplater software allowed us to obtain up to 100 independent conformations, which were passed to further calculation of field points surrounding each conformation of each molecule. For the generation of field point patterns, probe atoms having positive, negative, and zero charge were placed in the vicinity of a given conformation, and the energy of their interaction with the molecular field was calculated using the extended electron distribution parameter set. Positions of energy extrema for positive probes give “negative” field points, whereas energy extrema for negative and neutral probe atoms correspond to “positive” and steric field points, respectively. Hydrophobic field points were also generated with neutral probes capable of penetrating into the molecular core and reaching extrema in the centers of hydrophobic regions (e.g., benzene rings). The size of a field point depends on magnitude of an extremum (Cheeseright et al., 2006). There are approximately the same number of field points as heavy atoms in a “drug-like” molecule, and the field points are colored according to the following convention: blue, electron-rich (negative); red, electron-deficient (positive); yellow, van der Waals attractive (steric); and orange, hydrophobic (Cheeseright et al., 2007). A detailed description of the field point calculation procedure has been published elsewhere (Cheeseright et al., 2006).
Field point patterns found by FieldTemplater for each conformation were stored and used for the identification of common features between compounds with similar biological action. For this purpose, conformations of two molecules with the same activity were aligned pair-wise to achieve maximum volume overlap and similarity of their fields in the positions of field points for both conformations. Several overlaid pairs with top rank fits, called duos, were then compared with all conformations of the third molecule belonging to the same activity class, thus forming trios, etc. (Cheeseright et al., 2006). Finally, the best trio among conformation alignments of compounds AG-09/2, AG-14, and 1910-5441 and the best quintet among alignments of molecules AG-09/5, AG-09/74, AG-26, Bürli-25, and Frohn-11 were obtained. This trio and quintet were regarded as templates corresponding to the unknown active sites of FPR1 and FPR2, respectively. The templates were characterized by similarity S, which is calculated as a relative index according to Cheeseright et al. (2007). Generating conformations, field point patterns, and building templates were performed with default options of FieldTemplater software.
Results
Identification of FPR1/FPR2 Agonists in High-Throughput Screening.
In previous studies, we screened a 10,000-compound library for molecules that activated human neutrophil reactive oxygen species (ROS) production and identified 11 such compounds, including two novel FPR agonists (Schepetkin et al., 2007). However, not all FPR agonists can activate phagocyte ROS production (Nanamori et al., 2004; Zhou et al., 2007), and some heterocyclic compounds can scavenge ROS. Thus, we rescreened a subset of this compound library for novel FPR1/FPR2 agonists using a Ca2+ mobilization assay. The subset of 6000 compounds was selected from the parent library as compounds that contained at least two heterocycles separated by a chemical linker with >2 bonds, because previous studies have shown that these characteristics are almost always present in nonpeptide FPR1/FPR2 agonists (Nanamori et al., 2004; Edwards et al., 2005; Bürli et al., 2006; Frohn et al., 2007; Schepetkin et al., 2007, 2008; Zhou et al., 2007). To distinguish between FPR1 and FPR2 agonists, we performed primary high-throughput screening for compounds that activated Ca2+ mobilization in RBL cell lines transfected with either human FPR1 or FPR2.
A compound was considered to be a hit if it induced >20% activation of Ca2+ mobilization compared with the positive control (100%, induced by 5 nM fMLF or 5 nM WKYMVm for RBL-FPR1 and RBL-FPR2 cells, respectively) at a final compound concentration of 20 μg/ml (40–80 μM, depending on compound Mr). Primary screening resulted in the selection of 79 and 476 compounds from the parent library with putative FPR1- and FPR2-specific agonist properties, respectively. Further dose-response analyses of these compounds resulted in the selection of 12 compounds that exhibited EC50 values <20 μM in RBL-FPR1 or RBL-FPR2 cells, whereas no response was observed in control, untransfected RBL cells treated with these compounds. Note that two of these compounds were previously reported by us as neutrophil agonists, based on their ability to activate ROS production, although receptor specificity was not evaluated (Schepetkin et al., 2007). Using our previous nomenclature (Schepetkin et al., 2008), these agonists are designated here as AG-26 and AG-22. The remaining 10 compounds are designated as (AG)-09/1 through AG-09/10. Structures of the selected compounds are shown in Fig. 1, and their activities are reported in Table 1. It is noteworthy that none of these 10 agonists activated human or murine neutrophil ROS production, which explains why they were not identified in previous screens (data not shown). Specificity of these compounds was verified by analysis of their ability to activate Ca2+ mobilization in HL-60 cells transfected with human FPR1 or FPR2 (Table 1).
Fig. 1.

Chemical structures of the most potent FPR1/FPR2 agonists selected by high-throughput screening. Chemical names for these compounds are: AG-09/1, 2-(6-methoxybenzimidazol-2-ylthio)-N-(4-nitrophenyl)acetamide; AG-09/2, N-(4-ethoxyphenyl)-2-(6-methoxybenzimidazol-2-ylthio)acetamide; AG-26, N-(4-chlorophenyl)-N′-[2-(4-methoxyphenyl)ethyl]urea; AG-09/3, N-(4-bromophenyl)-2-[4-(4-fluorophenyl)piperazinyl]acetamide; AG-09/4, N-(4-bromophenyl)-2-[4-(3-chlorophenyl)piperazinyl]acetamide; AG-09/5, N′-(4-chlorobenzoyl)-2-nitrobenzohydrazide; AG-09/6, N-(4-methoxyphenyl)-5-(2-thienyl)pentanamide; AG-09/7, N′-[2-nitro-(Z)-styrylmethylene]-2-oxo-4-phenylpyrrolidine-3-carbohydrazide; AG-09/8, N-[2-(4-methoxyphenyl)-4-oxo-1,2,3-trihydroquinazolin-3-yl]-4-nitrobenzamide; AG-09/9, N-[2-(indol-3-yl)-1,3-thiazolidin-4-one-3-yl]-N′-(4-methoxyphenyl)thiourea; AG-09/10, N-(4-methoxyphenyl)-N′-[4-(1-piperidinylcarbonyl)phenyl]urea; AG-22, N′-[(3-thienyl)methylene]-2-[4-(2-pentyl)phenoxy]acetylhydrazide.
TABLE 1.
Activity of selected FPR1/FPR2 agonists
The EC50 values are presented as the mean ± S.D. of three independent experiments, in which median effective concentration values (EC50) were determined by nonlinear regression analysis of the dose-response curves (5–6 points) generated using GraphPad Prism 5 with 95% confidential interval (P < 0.05). Efficacy (in parentheses) is expressed as the percentage of the response induced by 5 nM fMLF (FPR1) or 5 nM WKYMVm (FPR2).
| Compound | Ca2+ Mobilization EC50 and Efficacy |
Chemotaxis EC50 | ||||
|---|---|---|---|---|---|---|
| FPR1 |
FPR2 |
PMN | ||||
| RBL-2H3 Cells | HL-60 Cells | RBL-2H3 Cells | HL-60 Cells | |||
| μM (%) | μM | |||||
| AG-09/1 | 2.4 ± 0.9 (140) | 3.4 ± 1.1 (120) | N.A. | N.A. | 0.4 ± 0.1 (130) | 0.9 ± 0.3 |
| AG-09/2 | 15.8 ± 4.2 (110) | 21.5 ± 5.2 (120) | N.A. | N.A. | 5.8 ± 1.7 (105) | 5.8 ± 2.1 |
| AG-26 | N.A. | N.A. | 0.5 ± 0.2 (85) | 0.4 ± 0.1 (70) | 0.7 ± 0.2 (95) | 12.6 ± 3.7 |
| AG-09/3 | N.A. | N.A. | 9.9 ± 3.4 (105) | 19.3 ± 5.0 (95) | 10.4 ± 2.3 (105) | 0.3 ± 0.1 |
| AG-09/4 | N.A. | N.A. | 7.7 ± 2.1 (105) | 15.1 ± 4.7 (90) | 16.4 ± 3.2 (75) | 5.3 ± 1.7 |
| AG-09/5 | N.A. | N.A. | 12.6 ± 3.6 (125) | 2.7 ± 0.9 (70) | 7.0 ± 2.9 (85) | 1.5 ± 0.7 |
| AG-09/6 | N.A. | N.A. | 9.7 ± 2.7 (80) | 5.0 ± 1.7 (75) | 28.8 ± 6.6 (55) | 4.7 ± 1.4 |
| AG-09/7 | N.A. | N.A. | 5.4 ± 1.8 (75) | 5.8 ± 1.9 (80) | 10.8 ± 3.0 (35) | 0.9 ± 0.3 |
| AG-09/8 | N.A. | N.A. | 0.3 ± 0.1 (145) | 14.8 ± 4.3 (50) | 1.4 ± 0.3 (125) | 2.2 ± 0.9 |
| AG-09/9 | 10.7 ± 2.7 (45) | 17.7 ± 4.6 (25) | 10.8 ± 2.4 (45) | 9.6 ± 2.8 (125) | 8.2 ± 2.4 (90) | 4.2 ± 1.5 |
| AG-09/10 | 18.6 ± 4.8 (80) | 14.3 ± 3.6 (65) | 11.1 ± 2.9 (80) | 6.9 ± 1.7 (40) | 1.9 ± 0.8 (100) | 0.3 ± 0.1 |
| AG-22 | 19.7 ± 5.3 (55) | 11.1 ± 3.3 (40) | 15.0 ± 4.3 (60) | 17.2 ± 4.3 (70) | 23.6 ± 3.1 (85) | 9.6 ± 3.5 |
PMN, polymorphonuclear leukocytes; N.A., very low response (efficacy <20% of positive control) or no activity (no Ca2+ flux response was observed during the 3 min after addition of compounds under investigation).
Of the selected compounds, two are FPR1-specific agonists (AG-09/1 and AG-09/2) and have a common 2-(benzimidazol-2-ylsulfanyl)-N-phenyl-acetamide scaffold. Seven compounds (AG-26 and AG-09/4 through AG-09/8) are specific for FPR2. Among these, compounds AG-09/3 and AG-09/4 have a common N-phenyl-2-(4-phenylpiperazin-1-yl)acetamide scaffold. Compounds AG-09/9, AG-09/10, and AG-22 are mixed FPR1/FPR2 agonists. Although AG-09/8 has a quinazolinone backbone, which has been reported to be present in other FPR2 ligands, such as Quin-C1 (Nanamori et al., 2004; Zhou et al., 2007), the chemotypes present in all other selected agonists have not been reported previously among FPR1/FPR2 ligands.
We found that both selective and nonselective agonists identified in RBL and HL-60 cell assays also induced chemotaxis and Ca2+ mobilization in human neutrophils, with EC50 values in the low micromolar or even nanomolar range (Tables 1–4 and Supplemental Table S1). For example, Fig. 2 shows representative kinetic curves and dose-response curves for AG-09/1 and AG-09/4, which are FPR1- and FPR2-specific agonists, respectively, in HL-60 cells expressing FPR1 or FPR2 and in human neutrophils.
TABLE 2.
Structure and activity of benzimidazole derivatives
Median effective concentration values (EC50) were determined by nonlinear regression analysis of the dose-response curves (5–6 points) generated using GraphPad Prism 5 with 95% confidential interval (P < 0.05). Efficacy (in parentheses) is expressed as a percentage of the response induced by 5 nM fMLF (FPR1) or 5 nM WKYMVm (FPR2).

| No. | R1 | R2 | R3 | R4 | R5 | R6 | Ca2+ Mobilization EC50 and Efficacy |
||||
|---|---|---|---|---|---|---|---|---|---|---|---|
| FPR1 |
FPR2 |
PMN | |||||||||
| RBL-2H3 | HL-60 | RBL-2H3 | HL-60 | ||||||||
| μM (%) | |||||||||||
| AG-09/1 | H | H | NO2 | H | H | O-CH3 | 2.4 (140) | 3.4 (120) | N.A. | N.A. | 0.4 (130) |
| AG-09/2 | H | H | O-C2H5 | H | H | O-CH3 | 15.8 (110) | 21.5 (120) | N.A. | N.A. | 5.8 (105) |
| AG-09/11 | H | H | H | H | H | H | N.A. | N.A. | N.A. | N.A. | N.A. |
| AG-09/12 | H | H | O-CH3 | H | H | H | N.A. | N.A. | N.A. | N.A. | N.A. |
| AG-09/13 | H | H | O-CH3 | H | H | O-C2H5 | 1.6 (80) | 19.1 (40) | N.A. | N.A. | 0.6 (100) |
| AG-09/14 | H | H | O-(CH2)3CH3 | H | H | O-CH3 | N.A. | N.A. | N.A. | N.A. | 1.2 (40) |
| AG-09/15 | H | H | O-(CH2)3CH3 | H | H | O-C2H5 | N.A. | N.A. | N.A. | N.A. | NA |
| AG-09/16 | H | H | O-CH3 | H | H | O-CH3 | 7.0 (95) | 1.7 (65) | 17.0 (40) | 5.1 (25) | 0.3 (165) |
| AG-09/17 | H | O-CH3 | O-CH3 | H | H | O-CH3 | 3.1 (60) | 3.7 (55) | 9.4 (25) | 4.7 (50) | 2.6 (150) |
| AG-09/18 | H | H | H | H | H | O-CH3 | 30.7 (65) | 5.0 (80) | N.A. | N.A. | 3.5 (135) |
| AG-09/19 | H | O-CH3 | H | H | H | O-CH3 | 3.2 (90) | 1.5 (40) | N.A. | N.A. | 0.5 (160) |
| AG-09/20 | H | H | Cl | H | H | O-CH3 | 1.7 (130) | 1.6 (90) | 5.0 (75) | 6.0 (85) | 0.7 (90) |
| AG-09/21 | H | H | Br | H | H | O-CH3 | 8.1 (120) | 3.3 (100) | N.A. | N.A. | 1.8 (140) |
| AG-09/22 | Cl | H | H | H | H | O-CH3 | 13.3 (65) | 4.5 (110) | 17.5 (40) | 10.0 (70) | 0.7 (115) |
| AG-09/23 | H | NO2 | H | H | H | O-CH3 | 8.0 (50) | 3.5 (95) | 14.9 (40) | 10.8 (45) | 0.2 (95) |
| AG-09/24 | O-CH3 | H | H | H | H | O-CH3 | 8.1 (40) | 3.8 (80) | 21.0 (35) | 13.5 (55) | 0.8 (95) |
| AG-09/25 | H | Br | H | H | H | H | N.A. | N.A. | N.A. | N.A. | N.A. |
| AG-09/26 | H | NO2 | Cl | H | CH3 | H | N.A. | N.A. | N.A. | N.A. | N.A. |
| AG-09/27 | H | NO2 | H | CH3 | H | H | N.A. | N.A. | N.A. | N.A. | N.A. |
| AG-09/28 | H | H | NO2 | H | H | H | N.A. | N.A. | N.A. | N.A. | N.A. |
| AG-09/29 | CH3 | CH3 | H | H | H | O-CH3 | N.A. | N.A. | N.A. | N.A. | N.A. |
| AG-09/30 | H | CF3 | H | H | H | CH3 | N.A. | N.A. | N.A. | N.A. | N.A. |
| AG-09/31 | H | Cl | Cl | H | H | O-CH3 | N.A. | N.A. | N.A. | N.A. | N.A. |
| AG-09/32 | H | H | H | H | O-CH3 | N.A. | N.A. | N.A. | N.A. | N.A. | |
| AG-09/33 | H | H | O-CF3 | H | H | H | N.A. | N.A. | N.A. | N.A. | N.A. |
| AG-09/34 | H | Cl | H | H | H | N.A. | N.A. | N.A. | N.A. | N.A. | |
| AG-09/35 | H | CO-O-CH(CH3)2 | H | CH3 | H | H | N.A. | N.A. | N.A. | N.A. | N.A. |
N.A., very low response (efficacy <20% of positive control) or no activity (no Ca2+ flux response was observed during the 3 min after addition of compounds under investigation).
TABLE 3.
Structure and activity of N′-phenylurea derivatives
Median effective concentration values (EC50) were determined by nonlinear regression analysis of the dose-response curves (5–6 points) generated using GraphPad Prism 5 with 95% confidential interval (P < 0.05). Efficacy (in parentheses) is expressed as a percentage of the response induced by 5 nM fMLF (FPR1) or 5 nM WKYMVm (FPR2).
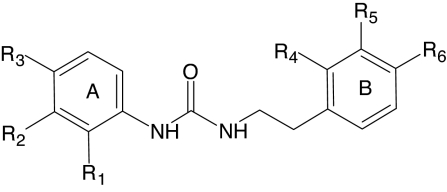
| No. | R1 | R2 | R3 | R4 | R5 | R6 | Ca2+ Mobilization EC50 and Efficacy |
||||
|---|---|---|---|---|---|---|---|---|---|---|---|
| FPR1 |
FPR2 |
PMN | |||||||||
| RBL | HL-60 | RBL | HL-60 | ||||||||
| μM (%) | |||||||||||
| AG-26 | H | H | Cl | H | H | O-CH3 | N.A. | N.A. | 0.5 (85) | 0.4 (70) | 0.7 (95) |
| AG-09/36 | H | H | H | H | H | H | N.A. | N.A. | N.A. | N.A. | N.A. |
| AG-09/37 | H | H | H | H | H | O-CH3 | N.A. | N.A. | 1.3 (90) | 3.0 (95) | 4.8 (90) |
| AG-09/38 | H | H | F | H | H | O-CH3 | N.A. | N.A. | 0.3 (80) | 0.9 (100) | 1.2 (55) |
| AG-09/39 | Cl | H | H | H | H | O-CH3 | N.A. | N.A. | N.A. | N.A. | N.A. |
| AG-09/40 | H | H | Cl | O-CH3 | H | H | N.A. | N.A. | N.A. | N.A. | N.A. |
| AG-09/41 | Cl | H | Cl | H | H | O-CH3 | N.A. | N.A. | N.A. | N.A. | N.A. |
| AG-09/42 | H | H | Br | H | H | O-CH3 | N.A. | N.A. | 0.1 (100) | 0.1 (65) | 1.2 (60) |
| AG-09/43 | H | Cl | H | H | H | O-CH3 | N.A. | N.A. | 2.7 (40) | 9.0 (55) | NA |
| AG-09/44 | H | H | F | H | H | Cl | N.A. | N.A. | N.A. | N.A. | N.A. |
| AG-09/45 | H | H | F | H | H | CH3 | N.A. | N.A. | N.A. | N.A. | N.A. |
| AG-09/46 | H | H | CH3 | H | H | O-CH3 | N.A. | N.A. | N.A. | N.A. | N.A. |
| AG-09/47 | H | H | O-CH3 | H | H | O-CH3 | N.A. | N.A. | N.A. | N.A. | N.A. |
| AG-09/48 | H | H | Cl | H | O-CH3 | O-CH3 | N.A. | N.A. | N.A. | N.A. | N.A. |
| AG-09/49 | H | H | Br | H | H | Cl | N.A. | N.A. | N.A. | N.A. | N.A. |
| AG-09/50 | H | H | F | H | O-CH3 | O-CH3 | N.A. | N.A. | N.A. | N.A. | N.A. |
| AG-09/51 | NO2 | H | H | H | O-CH3 | O-CH3 | N.A. | N.A. | N.A. | N.A. | N.A. |
| AG-09/52 | NO2 | H | H | H | H | Cl | N.A. | N.A. | N.A. | N.A. | N.A. |
| AG-09/53 | H | CH3 | H | H | H | CH3 | N.A. | N.A. | N.A. | N.A. | N.A. |
| AG-09/54 | H | CH3 | H | H | H | Cl | N.A. | N.A. | N.A. | N.A. | N.A. |
N.A., very low response (efficacy <20% of positive control) or no activity (no Ca2+ flux response was observed during the 3 min after addition of compounds under investigation).
TABLE 4.
Structure and activity of piperazine derivatives
Median effective concentration values (EC50) were determined by nonlinear regression analysis of the dose-response curves (5–6 points) generated using GraphPad Prism 5 with 95% confidential interval (P < 0.05). Efficacy (in parentheses) is expressed as a percentage of the response induced by 5 nM fMLF (FPR1) or 5 nM WKYMVm (FPR2).
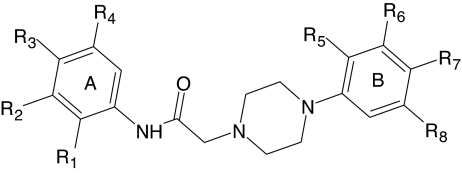
| No. | R1 | R2 | R3 | R4 | R5 | R6 | R7 | R8 | Ca2+ Mobilization EC50 and Efficacy |
||||
|---|---|---|---|---|---|---|---|---|---|---|---|---|---|
| FPR1 |
FPR2 |
PMN | |||||||||||
| RBL-2H3 | HL-60 | RBL-2H3 | HL-60 | ||||||||||
| μM (%) | |||||||||||||
| AG-09/3 | H | H | Br | H | H | H | F | H | N.A. | N.A. | 9.9 (105) | 19.3 (95) | 10.4 (105) |
| AG-09/4 | H | H | Br | H | H | Cl | H | H | N.A. | N.A. | 7.7 (105) | 15.1 (90) | 16.4 (75) |
| AG-09/55 | H | H | H | H | H | H | H | H | N.A. | N.A. | N.A. | N.A. | N.A. |
| AG-09/56 | H | H | H | H | Cl | H | H | H | N.A. | N.A. | N.A. | N.A. | N.A. |
| AG-09/57 | H | H | H | H | H | Cl | H | H | N.A. | N.A. | N.A. | N.A. | N.A. |
| AG-09/58 | H | H | H | H | H | H | Cl | H | N.A. | N.A. | N.A. | N.A. | N.A. |
| AG-09/59 | H | H | O-CH3 | H | H | Cl | H | H | N.A. | N.A. | N.A. | N.A. | N.A. |
| AG-09/60 | H | H | O-CH3 | H | H | H | F | H | N.A. | N.A. | N.A. | N.A. | N.A. |
| AG-09/61 | H | H | CH(CH3)2 | H | H | H | F | H | N.A. | N.A. | N.A. | N.A. | N.A. |
| AG-09/62 | O-CH3 | H | H | CH3 | H | H | F | H | N.A. | N.A. | N.A. | N.A. | N.A. |
| AG-09/63 | F | H | F | H | F | H | H | H | N.A. | N.A. | N.A. | N.A. | N.A. |
| AG-09/64 | H | Cl | F | H | H | H | H | H | N.A. | N.A. | N.A. | N.A. | N.A. |
| AG-09/65 | H | CF3 | H | H | H | H | F | H | N.A. | N.A. | N.A. | N.A. | N.A. |
| AG-09/66 | H | H | CF3 | H | H | H | H | H | N.A. | N.A. | N.A. | N.A. | N.A. |
| AG-09/67 | H | CF3 | H | H | H | Cl | H | H | N.A. | N.A. | N.A. | N.A. | N.A. |
| AG-09/68 | Cl | H | H | CF3 | F | H | H | H | N.A. | N.A. | N.A. | N.A. | N.A. |
| AG-09/69 | H | H | O-CF3 | H | H | Cl | H | H | N.A. | N.A. | N.A. | N.A. | N.A. |
| AG-09/70 | H | H | cyclohexyl | H | H | H | H | H | N.A. | N.A. | N.A. | N.A. | N.A. |
| AG-09/71 | Br | H | H | H | H | H | H | H | N.A. | N.A. | N.A. | N.A. | N.A. |
| AG-09/72 | H | Br | H | H | H | H | H | H | N.A. | N.A. | N.A. | N.A. | N.A. |
| AG-09/73 | H | H | Br | H | H | H | H | H | N.A. | N.A. | 10.5 (85) | 8.7 (110) | 2.3 (100) |
| AG-09/74 | H | H | Br | H | H | H | Cl | H | N.A. | N.A. | 2.0 (90) | 2.1 (65) | 2.0 (55) |
| AG-09/75 | H | H | Br | H | H | Cl | CH3 | H | N.A. | N.A. | 1.8 (30) | 4.3 (25) | 1.0 (70) |
| AG-09/76 | H | H | Br | H | CH3 | Cl | H | H | N.A. | N.A. | 7.4 (20) | 4.1 (30) | 1.8 (40) |
| AG-09/77 | H | H | Br | H | CH3 | H | H | Cl | N.A. | N.A. | 5.7 (25) | 9.4 (65) | 0.4 (25) |
| AG-09/78 | Cl | H | Br | H | H | Cl | H | H | N.A. | N.A. | N.A. | N.A. | N.A. |
| AG-09/79 | H | H | Br | H | H | Cl | Cl | H | N.A. | N.A. | N.A. | N.A. | 2.2 (85) |
| AG-09/80 | Cl | H | Br | H | H | H | Cl | H | N.A. | N.A. | N.A. | N.A. | N.A. |
| AG-09/81 | H | H | Br | H | O-CH3 | H | H | H | N.A. | N.A. | N.A. | N.A. | 17.8 (90) |
| AG-09/82 | H | H | Br | H | H | O-CH3 | H | H | N.A. | N.A. | 10.5 (120) | 11.0 (100) | 7.9 (65) |
| AG-09/83 | CH3 | H | H | F | H | H | F | H | N.A. | N.A. | N.A. | N.A. | N.A. |
| AG-09/84 | H | H | SO2-NH2 | H | H | H | H | H | N.A. | N.A. | N.A. | N.A. | N.A. |
| AG-09/85 | H | H | SO2-NH2 | H | F | H | H | H | N.A. | N.A. | N.A. | N.A. | N.A. |
| AG-09/86 | H | H | SO2-NH2 | H | O-CH3 | H | H | H | N.A. | N.A. | N.A. | N.A. | N.A. |
| AG-09/87 | H | H | SO2-NH2 | H | H | H | NO2 | H | N.A. | N.A. | N.A. | N.A. | N.A. |
| AG-09/88 | H | H | SO2-NH2 | H | H | CF3 | H | H | N.A. | N.A. | N.A. | N.A. | N.A. |
| AG-09/89 | CN | H | H | H | H | H | F | H | N.A. | N.A. | N.A. | N.A. | N.A. |
| AG-09/90 | H | Br | CH3 | H | H | H | Cl | H | N.A. | N.A. | N.A. | N.A. | N.A. |
| AG-09/91 | 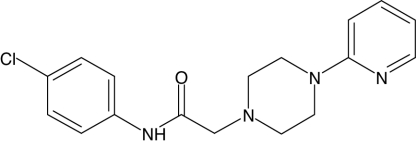 |
N.A. | N.A. | N.A. | N.A. | N.A. | |||||||
N.A., very low response (efficacy <20% of positive control) or no activity (no Ca2+ flux response was observed during the 3 min after addition of compounds under investigation).
Fig. 2.

Analysis of Ca2+ mobilization in phagocytes treated with AG-09/1 and AG-09/4. HL-60-FPR1 and HL-60-FPR2 cells (A and B) or human neutrophils (C and D) were loaded with fluorometric imaging plate reader calcium 3 dye, and Ca2+ flux was analyzed, as described under Materials and Methods. Responses were normalized to the response induced by 5 nM fMLF for HL-60-FPR1 cells and neutrophils, or 5 nM WKYMVm for HL-60-FPRL1 cells, which were assigned a value of 100%. D, human neutrophils were treated with 5 μM concentrations of the compounds under investigation (AG-09/1 and AG-09/4), 5 nM fMLF (positive control), or 1% DMSO (negative control), and Ca2+ flux was monitored for the indicated times (arrow indicates when treatment was added). The data are from one experiment that is representative of three independent experiments.
A plot of EC50 values for Ca2+ mobilization versus chemotactic activity in human neutrophils demonstrated a good linear correlation (r = 0.638; p < 0.05) between these responses for 11 of the 12 compounds shown in Table 1 (Supplemental Figure S1). The only outlier was AG-26. Although the reason for this discrepancy is not clear, it is possible that AG-26 may have decreased stability during the longer incubation period needed for the chemotaxis assay (60 min versus 5 min for the Ca2+ mobilization assay) and could be hydrolyzed or inactivated, resulting in relatively lower chemotactic activity. Further studies are ongoing to evaluate this issue.
SAR Analysis.
Based on structures of the selected compounds, additional analogs were selected and evaluated for FPR1/FPR2 agonist activity in both RBL and HL-60 cells. These analogs included 25 benzimidazole derivatives (designated as AG-09/11 through AG-09/35), which are analogs of FPR1 agonists AG-09/1 and AG-09/2 (Table 2); 19 phenylurea derivatives (designated as AG-09/36 through AG-09/54), which are analogs of FPR2 agonist AG-26 (Table 3); 37 2-(N-piperazinyl)acetamide derivatives (designated as AG-09/55 through AG-09/91), which are analogs of FPR2 agonists AG-09/3 and AG-09/4 (Table 4); and 11 acetohydrazide derivatives (designated as AG-09/92 through AG-09/102), which are analogs of FPR2 agonist AG-09/7 (Supplemental Table S1). As a result of this secondary screening, 4 novel FPR1-specific agonists, 14 novel FPR2-specific agonists, and 6 compounds with mixed FPR1/FPR2 activity were identified (Tables 1–4 and Supplemental Table S1). Note that FPR1/FPR2 agonists selected in the primary screening and bearing the relevant scaffolds (AG-09/1, AG-09/2, AG-26, AG-09/3, AG-09/4, and AG-09/7) are included in their respective tables for completeness in SAR analysis.
Benzimidazole Derivatives.
Of the 26 benzimidazole derivatives analyzed, six were FPR1-specific agonists (AG-09/1, AG-09/2, AG-09/13, AG-09/18, AG-09/19, and AG-09/21), and six were mixed type FPR1/FPR2 agonists (AG-09/16, AG-09/17, AG-09/20, and AG-09/22 through AG-09/24) (Table 2). All active derivatives contained either a para methoxy or ethoxy group in the benzene moiety of the benzimidazole cycle, which is an essential feature for activity (e.g., compare active AG-09/13 or AG-09/18 with inactive AG-09/12 or AG-09/11, respectively). Substituents of benzene ring A also had effects on activity and receptor specificity, although a wider range of modifications was tolerated in this ring. More than half of the active benzimidazole agonists had methoxy or ethoxy substituents on benzene ring A, mostly in the para position. However, if the alkoxy chain was elongated to four carbons, activity was lost (e.g., compare active AG-09/13 and AG-09/16 with inactive AG-09/15 and AG-09/14, respectively). This may be due to increased hydrophobicity of these compounds, because the LogP values increased from 3.941 in active AG-09/2 and AG-09/13 to 5.004 and 5.535 in inactive AG-09/14 and AG-09/15, respectively). Substitution of the para methoxy group of phenyl ring A with a nitro group or bromine (compare AG-09/2 with AG-09/1 or AG-09/21, respectively) did not change activity or specificity for FPR1; however, replacing this group with chlorine (AG-09/20) led to loss of receptor specificity. Although moving chlorine from the para to the ortho position of benzene ring A (compare AG-09/20 with AG-09/22) had no effect on activity or specificity, introduction of an additional chlorine at the meta position (compare AG-09/20 with AG-09/31) resulted in complete loss of activity.
N′-Phenylurea Derivatives.
Of the 20 phenylurea derivatives, five were FPR2-specific agonists (AG-26, AG-09/37, AG-09/38, AG-09/42, and AG-09/43) (Table 3). All active derivatives contained a para methoxy group in benzene ring B, which seems to be an essential feature for activity of these derivatives (e.g., compare active AG-09/37 with inactive AG-09/36 or active AG-09/38 with inactive AG-09/44). However, introduction of additional methoxy groups to ring B resulted in total loss of activity (e.g., compare active AG-09/38 or AG-26 with inactive AG-09/50 or AG-09/48, respectively). Most active derivatives contained a halogen atom in the para position of benzene ring A. However, the presence of the halogen atom was not absolutely essential for biological activity, as AG-09/37 was also highly active. Moving the halogen atom from the para position to the meta (AG-09/43) and then ortho (AG-09/39) positions resulted in decreased and completely lost activity, respectively.
2-(N-Piperazinyl)acetamide Derivatives.
Of the 39 2-(N-piperazinyl)acetamide derivatives, 8 were FPR2-specific agonists (AG-09/3, AG-09/4, AG-09/73 through AG-09/77, and AG-09/82) and none were FPR1 agonists (Table 4). All active derivatives contained a bromine in the para position of benzene ring A, which was required for activity (e.g., compare active AG-09/73 with inactive AG-09/55). Furthermore, moving bromine from the para position (AG-09/73) to the ortho (AG-09/71) or meta (AG-09/72) position resulted in loss of activity. Finally, replacement of para bromine in ring A with a variety of other substituents resulted in loss of activity.
Acetohydrazide Derivatives.
Of the 12 acetohydrazide derivatives, 5 compounds were FPR2-specific agonists (AG-09/7, AG-09/92, AG-09/92, AG-09/96, AG-09/101, and AG-09/102) with low efficacy for most of the compounds, except for AG-09/101 (Supplemental Table S1). No clear SAR emerged from modification of position R2.
As described above, a number of compound analogs had no activity or had low efficacy. Thus, we considered whether such compounds might be FPR antagonists by pretreating HL-60-FPR1 and HL60-FPR2 cells with selected compounds and then evaluating subsequent responses to control peptide agonists (10 nM fMLF for FPR1 and 5 nM WKYMVm for FPR2). Pretreatment of cells for 30 min with a dose range (1–50 μM) of selected compounds that were inactive in the Ca2+ mobilization assay (AG-09/15, AG-09/32, AG-09/94, AG-09/95, AG-09/97, and AG-09/102) had no inhibitory effect on Ca2+ flux induced by either fMLF or WKYMVm, suggesting that these compounds were not receptor antagonists (data not shown). In contrast, pretreatment of HL-60-FPR2 with two low-efficacy compounds (AG-09/75 and AG-09/76) resulted in a dose-dependent loss of the response induced by subsequent treatment with WKYMVm (Supplemental Fig. S2). Thus, it seems that these low-efficacy agonists may still be able to desensitize cells but are probably not receptor antagonists, because they can directly induce a Ca2+ flux. Nevertheless, characterization of the mechanisms involved in this inhibition will require further studies.
Pharmacophore Modeling of FPR1/FPR2 Ligand Recognition.
Because X-ray structures of FPR1 and FPR2 are not available, it was not possible to use a docking study for modeling the interaction of our agonists with the active sites. However, ligand-based methods have been developed to address this issue, such as rapid overlay of chemical structures (Grant et al., 2001; Bologa et al., 2006). We used a ligand-based approach to molecular modeling that uses the field point approach developed by Cheeseright et al. (2006, 2007) (see Materials and Methods). This approach allowed us to compare diverse molecules in terms of their field similarity (Cheeseright et al., 2006) and create an alignment of their bioactive conformations as “seen” by the receptor (Low and Vinter, 2008). This alignment or template provides an accurate pharmacophore model of an unknown active site (Cheeseright et al., 2006, 2007; Low and Vinter, 2008).
At least 3 molecules with different scaffolds are required for development of a template of the receptor site. For development of the FPR1 ligand-binding site template, we chose 1910-5441 (Edwards et al., 2005) and AG-14 (Schepetkin et al., 2008), two previously reported FPR1 agonists, and AG-09/2. Two previously reported FPR2 agonists, Bürli-25 (Bürli et al., 2006) and Frohn-11 (Frohn et al., 2007), and three agonists identified here (AG-09/5, AG-09/74, and AG-26) were selected for development of the FPR2 ligand-binding site template. Using the conformer hunt algorithm (FieldTemplater Version 2.0.1), we generated up to 100 independent conformations lying within 6-kcal/mol energy gap above the lowest-energy geometry for each of the molecules. Field point patterns were calculated for these conformations, and the clique algorithm of FieldTemplater was applied to obtain the best alignment for each group of agonists. The corresponding multimolecule templates for FPR1 and FPR2 are shown in Fig. 3 A and B, respectively. Despite high flexibility of the molecules investigated, good alignments are achieved with certain conformations among all conformational pools generated by the program. Furthermore, the presence of common key features indicates that the molecular geometries involved in these templates can be regarded as bioactive conformations complementary to the proposed active sites of FPR1 and FPR2. In the FPR1 template, negative field points (blue spheres) dominate over the positive field points (red spheres), whereas a similar number of negative and positive field points are present in the FPR2 template. The abundance of blue field points in the FPR1 template corresponds to the receptor's positively charged regions or to amino and hydroxyl groups in the active site that are capable of forming hydrogen bonds with electronegative atoms of the agonist. In contrast, an arc-shaped cloud of red field points is present in the FPR2 template, suggesting that mainly electronegative groups of the receptor are located close to where the central part of the agonist molecule interacts with the receptor's active site. Cores of both templates contain numerous orange spheres representing hydrophobic fragments of the molecular scaffolds. The quality of fit S was 0.586 and 0.681 for the FPR1 and FPR2 templates, respectively, according to the relative scale adopted within FieldTemplater. Overall, these templates can be helpful in an assessment of the ability of putative agonists to bind FPR1 and FPR2.
Fig. 3.

Multimolecule templates for FPR1 and FPR2. A, FPR1 template developed from compounds AG-09/2, AG-14, and 1910-5441. B, FPR2 template developed from compounds AG-09/5, AG-09/74, AG-26, Frohn-11, and Bürli-25. Field points are colored as follows: blue, electron-rich (negative); red, electron-deficient (positive); yellow, van der Waals attractive (steric); and orange, hydrophobic.
Discussion
FPRs have been implicated in the control of many inflammatory processes, promoting the recruitment and infiltration of phagocytes to sites of inflammation (for review, see Ye et al., 2009). Indeed, targeted disruption of the gene coding for the mouse counterpart of FPR1 rendered mice more susceptible to bacterial infection without significant phenotypic alteration (Gao et al., 1999), supporting the role of FPRs in innate host defense based on recognition of bacterial-derived agonists. However, the expression pattern of FPRs in nonphagocytic cells, especially that of FPR2, suggests that these receptors participate in functions other than innate immunity and that these receptors may represent unique targets for therapeutic drug design. FPR2 is activated by numerous and chemically unrelated ligands; however, the responses induced by these ligands acting at the same receptor vary widely and can even oppose each other. For example, annexin 1 accelerates neutrophil apoptosis, whereas serum amyloid A induces an antiapoptotic signal (El Kebir et al., 2008). Most of these agonists are chemotactic and elicit proinflammatory responses in human leukocytes; however, lipoxin A4 is an anti-inflammatory agonist and leads to an inhibitory signaling cascade through FPR2 (Serhan, 2007). On the other hand, the mechanisms by which different FPR agonists are able to activate a given set of signal transduction pathways and induce a unique array of phagocyte functions remains a mystery. The availability of structurally defined small-molecule agonists for FPRs is clearly of substantial benefit in addressing this question and facilitating SAR analysis to model agonist binding features, and several such agonists have been reported (for review, see Ye et al., 2009). The use of small-molecule agonists facilitates modification of agonist structure for SAR analysis, which is somewhat difficult with peptide agonists. In addition, peptides are difficult to make and administer as therapeutic agents, making small-molecule chemical compounds a better choice for future clinical applications. Here, we screened a library of small-molecule synthetic compounds and used SAR analysis to identify a number of novel FPR agonists, some specific for FPR1, others specific for FPR2, and still others with mixed FPR1/FPR2 agonist activity.
Screening of a 6000-compound library resulted in the selection of 12 FPR agonists with EC50 values in the low micromolar range (0.2% hit rate). Based on the structures of these agonists, we purchased commercially available benzimidazole, N′-phenylurea, 2-(N-piperazinyl)acetamide, and phenylacetohydrazide derivatives and found an excellent hit rate (21.6–26.3%) among these highly selected analogs. We discovered six FPR1-specific agonists among derivatives with a 2-(benzimidazol-2-ylsulfanyl)-N-phenylacetamide scaffold. It is noteworthy that this represents a unique chemotype for FPR1 agonists, because only two scaffolds have been reported so far for FPR1 agonists: (3-benzyloxyphenyl)bis(5,5-dimethylcyclohexane-1,3-dione-2-yl)methane (compound 1910-5441) (Edwards et al., 2005) and 1,3-benzodioxolane-5-carboxylic acid hydroxybenzylidene-hydrazide derivatives (compounds AG-14 and AG-104) (Schepetkin et al., 2007, 2008). Our screening also identified FPR2-specific agonists among the N′-phenylurea derivatives (five compounds), piperazine derivatives (eight compounds), phenylacetohydrazide derivatives (five compounds), dibenzoylhydrazine derivatives (AG-09/5), 5-(2-thienyl)-pentanamide derivatives (AG-09/6), and quinazolinone derivatives (AG-09/8). It is noteworthy that these selected agonists represent several novel chemical scaffolds that have not been reported previously for FPR1 or FPR2 agonists. One exception is the quinazolinone scaffold (backbone for AG-09/8), which has the same backbone scaffold as Quin-C1 (Nanamori et al., 2004; Zhou et al., 2007). It is noteworthy that the piperazine scaffold was reported previously to be the backbone scaffold for selective agonists of the dopamine D4 receptor, which is another G protein-coupled receptor (Matulenko et al., 2004). Whether our specific compounds are also D4 receptor agonists has not been evaluated. In addition, two compounds with the piperazine scaffold activated Ca2+ flux in human neutrophils, but did not activate FPR1- or FPR2-transfected cells. The receptor for these two agonists remains unknown. In any case, further development of these novel classes of agonists and analysis of additional derivatives may provide important clues to understanding FPR1/FPR2 structure and function.
FPR1 and FPR2 belong to a receptor family for which X-ray structures of ligand-receptor complexes are not available. Thus, ligand-based approaches can be useful in such cases. Well known ligand-based methods, such as comparative molecular field analysis (Cramer, III et al., 1989) and comparative molecular similarity indices analysis (Böhm et al., 1999), are strongly dependent on the alignment procedure, which gives much better results for structurally related compounds with a common scaffold. On the other hand “scaffold-hopping” using different scaffolds remains a challenging task in drug design. Cheeseright et al. (2006, 2007) developed field point methods for aligning molecules with different molecular skeletons. Instead of calculating field values in numerous intersections of a grid near a molecule (e.g., as in comparative molecular field analysis), this novel approach uses extrema of the molecular field obtained with various probe atoms placed in different positions near a molecule in a given conformation. According to this approach, compounds with significantly different scaffolds produce a similar biological response if they effectively bind to the same active site of a receptor. Taking into account that field point patterns can be easily found and compared for many conformations, the field point approach is an excellent ligand-based three-dimensional method allowing scaffold-hopping. Without knowledge about a receptor structure, it is possible to find a limited number of alignments for chemically diverse compounds in certain conformations in which molecular fields and/or volumes are very similar. If all of these compounds have high affinity for the same receptor, it can be assumed that they participate in the alignment in their bioactive conformations and are “seen” identically by the receptor (Low and Vinter, 2008). Thus, such an alignment (i.e., template) is considered a model for the unknown active site.
Through field point analysis of several small molecule agonists identified in this study and others previously reported, we were able to model the main features of FPR1 and FPR2 ligand-binding sites. It should be noted that such modeling was not possible previously because only a few FPR subtype-specific small-molecule agonists with different molecular scaffolds were known. Moreover, conventional molecular modeling, docking, and virtual screening techniques require knowledge of the target binding site or well characterized ligand (agonist/antagonist) structural cores, which are not available. Thus, discovery of additional highly specific agonists for either FPR1 or FPR2 allowed us to use the field point approach and build templates on the basis of a relatively low number of diverse agonists with high activity. These templates provide information regarding ligand requirements for the specific FPRs, as field patterns of the selected agonists give a ligand-based view of the active sites of these receptors. Note that the results obtained can be regarded as preliminary qualitative information for modeling active sites of these receptors. More detailed investigations of additional small-molecule agonists, as they are obtained, will allow us to extend the data set for the construction of more sophisticated models with higher predictive ability on a quantitative level.
Edwards et al. (2005) derived a three-point pharmacophore model for FPR1, which consisted of two hydrogen bond acceptors and one hydrophobic point located within certain distance intervals from each other. Although field points in the present study are not centered at real atoms or functional groups and thus cannot be regarded as “classic” pharmacophore points, it is possible to measure distances between real molecular fragments in the best single-molecule template and compare them with Edwards' reported values. We have found that the azomethine nitrogen atom (point A), oxygen atom of methoxy group (point B), and the center of phenyl ring (point C) within the bioactive conformation of AG-09/2 are located at the following distances: 5.3 Å (A-B), 6.9 Å (A-C), and 5.8 Å (B-C). By comparison, the two hydrogen bond acceptors (A, B) and hydrophobic point C in Edwards' model are characterized by appropriate distance intervals of: 3 to 6 Å (A-B), 5 to 7 Å (A-C), and 4 to 7 Å (B-C) (Edwards et al., 2005). Thus, the results of our modeling are in agreement with the “classic” three-centered pharmacophore model obtained previously. In addition, our model provides features not available in the Edwards model. For example, the compact group of red spheres in the lower part of Fig. 3A should be considered a potentially important characteristic of the template, representing interaction with electronegative features of the ligand-binding site. Investigation of a wider series of highly active FPR agonists in the future will bring more information about the significance of these field points.
The pharmacophore models developed here represent ligand-based views of the active sites for FPR1 and FPR2. As such, the spatial arrangement and field point patterns of the molecules in their proposed bioactive conformations does not allow us to deduce an unambiguous correspondence between molecular characteristics and amino acid sequences in homology models of these receptors. Among the notable differences between FPR1 and FPR2 sequences are the following nonconserved changes in FPR2: R84S, K85M, R163F, and D284N. All of these residues have been reported previously to participate in peptide ligand binding (Lala et al., 1999). Note that each of these changes results in loss of positive charge in the peptide binding pocket. Thus, one could speculate that these changes may lead to a more electronegative binding pocket, which would correspond to the increased number of red (electronegative) field points in FPR2 template compared with the FPR1 template (see Fig. 3). However, further work is clearly necessary to address the relationship of ligand-based pharmacophore models with specific amino acid sequences identified in homology models.
Young et al. (2009) identified novel FPR antagonists using a high-throughput flow cytometry screen. Thus, we selected the two most active antagonists for FPR1 and FPR2 (3570-0208 and 24428242 for FPR1; BB-V-115 and 796276 for FPR2) and evaluated the alignment of these compounds on the receptor templates developed here. The best alignments for these inhibitors are shown in Supplemental Fig. S3 (field points of the templates are shown by polyhedra, field points of inhibitor molecules are shown by spheres, and inhibitor conformations are depicted with gray skeletons). Although the two FPR1 inhibitors produced satisfactory geometric overlays on the corresponding FPR1 template, it is evident that the dominating negative field points of the template (blue polyhedra) did not have closely located counterparts (blue spheres) among field points for molecules 3570-0208 and 24428242. The best alignments of the two most active FPR2 inhibitors did not have good geometric fits with the FPR2 template, and nonoverlapping fragments of the molecules were observed for BB-V-115 and 796276 (see arrows in Supplemental Fig. S3, C and D, respectively). Likewise, molecules BB-V-115 and 796276 did not occupy the receptor hydrophobic pocket represented by the orange polyhedra (Supplemental Fig. S3, C and D). Thus, these results suggest that the binding domains could be distinct for these antagonists and agonists. This idea is supported by pharmacophore modeling studies of Ferrari et al. (2006), who concluded that the binding site for FPR antagonists was different from that of agonists. Another possibility is that the interaction of agonists and antagonists with a similar FPR binding domain may involve distinct arrays of molecular interactions that result in either receptor activation or inhibition. Further work will be necessary to evaluate the nature of these interactions.
FPR1/FPR2 agonists, such as those developed here, have potential value as immune modulators to enhance phagocyte host defense against pathogens and may also represent unique vaccine adjuvants. FPR1/FPR2 agonists have been reported to have beneficial therapeutic effects in a variety of conditions. For example, stimulation of FPR2 with lipoxin A4 and/or annexin 1/annexin 1-derived peptides leads to anti-inflammatory responses (Serhan, 2007). In addition, agonists of FPR1 and FPR2 [i.e., fMLF and MMK-1 (LESIFRSLLFRVM), respectively] prevented alopecia in neonatal rats induced by the anticancer agent etoposide (Tsuruki et al., 2007). Furthermore, the ability of FPR2 peptide agonists to up-regulate endogenous tumor necrosis factor-related apoptosis-inducing ligand expression has been linked to tumoricidal activity (Lin et al., 2007). Thus, further development of specific small-molecule FPR agonists represents an important avenue to pursue for therapeutic purposes.
Supplementary Material
The online version of this article (available at http://molpharm.aspetjournals.org) contains supplemental material.
This work was supported in part by the National Institutes of Health National Center for Research Resources [Grant P20-RR020185]; the National Institutes of Health [Contract HHSN266200400009C]; an equipment grant from the M.J. Murdock Charitable Trust; and the Montana State University Agricultural Experimental Station.
Article, publication date, and citation information can be found at http://molpharm.aspetjournals.org.
doi:10.1124/mol.109.060673.
- fMLF
- N-formyl-methionyl-leucyl-phenyalanine
- FPR
- formyl peptide receptor
- FPRL
- formyl peptide receptor like
- SAR
- structure-activity relationship
- DMSO
- dimethyl sulfoxide
- WKYMVm
- Trp-Lys-Tyr-Met-Val-d-Met
- HBSS−
- Hanks' balanced salt solution without Ca2+ and Mg2+
- HBSS+
- Hanks' balanced salt solution containing 10 mM HEPES and Ca2+ and Mg2+
- FBS
- fetal bovine serum
- ROS
- reactive oxygen species
- AG-14
- 1,3-benzodioxolane-5-carboxylic acid 4′-benzyloxy-3′-methoxybenzylidene-hydrazide)
- 1910-5441
- (3-benzyloxyphenyl)bis(5,5-dimethylcyclohexane-1,3-dione-2-yl)methane
- Bürli-25
- N-(4-bromophenyl)-N′-(1,5-dimethyl-3-oxo-2-phenyl-2,3-dihydro-1H-pyrazol-4-yl)urea
- Frohn-11
- 1-((5-methoxyindol-2-yl)carbonyl)-3-(2-ethylbenzimidazol-1-yl)(3R)pyrrolidine
- 3570-0208
- 7-acetoxy-6-ethyl-2-methyl-3-(1-methylbenzimidazol-2-yl)-4-oxo-4H-chromene
- BB-V-115
- N-(5-imidazo]1,2-a]pyrimidin-2-yl-2-methoxyphenyl)-isobutyramide
- 24428242
- 3-(2-chlorophenyl)-4-oxo-2-trifluoromethyl-4H-chromen-7-yl ester of thiophene-2-carboxylic acid
- 796276
- 2-[3-(4-methylpiperazin-1-yl)-6-oxo-6H-anthra[1,9-cd]isoxazol-5-ylamino]-ethyl ester of acetic acid.
References
- Bao L, Gerard NP, Eddy RL, Jr., Shows TB, Gerard C. (1992) Mapping of genes for the human C5a receptor (C5AR), human FMLP receptor (FPR), and two FMLP receptor homologue orphan receptors (FPRH1, FPRH2) to chromosome 19. Genomics 13: 437–440 [DOI] [PubMed] [Google Scholar]
- Böhm M, St rzebecher J, Klebe G. (1999) Three-dimensional quantitative structure-activity relationship analyses using comparative molecular field analysis and comparative molecular similarity indices analysis to elucidate selectivity differences of inhibitors binding to trypsin, thrombin, and factor xa. J Med Chem 42: 458–477 [DOI] [PubMed] [Google Scholar]
- Bologa CG, Revankar CM, Young SM, Edwards BS, Arterburn JB, Kiselyov AS, Parker MA, Tkachenko SE, Savchuck NP, Sklar LA, Oprea TI, Prossnitz ER. (2006) Virtual and biomolecular screening converge on a selective agonist for GPR30. Nat Chem Biol 2: 207–212 [DOI] [PubMed] [Google Scholar]
- Boulay F, Tardif M, Brouchon L, Vignais P. (1990) The human N-formylpeptide receptor. Characterization of two cDNA isolates and evidence for a new subfamily of G-protein-coupled receptors. Biochemistry 29: 11123–11133 [DOI] [PubMed] [Google Scholar]
- Bürli RW, Xu H, Zou X, Muller K, Golden J, Frohn M, Adlam M, Plant MH, Wong M, McElvain M, Regal K, Viswanadhan VN, Tagari P, Hungate R. (2006) Potent hFPRL1 (ALXR) agonists as potential anti-inflammatory agents. Bioorg Med Chem Lett 16: 3713–3718 [DOI] [PubMed] [Google Scholar]
- Cheeseright T, Mackey M, Rose S, Vinter A. (2006) Molecular field extrema as descriptors of biological activity: definition and validation. J Chem Inf Model 46: 665–676 [DOI] [PubMed] [Google Scholar]
- Cheeseright T, Mackey M, Rose S, Vinter A. (2007) Molecular field technology applied to virtual screening and finding the bioactive conformation. Expert Opin Drug Discov 2: 131–144 [DOI] [PubMed] [Google Scholar]
- Christophe T, Karlsson A, Rabiet MJ, Boulay F, Dahlgren C. (2002) Phagocyte activation by Trp-Lys-Tyr-Met-Val-Met, acting through FPRL1/LXA4R, is not affected by lipoxin A4. Scand J Immunol 56: 470–476 [DOI] [PubMed] [Google Scholar]
- Cramer RD, 3rd, Patterson DE, Bunce JD. (1989) Recent advances in comparative molecular field analysis (CoMFA). Prog Clin Biol Res 291: 161–165 [PubMed] [Google Scholar]
- Edwards BS, Bologa C, Young SM, Balakin KV, Prossnitz ER, Savchuck NP, Sklar LA, Oprea TI. (2005) Integration of virtual screening with high-throughput flow cytometry to identify novel small molecule formylpeptide receptor antagonists. Mol Pharmacol 68: 1301–1310 [DOI] [PubMed] [Google Scholar]
- El Kebir D, József L, Filep JG. (2008) Opposing regulation of neutrophil apoptosis through the formyl peptide receptor-like 1/lipoxin A4 receptor: implications for resolution of inflammation. J Leukoc Biol 84: 600–606 [DOI] [PubMed] [Google Scholar]
- Ferrari C, Macchiarulo A, Costantino G, Pellicciari R. (2006) Pharmacophore model for bile acids recognition by the FPR receptor. J Comput Aided Mol Des 20: 295–303 [DOI] [PubMed] [Google Scholar]
- Frohn M, Xu H, Zou X, Chang C, McElvaine M, Plant MH, Wong M, Tagari P, Hungate R, Bürli RW. (2007) New ‘chemical probes’ to examine the role of the hFPRL1 (or ALXR) receptor in inflammation. Bioorg Med Chem Lett 17: 6633–6637 [DOI] [PubMed] [Google Scholar]
- Gao JL, Lee EJ, Murphy PM. (1999) Impaired antibacterial host defense in mice lacking the N-formylpeptide receptor. J Exp Med 189: 657–662 [DOI] [PMC free article] [PubMed] [Google Scholar]
- Gordon S. (2007) The macrophage: past, present and future. Eur J Immunol 37 (Suppl 1): S9–S17 [DOI] [PubMed] [Google Scholar]
- Grant JA, Pickup BT, Nicholls A. (2001) A smooth permittivity function for Poisson-Boltzmann solvation methods. J Comput Chem 22: 608–640 [Google Scholar]
- Lala A, Gwinn M, De Nardin E. (1999) Human formyl peptide receptor function—role of conserved and nonconserved charged residues. Eur J Biochem 264: 495–499 [DOI] [PubMed] [Google Scholar]
- Le Y, Murphy PM, Wang JM. (2002) Formyl-peptide receptors revisited. Trends Immunol 23: 541–548 [DOI] [PubMed] [Google Scholar]
- Ley K, Laudanna C, Cybulsky MI, Nourshargh S. (2007) Getting to the site of inflammation: the leukocyte adhesion cascade updated. Nat Rev Immunol 7: 678–689 [DOI] [PubMed] [Google Scholar]
- Lin C, Wei W, Zhang J, Liu S, Liu Y, Zheng D. (2007) Formyl peptide receptor-like 1 mediated endogenous TRAIL gene expression with tumoricidal activity. Mol Cancer Ther 6: 2618–2625 [DOI] [PubMed] [Google Scholar]
- Low CM, Vinter JG. (2008) Rationalizing the activities of diverse cholecystokinin 2 receptor antagonists using molecular field points. J Med Chem 51: 565–573 [DOI] [PubMed] [Google Scholar]
- Matulenko MA, Hakeem AA, Kolasa T, Nakane M, Terranova MA, Uchic ME, Miller LN, Chang R, Donnelly-Roberts DL, Namovic MT, Moreland RB, Brioni JD, Stewart AO. (2004) Synthesis and functional activity of (2-aryl-1-piperazinyl)-N-(3-methylphenyl)acetamides: selective dopamine D4 receptor agonists. Bioorg Med Chem 12: 3471–3483 [DOI] [PubMed] [Google Scholar]
- Murphy PM, Ozçelik T, Kenney RT, Tiffany HL, McDermott D, Francke U. (1992) A structural homologue of the N-formyl peptide receptor. Characterization and chromosome mapping of a peptide chemoattractant receptor family. J Biol Chem 267: 7637–7643 [PubMed] [Google Scholar]
- Nanamori M, Cheng X, Mei J, Sang H, Xuan Y, Zhou C, Wang MW, Ye RD. (2004) A novel nonpeptide ligand for formyl peptide receptor-like 1. Mol Pharmacol 66: 1213–1222 [DOI] [PubMed] [Google Scholar]
- Oppenheim JJ, Tewary P, de la Rosa G, Yang D. (2007) Alarmins initiate host defense. Adv Exp Med Biol 601: 185–194 [DOI] [PubMed] [Google Scholar]
- Schepetkin IA, Kirpotina LN, Khlebnikov AI, Quinn MT. (2007) High-throughput screening for small-molecule activators of neutrophils: identification of novel N-formyl peptide receptor agonists. Mol Pharmacol 71: 1061–1074 [DOI] [PubMed] [Google Scholar]
- Schepetkin IA, Kirpotina LN, Tian J, Khlebnikov AI, Ye RD, Quinn MT. (2008) Identification of novel formyl peptide receptor-like 1 agonists that induce macrophage tumor necrosis factor α production. Mol Pharmacol 74: 392–402 [DOI] [PMC free article] [PubMed] [Google Scholar]
- Schiffmann E, Corcoran BA, Wahl SM. (1975) N-formylmethionyl peptides as chemoattractants for leucocytes. Proc Natl Acad Sci U S A 72: 1059–1062 [DOI] [PMC free article] [PubMed] [Google Scholar]
- Serhan CN. (2007) Resolution phase of inflammation: novel endogenous anti-inflammatory and proresolving lipid mediators and pathways. Annu Rev Immunol 25: 101–137 [DOI] [PubMed] [Google Scholar]
- Tosi MF. (2005) Innate immune responses to infection. J Allergy Clin Immunol 116: 241–249; quiz 250 [DOI] [PubMed] [Google Scholar]
- Tsuruki T, Takahata K, Yoshikawa M. (2007) Mechanism of the protective effect of intraperitoneally administered agonists for formyl peptide receptors against chemotherapy-induced alopecia. Biosci Biotechnol Biochem 71: 1198–1202 [DOI] [PubMed] [Google Scholar]
- Vinter JG. (1994) Extended electron distributions applied to the molecular mechanics of some intermolecular interactions. J Comput Aided Mol Des 8: 653–668 [DOI] [PubMed] [Google Scholar]
- Ye RD, Boulay F, Wang JM, Dahlgren C, Gerard C, Parmentier M, Serhan CN, Murphy PM. (2009) International Union of Basic and Clinical Pharmacology. LXXIII. Nomenclature for the formyl peptide receptor (FPR) family. Pharmacol Rev 61: 119–161 [DOI] [PMC free article] [PubMed] [Google Scholar]
- Ye RD, Cavanagh SL, Quehenberger O, Prossnitz ER, Cochrane CG. (1992) Isolation of a cDNA that encodes a novel granulocyte N-formyl peptide receptor. Biochem Biophys Res Commun 184: 582–589 [DOI] [PubMed] [Google Scholar]
- Young SM, Bologa CM, Fara D, Bryant BK, Strouse JJ, Arterburn JB, Ye RD, Oprea TI, Prossnitz ER, Sklar LA, Edwards BS. (2009) Duplex high-throughput flow cytometry screen identifies two novel formylpeptide receptor family probes. Cytometry A 75: 253–263 [DOI] [PMC free article] [PubMed] [Google Scholar]
- Zhou C, Zhang S, Nanamori M, Zhang Y, Liu Q, Li N, Sun M, Tian J, Ye PP, Cheng N, Ye RD, Wang MW. (2007) Pharmacological characterization of a novel nonpeptide antagonist for formyl peptide receptor-like 1. Mol Pharmacol 72: 976–983 [DOI] [PubMed] [Google Scholar]
Associated Data
This section collects any data citations, data availability statements, or supplementary materials included in this article.