

Abstract
Sampling of the lower airways of the adult cystic fibrosis (CF) lung has received insufficient detailed consideration, with the importance of sampling strategies for bacteriological outcome not known. Although spontaneously expectorated sputum (SES) samples are often used for diagnostic bacteriological analysis, induced sputum (IS) methods have advantages. This study examined whether significant differences in bacterial content were detected when using a culture-independent, molecular profiling technique to analyze SES or IS samples. Moreover, this work examined what trends relating to bacterial species distributions and reproducibility were found in sequentially induced sputum samples and what implications this has for pathogen detection. Terminal restriction fragment length polymorphism (T-RFLP) analysis was performed on a SES sample and 4 subsequent IS samples taken at 5-min intervals from 10 clinically stable, adult CF patients. This was repeated over 3 sampling days, with variability between samples, induction periods, and sampling days determined. A diverse range of bacterial species, including potentially novel pathogens, was found. No significant difference in bacterial content was observed for either SES or serial IS samples. On average, the analysis of a single sample from any time point resolved ∼58% of total bacterial diversity achieved by analysis of an SES sample and 4 subsequent IS samples. The reliance on analysis of a single respiratory sample was not sufficient for the detection of recognized CF pathogens in all instances. Close correlation between T-RFLP and microbiological data in the detection of key species indicates the importance of these findings in routine diagnostics for the detection of recognized and novel CF pathogens.
The selection of appropriate treatment for cystic fibrosis (CF) airway infections, as in other diagnostic microbiological scenarios, requires knowledge of what bacterial species are present in a sample (3). However, for this to provide information of clinical use, it is essential that the material analyzed reflect the composition of secretions in the lower airways and that this material be collected in a reproducible manner. If this is not the case, bias is introduced (9, 11, 20).
Culture-based diagnostic microbiology has traditionally focused on the detection of a small number of species considered to be of clinical interest. Culture-independent strategies that characterize the entire bacterial community present in samples are increasingly being used and are finding new roles in a diagnostic context (33). These data support the need to view CF bacterial respiratory infections as polymicrobial and, as such, more complex than previously considered (10, 15, 27-32, 38, 39). The prevention of bias through the accurate analysis of samples that represent all bacterial species present has therefore become crucial if the roles of these species in disease are to be understood.
Just as the means of analysis is important, so too is the way the sample is obtained. By far the most widely used sample in productive patients is spontaneously expectorated sputum (SES). SES samples have been shown to have high concordance with bronchoalveolar lavage samples in microbial terms (17), with the impact of contamination during the process of expectoration being minimal (31). Further, the use of SES samples has significant advantages in that they can be collected with a short notice period and with high frequency.
Where SES samples cannot be obtained, for example, in nonproductive respiratory conditions such as asthma (6, 14, 22) or chronic obstructive pulmonary disease (COPD) (4) or in very young CF patients (8, 24), sputum production may be induced by the inhalation of nebulized saline (8, 18, 34, 35).
Induced sputum (IS) samples have been shown to be reproducible in terms of their bacterial burden (25). Further, it has been suggested that the duration of the period of induction may determine the area from which the sample is drawn, thus allowing different regions of the airways to be selectively analyzed. In this way, IS samples might provide topographical data about the distribution of bacteria within the airways.
Gershman et al. reported that the duration of sputum induction significantly affected the cellular and biochemical composition of induced sputum, with the large airways sampled at the beginning of sputum induction and peripheral airways and alveoli sampled at later time periods (13). In a later study, aliquots taken during 4-min intervals from clinically stable CF patients were shown to be consistent with this model in terms of their microbial content (1).
Terminal restriction fragment length polymorphism (T-RFLP) is a culture-independent molecular profiling technique that provides an ability to establish bacterial community characteristics, both in terms of the species that are present and their relative abundance, in a way not afforded in previous culture-based studies. T-RFLP, when previously applied to CF SES sample analysis, has indicated the presence of a diverse array of bacterial species (28, 30, 39). In this study, we used T-RFLP analysis as a tool to investigate three key topics. First, do the bacteria detected in SES samples differ from those in IS samples? Second, is there a trend in the species detected in sequential IS samples? If so, that might provide insight into bacterial heterogeneity between different regions of the CF airways. Third, are more-reproducible species distributions obtained either for SES samples or after a particular induction period? If so, does this apply to species, such as Pseudomonas aeruginosa, that are considered to be CF pathogens? The differences in the bacterial communities resolved in this study and the implications for the routine diagnostic microbiological analysis of CF sputum are discussed.
MATERIALS AND METHODS
Patients.
Ten adults with CF, previously diagnosed using standard clinical and laboratory criteria, were recruited from the adult CF clinic at the Mater Adult Hospital, a regional specialist CF clinic. All subjects were ≥16 years of age and provided written informed consent. The protocol was approved by the local/regional ethics committee. Subjects were clinically stable, chronic sputum-producing outpatients who had not required any supplemental antibiotic therapy in the 14 days prior to enrollment. Maintenance medications remained stable for the duration of the study. Baseline characteristics of the study population are shown in Table 1.
TABLE 1.
Baseline characteristics of the study populationa
| Characteristic | Value |
|---|---|
| Age (yr) | 25.7 (4.3) |
| Female [no. (%)] | 5 (50) |
| Postbronchodilator FEV1 (liters) | 1.73 (0.97) |
| Postbronchodilator FEV1 % | 47.6 (19.4) |
| BMI (kg/m2) | 20.9 (2.2) |
| Genotype | |
| ΔF508 homozygous | 6 (60%) |
| ΔF508/G551D | 1 (10%) |
| ΔF508/other | 3 (30%) |
| RDAb [no. (%)] | |
| Pseudomonas aeruginosa | 9 (90%) |
| Burkholderia cepacia complex | 2 (20%) |
| Staphylococcus aureus | 1 (10%) |
| Medications [no. (%)] | |
| Azithromycin | 9 (90%) |
| Inhaled corticosteroids | 7 (70%) |
| Inhaled antibiotics | 8 (80%) |
| Inhaled DNase | 4 (40%) |
| Oral corticosteroids | 0 |
Data are shown as means (SD) except where percentages are indicated; n = 10. FEV1%, forced expiratory volume in 1 s (FEV1) expressed as a percentage of the predicted value; BMI, body mass index; RDA, routine diagnostic microbiology.
Subjects with chronic pulmonary colonization by the indicated organism as determined by standard culture techniques; some subjects were colonized with >1 organism) . Where detected by RDA, P. aeruginosa, B. cepacia, and S. aureus colonization was chronic in all patients analyzed here (>8 years of positive cultures).
Sample induction and collection.
SES and IS samples were obtained from subjects on three separate days (days 1, 3, and 7). On each of those days, following mouth-rinsing and expectoration, an SES sample was collected (referred to here as sample t0). An IS sample was collected following each of four 5-min nebulization periods. These samples have been described here as t5, t10, t15, and t20, respectively, relative to the SES sample. Sputum induction was performed after inhalation of 400 μg of salbutamol, using 4.5% hypertonic saline nebulized from a Devilbiss 2000 ultrasonic nebulizer (Devilbiss, Somerset, MA) according to the standardized protocol recommended by the European Respiratory Society Task Force (26).
All sputum samples were collected in separate sterile containers, placed on ice, and transported to the microbiology laboratory within 60 min. Specimens were processed within 3 h, and specimens were kept refrigerated (4°C) in the interim. The most purulent portion of the specimen was selected, and material was streaked directly onto horse blood agar (HBA), MacConkey, chocolate with bacitracin (CHOC-B), Sabouraud agar, Burkholderia cepacia selective agar (BCEP), and mannitol salt agar. Plates were incubated at 35 to 37°C (HBA and CHOC-B in CO2 and CHOC-B anaerobically) for at least 48 h (72 h for BCEP) and examined daily. Samples were then frozen and stored at −80°C (within 60 min) prior to molecular profiling analysis. All diagnostic microbiology was performed at the Department of Respiratory Medicine, Mater Adult Hospital, Australia, and all molecular profiling analysis was performed at the Molecular Microbiology Research Laboratory, King's College London.
DNA extraction, PCR amplification, and T-RFLP profiling.
Prior to DNA extraction, sputum samples were washed three times in 0.9% phosphate-buffered saline to remove adherent saliva. DNA extraction was performed as previously described by Rogers et al. (28).
PCR amplification using universal bacterial primers, restriction endonuclease digestion, and T-RFLP profiling were performed as described by Rogers et al. (30).
Statistical analysis.
The cumulative bacterial taxon richness (the total number of different bacterial taxa identified after each successive time point) was assessed using taxon-time relationships (TTR). The TTR is used to describe how the observed taxon richness of a community in a habitat of fixed size increases with the length of time over which the community is monitored (42, 43). The TTR is modeled with the power law equation, S = cTw, where S is the cumulative number of observed taxa over time T, c is the intercept, and w is the slope of the line or temporal scaling exponent (the rate of observation of new bacterial taxa over the course of the sampling regime), and therefore, increasing values of w can be taken as greater rates of turnover. Power law regression coefficients of determination (r2) and significance values were calculated using the Minitab software program (version 14.20; Minitab, University Park, PA).
Comparisons of community composition were calculated using the Sørenson index of similarity, which has the equation similarity = 2a/(2a + b), where a is the number of cooccurring taxa in two given samples and b is the total number of taxa occurring in one sample only. Sørenson coefficients were generated using the PAST (palaeontological statistics program, version 1.21) software program, available from the University of Oslo website link (http://folk.uio.no/ohammer/past) run by Øyvind Hammer.
Differences in taxon richness, temporal scaling exponents, and community composition of samples were performed using one-way analysis-of-variance (ANOVA) tests. Degrees of freedom, F ratio, and significance (P) values were calculated using Minitab software. In this way, differences between successive samples were determined and trends in sample composition within sample sets were assessed.
RESULTS
Initial experiments confirmed that T-RFLP profiling was reproducible. Specifically, T-RFLP profiles generated from DNA extracted from individual sputum samples were found to be indistinguishable both in terms of repeated extractions (five aliquots of a single sputum sample) and in terms of PCR amplification from an individual DNA extraction (five PCRs using a single DNA extract as a template) (Fig. 1). Within both the five replicate extractions and the five replicate amplifications, the same terminal restriction fragment (T-RF) bands were detected in each case. In terms of variation in T-RF band intensity, the standard deviations observed ranged from 3.2 to 5.8 in replicate extractions and from 0.8 to 2.9 in replicate amplifications (where values are expressed as a percentage of total signal). As such, this meant that any variation in the T-RFLP profiles observed subsequently reflected the loss or gain of a species.
FIG. 1.
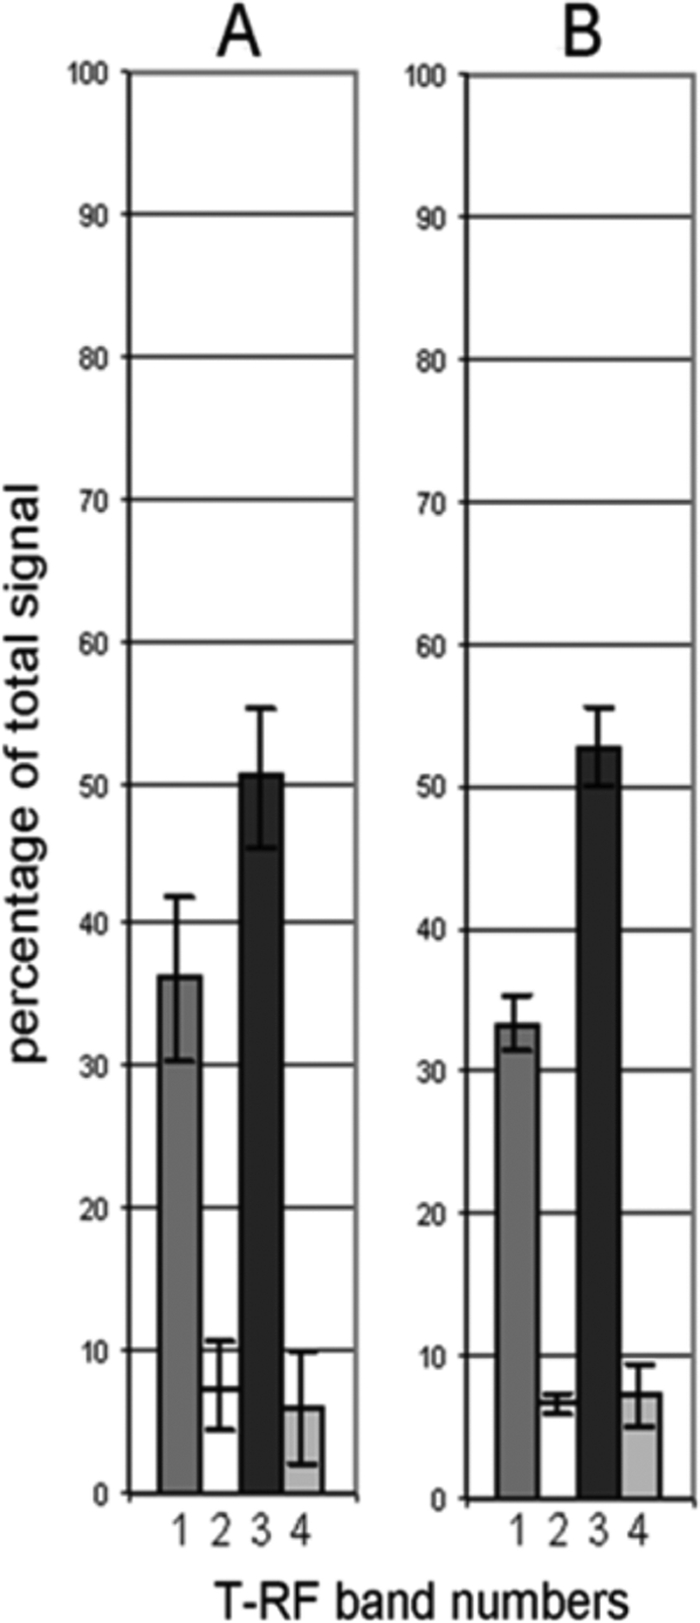
Variation in signal intensity, expressed as a percentage of total signal intensity, of the four T-RF bands resolved in a sputum sample. Variation is shown in profiles generated from five aliquots of a single sputum sample (A) or from five PCRs using a single DNA extract as a template (B).
Samples were examined in terms of the number of separate T-RF bands detected (bacterial taxon richness). Richness measures ranged from 1 species (patient G, time point 20, sample day 1) to 10 species (patient E, time point 0, sample day 3), with a mean value of 5.07 (standard deviation, ±1.9; n = 150).
Figure 2 shows plots generated from the temporal variation in taxon richness for each patient at each time point in comparison to the overall mean richness. Figure 2 also shows the cumulative taxon richness (taxon-time relationship [TTR]) for each patient at each time point. These data were generated by averaging data obtained from each patient over the three sampling days. Mean bacterial taxon richness over the 20-min sampling period for each sampling day was as follows: day 1, 5.12 ± 0.89; day 3, 5.12 ± 1.22; day 7, 5.06 ± 1.32 (n = 10), with the taxon richness values not significantly different across the three sampling days (ANOVA, F(2,27) = 0.02; P = 0.984). The overall mean richness for the combined data was 5.10 ± 0.270 (n = 30). No clear trend was found in terms of temporal variation in taxon richness compared to the overall mean richness of samples. In each case, all TTR curves reached, or were about to reach, an asymptote at the 20-min induction time point, suggesting further bacterial species were unlikely to be detected though collection of further samples.
FIG. 2.

Dynamics of bacterial taxon richness within individual patients averaged across the three sampling days. T = 0 represents a spontaneously expectorated sputum sample, and samples T = 5, T = 10, T = 15, and T = 20 represent timed induced sputum samples. Temporal variation in taxon richness (solid circles) in comparison to the overall mean richness (dashed line) is shown for each patient (a to j). Also shown are the cumulative taxon richness curves (open circles) for each patient. Given are the taxon-time power law equation (S = cTw) and the coefficient of determination (r2). Power regression lines have been fitted to all cumulative plots. All regression coefficients were significant (P < 0.05). Error bars represent the standard deviations of the means (n = 3).
The changes in bacterial community composition at successive sampling points were then examined. These changes can be expressed as the similarity (Sørenson index) of each sample to the original SES sample (here termed the t = 0 min sample) or between successive induced samples. Figure 3 shows the changes in bacterial community composition observed for individual patients, averaged across the three sampling days. The mean total rate of change in composition across the 20-min sampling period was 31% ± 10% on day 1, 31% ± 9% on day 3, and 34% ± 11% on day 7 (n = 10). Sequential change (comparing a sample to the previous sample) across all patients was 25% ± 8% on day 1, 34% ± 10% on day 3, and 29% ± 9% on day 7 (n = 10). ANOVA for total change over three sampling days was as follows: F(2,27) = 0.34; P = 0.712; and F(2,27) = 2.02; P = 0.152 for sequential change. Mean total change ranged from 13% ± 14% (patient D, day 3) to 57% ± 8% (patient I, day 7), whereas mean sequential change ranged from 11% ± 12% (patient G, day 1) to 47% ± 19% (patient G, day 3).
FIG. 3.

Changes in bacterial community composition within individual patients (a to j) averaged across the three sampling days. T = 0 represents a spontaneously expectorated sputum sample, and samples T = 5, T = 10, T = 15, and T = 20 represent timed induced sputum samples. Total change (closed circles) represents the similarity (Sørenson index) of each sample to the spontaneously expectorated sputum sample (T = 0). Sequential change (open circles) represents the similarity (Sørenson index) of each sample to the preceding sample. Error bars represent the standard deviations of the means (n = 3).
Cumulative richness levels for each patient are shown in Fig. 2. Cumulative taxon richness, w, can be expressed as the rate at which a new species is detected after each 5-min induction period. The values of w obtained ranged from 0.053 (patient G) to 0.318 (patient H). The mean temporal scaling exponent values (the rate of observation of new bacterial taxa over the course of the sampling regime) for each sampling day over the 20-min sampling period were as follows: day 1, w = 0.171 ± 0.131; day 3, w = 0.168 ± 0.113; day 7, w = 0.187 ± 0.144 (n = 10 patients). In addition, the cumulative taxon richness exponents were not significantly different across the three sampling days (ANOVA, F(2,27) = 0.21; P = 0.809). This demonstrates that the rate that new taxa were observed was constant and as such was not affected by the day of sampling. The overall mean temporal scaling exponent was 0.175 ± 0.114 (n = 30 patients).
The proportion of the total bacterial taxonomic richness (the cumulative taxon richness of samples collected at 0-, 5-, 10-, 15-, and 20-min induction periods) that was achieved with the analysis of increasing numbers of induced sputum samples is shown in Fig. 4 for all sample sets analyzed. If only a spontaneous sputum sample was analyzed, the proportion of total taxon richness detected was calculated to be 58.7% (±19.8). Five-, 10-, and 15-min sputum induction periods achieved 77.2% (±18.7), 88.4% (±11.0), and 96.3% (±5.9) of the cumulative taxon richness, respectively, after 20 min.
FIG. 4.

Bacterial taxon richness (left column) and cumulative taxon richness expressed as percentages (right column) for all patients (n = 10) for all patients and days combined (n = 30). T = 0 represents a spontaneously expectorated sputum sample, and samples T = 5, T = 10, T = 15, and T = 20 represent timed induced sputum samples. Shown are the temporal variation in richness (open circles) and the cumulative taxon richness (solid circles). Also given are the taxon-time (S = cTw) and similarity-time (SSOR = cTb) power law equations and the coefficient of determination (r2). Power regression lines have been fitted to all cumulative plots. All regression coefficients were significant (P < 0.05). Error bars represent the standard deviations of the means (n = 30).
A total of 81 different T-RF band lengths were resolved in the profiles generated for samples from the 10 patients analyzed. These were further clustered into 47 separate T-RF groups, corresponding to a phylogenetically diverse range of bacterial species. The membership of these T-RF groups is shown in Table 2. T-RF bands consistent with P. aeruginosa, Burkholderia cepacia complex, and Staphylococcus aureus were detected for 10 patients, two patients, and one patient, respectively. These data matched those generated through routine diagnostic microbiology (Table 1), except in the case of one patient, where P. aeruginosa was detected through T-RFLP but not reported by culture-based microbiology. In addition, T-RF bands consistent with Stenotrophomonas maltophilia, Alcaligenes xylosoxidans, and Haemophilus influenzae were detected in the profiles from one, seven, and two patients, respectively. T-RF bands consistent with a range of species not normally associated with respiratory infections in CF but reported previously through culture-independent analyses were also detected. Particularly prevalent were T-RF bands consistent with Prevotella spp. (10 patients), Mycobacterium spp. (9 patients), Clostridium spp. (6 patients), Veillonella spp. (3 patients), and Streptococcus spp. (3 patients).
TABLE 2.
Bacterial taxon membership of T-RF band length groups used for analysis of time-dependent species emergence
| T-RF band length group | Bacterial taxon membershipa |
|---|---|
| 1 | Prevotella sp. |
| 2 | Veillonella sp. |
| 3 | Clostridium sp. |
| 4 | Aquabacterium sp. |
| 5 | P. aeruginosa |
| 6 | Streptococcus sp., Pasteurellaceae sp. |
| 7 | Mycobacterium sp., Actinomyces sp. |
| 8 | Mycoplasma sp., Bifidobacterium sp., Streptomyces sp. |
| 9 | Clostridium sp., Peptococcus sp., Streptococcus sp. |
| 10 | B. cenocepacia, Acinetobacter sp., Burkholderia sp., Comamonas sp., Delftia sp., Hemobartonella sp., Mycoplasma sp., Nitrosomonas sp., Pseudomonas sp., Stenotrophomonas sp., Thiobacillus sp., Variovorax sp., Wautersia sp. |
| 11 | Acinetobacter sp., Alteromonas sp., Burkholderia sp., Comamonas sp., Nitrosomonas sp., Pandoraea sp., Pseudomonas sp., Ralstonia sp., Salinimonas sp., Simonsiella sp. |
| 12 | Actinomyces sp., Burkholderia sp., Chromohalobacter sp., Halomonas sp., Kingella sp., Nitrosomonas sp., Pseudomonas sp., Psychrobacter sp., Ralstonia sp., Simonsiella sp., Stenotrophomonas sp. |
| 13 | Actinomyces sp., Bifidobacterium sp., Halomonas sp., Pseudoalteromonas sp., Pseudomonas sp., Shewanella sp., Spirochaeta sp., Stenotrophomonas sp., Thauera sp. |
| 14 | Actinomyces sp., Cardiobacterium sp., Clostridium sp., Legionella sp., Neisseria sp., Paracoccus sp., Proteus sp., Shewanella sp., Simonsiella sp., Stenotrophomonas sp., Xanthomonas sp. |
| 15 | Stenotrophomonassp., Fusobacterium sp., Eikenella sp., Enterococcus sp. |
| 16 | Enterococcus sp., Clostridium sp. |
| 17 | Mycoplasma sp., Clostridium sp. |
| 18 | S. aureus, Clostridium sp., Bacillus sp. |
| 19 | Bacillus sp. |
| 20 | Acidobacteria sp. |
| 21 | Uncharacterized |
| 22 | Uncharacterized |
| 23 | H. influenzae, Mycobacterium sp., Haemophilus sp. |
| 24 | Actinobacteria sp., Aeromonadaceae sp., Agromyces sp., Alteromonas sp., Amycolatopsis sp., Bifidobacterium sp., Burkholderia sp., Cellulomonas sp., Corynebacterium sp., Curtobacterium sp., Enterobacter sp., Gordona sp., Haemophilus sp., Histophilus sp. |
| 25 | Uncharacterized |
| 26 | Uncharacterized |
| 27 | Nitrobacter sp. |
| 28 | Nocardia sp., Mycobacterium sp. |
| 29 | Haemophilus sp., Aeromonas sp. |
| 30 | Alcaligenes sp., Streptomyces sp. |
| 31 | Alcaligenes xylosoxidans, Acidovorax sp., Alcalivorax sp., Bordetella sp., Bacillus sp., Brackiella sp., Burkholderia sp., Cardiobacterium sp., Cardococcus sp., Catonella sp., Collimonas sp., Comamonas sp., Erwinia sp., Gallionella sp., Halomonas sp. |
| 32 | Aeromonas sp., Bordetella sp., Eikenella sp., Kingella sp., Moritella sp., Neisseria sp., Oligella sp., Pseudomonas sp., Ralstonia sp., Shewanella sp., Simonsiella sp., Streptococcus sp. |
| 33 | Capnocytophaga sp., Dialister sp., Enterococcus sp., Peptococcus sp., Streptococcus sp., Veillonella sp. |
| 34 | Dialister sp., Enterococcus sp., Peptococcus sp., Selenomonas sp. |
| 35 | Capnocytophaga sp., Veillonella sp. |
| 36 | Brevibacterium sp., Lactobacillus sp. |
| 37 | Weissella sp., Lactobacillus sp. |
| 38 | Prevotella sp. |
| 39 | Uncharacterized |
| 40 | Uncharacterized |
| 41 | Alcaligenes sp. |
| 42 | Uncharacterized |
| 43 | Uncharacterized |
| 44 | Uncharacterized |
| 45 | Uncharacterized |
| 46 | Uncharacterized |
| 47 | Uncharacterized |
Boldface indicates recognized pathogens in CF lung infections.
The variability of detection of recognized CF respiratory pathogens in the T-RFLP profiles reflected that of bacterial taxa generally. Where detected in a particular patient, P. aeruginosa, B. cepacia, S. aureus, and A. xylosoxidans were resolved in all SES samples and to various degrees in the IS sample series—where detected in the SES sample, P. aeruginosa, B. cepacia, S. aureus, and A. xylosoxidans were not detected in 10.2%, 75.0%, 25.0%, and 2.4% of the subsequent IS samples, respectively. S. maltophilia and H. influenzae were resolved in some but not all of both SES and IS samples in patients where detected (S. maltophilia was detected in 66% of SES and 75% of IS samples in a single patient; H. influenzae was detected in 50% of SES and 69% of IS samples of two patients).
Table 3 shows the emergence of T-RF band length groups after different periods of sputum induction, as determined for the sample set as a whole. The point in the induction process at which particular taxa were first detected appeared to be related to the frequency of their detection in the sample set. For example, T-RF band length groups 5 and 31 were detected more often than any others (30 and 25 out of 30 sample sets, respectively) and were detected in the first sample of the series in all cases. In contrast, of the eight taxa first detected after 20 min of induction, six were detected in only one induction series and two were detected in only two induction series.
TABLE 3.
Emergence of bacterial T-RF band length groupsa
| T-RF band length group | No. of occurrences for period of sputum induction (min) |
No. of samples | Mean % (SD) of profile signal | ||||
|---|---|---|---|---|---|---|---|
| 0 | 5 | 10 | 15 | 20 | |||
| 1 | 17 | 3 | 4 | 3 | 27 | 5.5 (7.6) | |
| 2 | 1 | 1 | 28.4 | ||||
| 3 | 1 | 3 | 2.7 (0.3) | ||||
| 4 | 1 | 1 | 0.62 | ||||
| 5 | 30 | 138 | 49.0 (25.0) | ||||
| 6 | 1 | 1 | 3.29 | ||||
| 7 | 1 | 1 | 1 | 7 | 10.9 (18.1) | ||
| 8 | 1 | 1 | 3 | 2.5 (0.2) | |||
| 9 | 3 | 1 | 1 | 11 | 2.2 (1.7) | ||
| 10 | 3 | 11 | 34.5 (17.8) | ||||
| 11 | 3 | 1 | 1 | 1 | 16 | 3.1 (3.1) | |
| 12 | 4 | 11 | 5.1 (7.91) | ||||
| 13 | 2 | 1 | 3 | 1.3 (0.9) | |||
| 14 | 2 | 1 | 14 | 40.7 (24.8) | |||
| 15 | 1 | 2 | 10 | 3.2 (3.0) | |||
| 16 | 1 | 1 | 0.8 | ||||
| 17 | 2 | 1 | 7 | 3.4 (3.3) | |||
| 18 | 4 | 1 | 3 | 1 | 19 | 2.1 (1.2) | |
| 19 | 1 | 1 | 1 | 1 | 10 | 1.0 (0.4) | |
| 20 | 1 | 1.9 | |||||
| 21 | 1 | 2 | 5 | 2.0 (2.7) | |||
| 22 | 2 | 2 | 12 | 4.6 (3.0) | |||
| 23 | 4 | 3 | 2 | 1 | 28 | 4.5 (3.2) | |
| 24 | 5 | 2 | 1 | 1 | 25 | 6.2 (5.4) | |
| 25 | 2 | 2 | 0.9 (0.2) | ||||
| 26 | 3 | 4 | 1 | 12 | 2.6 (1.5) | ||
| 27 | 2 | 3 | 14 | 3.5 (3.5) | |||
| 28 | 6 | 1 | 1 | 2 | 1 | 21 | 1.5 (1.1) |
| 29 | 1 | 4 | 1.8 (1.9) | ||||
| 30 | 1 | 1 | 26.6 | ||||
| 31 | 25 | 130 | 34.8 (15.6) | ||||
| 32 | 2 | 1 | 14 | 26.0 (6.3) | |||
| 33 | 1 | 1 | 4 | 15.9 (12.7) | |||
| 34 | 5 | 13 | 20.8 (11.4) | ||||
| 35 | 1 | 3 | 5.2 (2.7) | ||||
| 36 | 1 | 2 | 4.5 (1.0) | ||||
| 37 | 1 | 1 | 2 | 6.1 (1.0) | |||
| 38 | 2 | 3 | 2 | 1 | 1 | 17 | 5.9 (5.2) |
| 39 | 3 | 11 | 6.1 (3.2) | ||||
| 40 | 1 | 1 | 1 | 4 | 2.3 (1.0) | ||
| 41 | 1 | 1 | 2 | 3.3 (1.8) | |||
| 42 | 2 | 1 | 2 | 1 | 2 | 16 | 2.9 (3.0) |
| 43 | 2 | 1 | 10 | 4.2 (2.8) | |||
| 44 | 2 | 2 | 0.7 (0.4) | ||||
| 45 | 3 | 1 | 13 | 8.2 (6.6) | |||
| 46 | 5 | 1 | 1 | 29 | 6.0 (5.6) | ||
| 47 | 1 | 1 | 1 | 7 | 8.6 (9.2) | ||
Values represent the number of instances in which each T-RF band length group was first detected after a given period of induction in each of the 30 sets of samples analyzed (10 patients, sampled on three separate days). The mean percentage of the total profile signal represented by each T-RF band length group and the standard deviation are shown.
DISCUSSION
The aim of diagnostic microbiology is to provide data with which clinicians can make rational and effective therapeutic decisions. However, certain scenarios can make the reporting on what species are present in a sample more complicated, for example, where the material to be sampled is not homogeneous. This is compounded when the sample contains a diverse array of microbes. Both of these issues are likely to be relevant to the assessment of respiratory infections in the typical adult CF patient and particularly important given the key role of diagnostic microbiology in the selection of appropriate therapy (3).
The overall aim of this study was to explore these issues as applied to respiratory samples from CF patients. To achieve this, a culture-independent strategy was used to characterize the bacteria present in both spontaneously produced expectorated CF samples and those generated by successive sputum induction. The specific aims of this study were to address the following questions. Did the bacteria detected in SES samples differ from those in IS samples? Was there any trend in the species detected in sequential IS samples? Were species distributions more reproduced in SES samples or after a particular period of induction?
Before addressing these questions, it is important to examine the culture-independent analysis systems and what has been learned through their application. First, through applying culture-independent techniques, the CF airways have been shown to be colonized by far more species than previously thought (10, 27-32, 38, 39). These techniques, as shown again here, are highly reproducible. However, they also offered an advantage for this study over earlier culture-based studies in this area in that it was possible to resolve species whose role in CF respiratory infections is as yet unknown. Moreover, there is good evidence that the detection of such a wide range of species is representative of long-term lower airway colonization rather than contamination from the upper airways or oral cavity (31, 41; also data not shown).
Overall, the data presented here do not indicate a significant difference in the bacterial composition of SES and IS samples, regardless of the period for which induction was performed. However, they do show that in order to obtain a comprehensive view of the bacteria present in the CF lower airways, the analysis of multiple samples is required. It is only through the analysis of a number of such samples, in this case five, that the number of new species resolved with each successive sample fell away. This is reflected in the finding that analysis of a single SES sample typically represents only ca. 60% of the bacterial species found through the analysis of all five samples collected in series. This reinforces the need to select with care the samples to be studied and suggests that sampling in greater depth may be a more effective strategy. In other diagnostic contexts, there is evidence that repetition of analysis increases the accuracy of pathogen detection (19, 36). The ability to improve species resolution by the analysis of multiple respiratory samples was further supported by the data presented here.
A number of previous studies have attempted to determine the relative merits of SI and SES samples for the analysis of CF airway infections. Henig et al. (16) reported detection rates as determined through culture-based analysis of P. aeruginosa, B. cepacia complex, S. maltophilia, A. xylosoxidans, H. influenzae, and S. aureus of 79% for SI compared with 76% for SES, suggesting that any difference was not significant (16). Using comparable methods, Sagel et al. reported that the same pathogens were isolated in similar colony counts from both the induced and expectorated sputum samples from productive CF patients (35). However, there is evidence that colonizing bacteria are not distributed evenly throughout the CF lower airways (7, 23), and therefore, an ability to determine the presence at different points through a simple, noninvasive sampling method would be of great benefit. The findings of Gershman et al. and Aitken et al. lent support to the suggestion that sputum induction could be used to differentially sample regions of the airways by being performed for different periods time (1, 13). However, while the data presented here are consistent with the findings of Henig et al. (16) and Sagel et al. (35), a relationship between the induction period and the sample composition of the type reported by Gershman et al. and to a degree Aitken et al. (1) was not identified. It is likely that this arises from a number of key differences between the studies, most importantly the fact that the Gershman study was performed with nonproductive patients. In such circumstances, it is not unreasonable to suggest, as they did, that the airway secretions that result from induction will be expectorated according to their distance from the upper airways, with materials from deeper in the airways being expectorated last. However, in our study, patients were already productive. As such, material that was expectorated first in the induction series may have originated from the lower airways and have already traveled some distance up the airways before sample collection began. In this way, the link between heterogeneous distribution of airway bacteria and induction time may have been disrupted.
T-RFLP data generated from individual patients over the three sampling days were examined to determine whether a particular sample type or sputum induction time provided more-consistent samples. The three sampling days fell over a seven-day period during which the patient was stable. This variation was not significantly higher for any particular time point or sample type, however. The degree to which such variation reflects underlying changes in airway disease is undetermined. However, these data underline the importance of a sampling strategy that involves the collection of multiple samples at given time points. The sampling days (days 1, 3, and 7) were chosen to provide sufficient time for any effects of the sputum induction process to pass yet working on the assumption that there would be no marked changes in underlying respiratory microbiology. The data suggested that despite the high levels of reproducibility demonstrated for the techniques employed, the profiles generated from samples taken after particular induction periods varied to an extent across sampling days. However, this variation was not significantly higher for any particular time point or sample type. The degree to which such variation reflects underlying changes in airway disease is yet to be determined.
It is also important to explore the potential reasons why the variability in bacterial species detected was observed. The physical conditions that bacterial cells encounter will vary along the course of the respiratory tract. Arguably, the most significant of these varying parameters is oxygen tension. Chronic bacterial infection in the lower airways is known to reduce oxygen tension (2), and P. aeruginosa is known to grow anaerobically in the CF lung (45). In addition, a number of anaerobic species have been reported in CF lung infections (41, 44). It may be the case, therefore, that different bacterial species are distributed unevenly through the respiratory tract according to their ability to adapt to and grow under these conditions. However, the data presented here regarding the first detection of bacterial species suggest that the relationship between the period of sputum induction and the detection of particular groups of bacteria may not be related to the growth traits of particular species alone. Instead, other factors, most notably the prevalence of a species within the airways, significantly influence when a species is first detected.
As discussed above, and as might be anticipated, where species have a high mean percentage of total profile signal, they tend to be detected in the initial SES sample. However, exceptions to this were found. For example, T-RF band 2, consistent with Veillonella spp., was resolved as ca. 25% of the final (t20) profile (patient 9) yet was not present in any other sample from this patient. This does not mean that all anaerobes are heterogeneously distributed in the airways, however. For example, in over 60% of instances where Prevotella species were detected, they were detected in the original SES sample. Although the degree to which secretions from different regions of the airways contribute to SES samples is not known, some studies have considered the origin of SES samples. Mussaffi et al., for example, believed that SES samples were pooled secretions derived from the lower airways (24). Further, attempts to determine whether the induction period influences the area of the airways sampled is hampered by a lack of data regarding the spatial distribution of species within the lungs, suggesting further investigation into the differential location of particular species would be of great benefit. Aitken et al. attempted to determine whether there were differences in the bacterial load of particular species in samples obtained after various periods of induction (1). For example, they reported that P. aeruginosa and S. aureus decreased over the 20-min time period. However, the lack of an indication that sequential samples represent different regions of the airways meant that such investigation was unlikely to provide further insight into the questions of bacterial distribution addressed in this study.
SI samples are both safe and noninvasive (5, 21) and as such have a proven potential for analysis of nonproductive airway conditions, such as asthma, COPD, and nonproductive, pediatric CF remains (37). However, the data presented in this study suggest that single SI samples do not provide a clear advantage over SES samples in the study of productive respiratory infections, such as those associated with CF.
Culture-independent analysis has been demonstrated to be valuable in the detection of bacterial pathogens in culture-negative samples (40). Further, its ability to provide a nonselective characterization of bacterial species in clinical samples means that its use in diagnostics will expand. However, the quality of the data generated using such strategies relies on a number of considerations regarding the samples analyzed. Previous studies have sought to determine the reproducibility of certain sample types for culture-based diagnostic microbiology (12). However, these may need to be reassessed in the context of molecular analysis.
The data presented in this study underline the importance of basing analysis of bacterial presence in the lower airways on more than one sample. Data presented indicate that the reliance on a single SES or IS sample will resolve only a portion of the bacteria present. This has important implications, both for the detection of species recognized to be clinically important CF pathogens and in the identification of species whose role in CF lung infections is not yet known. The analysis of more than one sample may seem particularly challenging currently in a diagnostic context. However, if we are to address the issues raised here appropriately, this may be necessary, assisted by applying increasingly automated processes. It is clear, however, that as analytical techniques become more sophisticated, the quality of the data that they provide is not undermined (9, 11, 20). This applies to CF respiratory samples and may be relevant for a wider range of infections where sample type and frequency could have a diagnostic bearing.
Footnotes
Published ahead of print on 11 November 2009.
REFERENCES
- 1.Aitken, M. L., K. E. Greene, M. R. Tonelli, J. L. Burns, J. C. Emerson, C. H. Goss, and R. L. Gibson. 2003. Analysis of sequential aliquots of hypertonic saline solution-induced sputum from clinically stable patients with cystic fibrosis. Chest 123:792-799. [DOI] [PubMed] [Google Scholar]
- 2.Alvarez-Ortega, C., and C. S. Harwood. 2007. Responses of Pseudomonas aeruginosa to low oxygen indicate that growth in the cystic fibrosis lung is by aerobic respiration. Mol. Microbiol. 65:153-165. [DOI] [PMC free article] [PubMed] [Google Scholar]
- 3.Balfour-Lynn, I. A., and J. S. Elborn. 2007. Diagnostic aspects of cystic fibrosis, p. 137-158. In M. Hodson, D. Geddes, and A. Bush (ed.), Respiratory disease: infection, 3rd ed. Hodder Arnold, London, United Kingdom.
- 4.Bhowmik, A., T. A. Seemungal, R. J. Sapsford, J. L. Devalia, and J. A. Wedzicha. 1998. Comparison of spontaneous and induced sputum for investigation of airway inflammation in chronic obstructive pulmonary disease. Thorax 53:953-956. [DOI] [PMC free article] [PubMed] [Google Scholar]
- 5.Brightling, C. E. 2006. Clinical applications of induced sputum. Chest 129:1344-1348. [DOI] [PubMed] [Google Scholar]
- 6.da Silva Filho, L. V., A. F. Tateno, K. M. Martins, A. C. Azzuz Chernishev, O. Garcia Dde, M. Haug, C. Meisner, J. C. Rodrigues, and G. Doring. 2007. The combination of PCR and serology increases the diagnosis of Pseudomonas aeruginosa colonization/infection in cystic fibrosis. Pediatr. Pulmonol. 42:938-944. [DOI] [PubMed] [Google Scholar]
- 7.Davis, S. D., L. A. Fordham, A. S. Brody, T. L. Noah, G. Z. Retsch-Bogart, B. F. Qaqish, B. C. Yankaskas, R. C. Johnson, and M. W. Leigh. 2007. Computed tomography reflects lower airway inflammation and tracks changes in early cystic fibrosis. Am. J. Respir. Crit. Care Med. 175:943-950. [DOI] [PubMed] [Google Scholar]
- 8.De Boeck, K., M. Alifier, and S. Vandeputte. 2000. Sputum induction in young cystic fibrosis patients. Eur. Respir. J. 16:91-94. [DOI] [PubMed] [Google Scholar]
- 9.Delgado-Rodriguez, M., and J. Llorca. 2004. Bias. J. Epidemiol. Community Health 58:635-641. [DOI] [PMC free article] [PubMed] [Google Scholar]
- 10.Ecker, D. J., R. Sampath, C. Massire, L. B. Blyn, T. A. Hall, M. W. Eshoo, and S. A. Hofstadler. 2008. Ibis T5000: a universal biosensor approach for microbiology. Nat. Rev. Microbiol. 6:553-558. [DOI] [PMC free article] [PubMed] [Google Scholar]
- 11.Ellenberg, J. H. 1994. Selection bias in observational and experimental studies. Stat. Med. 13:557-567. [DOI] [PubMed] [Google Scholar]
- 12.Gauvin, F., J. Lacroix, M. C. Guertin, F. Proulx, C. A. Farrell, A. Moghrabi, P. Lebel, and C. Dassa. 2002. Reproducibility of blind protected bronchoalveolar lavage in mechanically ventilated children. Am. J. Respir. Crit. Care Med. 165:1618-1623. [DOI] [PubMed] [Google Scholar]
- 13.Gershman, N. H., H. Liu, H. H. Wong, J. T. Liu, and J. V. Fahy. 1999. Fractional analysis of sequential induced sputum samples during sputum induction: evidence that different lung compartments are sampled at different time points. J. Allergy Clin. Immunol. 104:322-328. [DOI] [PubMed] [Google Scholar]
- 14.Harju, T. H., M. Leinonen, J. Nokso-Koivisto, T. Korhonen, R. Raty, Q. He, T. Hovi, J. Mertsola, A. Bloigu, P. Rytilä, and P. Saikku. 2006. Pathogenic bacteria and viruses in induced sputum or pharyngeal secretions of adults with stable asthma. Thorax 61:579-584. [DOI] [PMC free article] [PubMed] [Google Scholar]
- 15.Harris, J. K., M. A. De Groote, S. D. Sagel, E. T. Zemanick, R. Kapsner, C. Penvari, H. Kaess, R. R. Deterding, F. J. Accurso, and N. R. Pace. 2007. Molecular identification of bacteria in bronchoalveolar lavage fluid from children with cystic fibrosis. Proc. Natl. Acad. Sci. U. S. A. 104:20529-20533. [DOI] [PMC free article] [PubMed] [Google Scholar]
- 16.Henig, N. R., M. R. Tonelli, M. V. Pier, J. L. Burns, and M. L. Aitken. 2001. Sputum induction as a research tool for sampling the airways of subjects with cystic fibrosis. Thorax 56:306-311. [DOI] [PMC free article] [PubMed] [Google Scholar]
- 17.Jung, A., I. Kleinau, G. Schonian, A. Bauernfeind, C. Chen, M. Griese, G. Doring, U. Gobel, U. Wahn, and K. Paul. 2002. Sequential genotyping of Pseudomonas aeruginosa from upper and lower airways of cystic fibrosis patients. Eur. Respir. J. 20:1457-1463. [DOI] [PubMed] [Google Scholar]
- 18.Kastelik, J. A., I. Aziz, and A. H. Morice. 2001. Sputum induction in young cystic fibrosis patients. Eur. Respir. J. 17:832. [DOI] [PubMed] [Google Scholar]
- 19.Kellogg, J. A., J. W. Seiple, and J. S. Levisky. 1989. Efficacy of duplicate genital specimens and repeated testing for confirming positive results for chlamydiazyme detection of Chlamydia trachomatis antigen. J. Clin. Microbiol. 27:1218-1221. [DOI] [PMC free article] [PubMed] [Google Scholar]
- 20.Kleinbaum, D. G., H. Morgenstern, and L. L. Kupper. 1981. Selection bias in epidemiologic studies. Am. J. Epidemiol. 113:452-463. [DOI] [PubMed] [Google Scholar]
- 21.Lacy, P., J. L. Lee, and D. Vethanayagam. 2005. Sputum analysis in diagnosis and management of obstructive airway diseases. Ther. Clin. Risk Manag. 1:169-179. [PMC free article] [PubMed] [Google Scholar]
- 22.McGarvey, L. P., K. Dunbar, S. L. Martin, V. Brown, J. Macmahon, M. Ennis, and J. S. Elborn. 2002. Cytokine concentrations and neutrophil elastase activity in bronchoalveolar lavage and induced sputum from patients with cystic fibrosis, mild asthma and healthy volunteers. J. Cyst. Fibros. 1:269-275. [DOI] [PubMed] [Google Scholar]
- 23.Meyer, K. C., and A. Sharma. 1997. Regional variability of lung inflammation in cystic fibrosis. Am. J. Respir. Crit. Care Med. 156:1536-1540. [DOI] [PubMed] [Google Scholar]
- 24.Mussaffi, H., E. M. Fireman, M. Mei-Zahav, D. Prais, and H. Blau. 2008. Induced sputum in the very young: a new key to infection and inflammation. Chest 133:176-182. [DOI] [PubMed] [Google Scholar]
- 25.Ordonez, C. L., A. I. Kartashov, and M. E. Wohl. 2004. Variability of markers of inflammation and infection in induced sputum in children with cystic fibrosis. J. Pediatr. 145:689-692. [DOI] [PubMed] [Google Scholar]
- 26.Paggiaro, P. L., P. Chanez, O. Holz, P. W. Ind, R. Djukanovic, P. Maestrelli, and P. J. Sterk. 2002. Sputum induction. Eur. Respir. J. Suppl. 37:3s-8s. [DOI] [PubMed] [Google Scholar]
- 27.Rogers, G. B., F. A. Stressmann, G. Koller, T. V. W. Daniels, M. P. Carroll, and K. D. Bruce. 2008. Assessing the diagnostic importance of nonviable bacterial cells in respiratory infections. Diagn. Microbiol. Infect. Dis. 62:133-141. [DOI] [PubMed] [Google Scholar]
- 28.Rogers, G. B., C. A. Hart, J. R. Mason, M. Hughes, M. J. Walshaw, and K. D. Bruce. 2003. Bacterial diversity in cases of lung infection in cystic fibrosis patients: 16S ribosomal DNA (rDNA) length heterogeneity PCR and 16S rDNA terminal restriction fragment length polymorphism profiling. J. Clin. Microbiol. 41:3548-3558. [DOI] [PMC free article] [PubMed] [Google Scholar]
- 29.Rogers, G. B., M. P. Carroll, and K. D. Bruce. 2009. Studying bacterial infections through culture independent approaches. J. Med. Microbiol. 58:1401-1408. [Epub ahead of print.] [DOI] [PubMed] [Google Scholar]
- 30.Rogers, G. B., M. P. Carroll, D. J. Serisier, P. M. Hockey, G. Jones, and K. D. Bruce. 2004. Characterization of bacterial community diversity in cystic fibrosis lung infections by use of 16S ribosomal DNA terminal restriction fragment length polymorphism profiling. J. Clin. Microbiol. 42:5176-5183. [DOI] [PMC free article] [PubMed] [Google Scholar]
- 31.Rogers, G. B., M. P. Carroll, D. J. Serisier, P. M. Hockey, G. Jones, V. Kehagia, G. J. Connett, and K. D. Bruce. 2006. Use of 16S rRNA gene profiling by terminal restriction fragment length polymorphism analysis to compare bacterial communities in sputum and mouthwash samples from patients with cystic fibrosis. J. Clin. Microbiol. 44:2601-2604. [DOI] [PMC free article] [PubMed] [Google Scholar]
- 32.Rogers, G. B., M. P. Carroll, D. J. Serisier, P. M. Hockey, V. Kehagia, G. Jones, and K. D. Bruce. 2005. Bacterial activity in cystic fibrosis lung infections. Respir. Res. 6:49. [DOI] [PMC free article] [PubMed] [Google Scholar]
- 33.Rogers, G. B., T. V. W. Daniels, A. Tuck, M. P. Carroll, G. J. Connett, G. J. David, and K. D. Bruce. 2009. Studying bacteria in respiratory specimens by using conventional and molecular microbiological approaches. BMC Pulm. Med. 9:14. [DOI] [PMC free article] [PubMed] [Google Scholar]
- 34.Sagel, S. D., M. K. Sontag, J. S. Wagener, R. K. Kapsner, I. Osberg, and F. J. Accurso. 2002. Induced sputum inflammatory measures correlate with lung function in children with cystic fibrosis. J. Pediatr. 141:811-817. [DOI] [PubMed] [Google Scholar]
- 35.Sagel, S. D., R. Kapsner, I. Osberg, M. K. Sontag, and F. J. Accurso. 2001. Airway inflammation in children with cystic fibrosis and healthy children assessed by sputum induction. Am. J. Respir. Crit. Care Med. 164:1425-1431. [DOI] [PubMed] [Google Scholar]
- 36.Schachter, J., J. M. Chow, H. Howard, G. Bolan, and J. Moncada. 2006. Detection of Chlamydia trachomatis by nucleic acid amplification testing: our evaluation suggests that CDC-recommended approaches for confirmatory testing are ill-advised. J. Clin. Microbiol. 44:2512-2517. [DOI] [PMC free article] [PubMed] [Google Scholar]
- 37.Scheicher, M. E., J. Terra Filho, and E. O. Vianna. 2003. Sputum induction: review of literature and proposal for a protocol. Sao Paulo Med. J. 121:213-219. [DOI] [PMC free article] [PubMed] [Google Scholar]
- 38.Sibley, C. D., H. Rabin, and M. G. Surette. 2006. Cystic fibrosis: a polymicrobial infectious disease. Future Microbiol. 1:53-61. [DOI] [PubMed] [Google Scholar]
- 39.Sibley, C. D., M. D. Parkins, H. R. Rabin, K. Duan, J. C. Norgaard, and M. G. Surette. 2008. A polymicrobial perspective of pulmonary infections exposes an enigmatic pathogen in cystic fibrosis patients. Proc. Natl. Acad. Sci. U. S. A. 105:15070-15075. [DOI] [PMC free article] [PubMed] [Google Scholar]
- 40.Sontakke, S., M. B. Cadenas, R. G. Maggi, P. P. Diniz, and E. B. Breitschwerdt. 2009. Use of broad range 16S rDNA PCR in clinical microbiology. J. Microbiol. Methods 76:217-225. [DOI] [PubMed] [Google Scholar]
- 41.Tunney, M. M., T. R. Field, T. F. Moriarty, S. Patrick, G. Doering, M. S. Muhlebach, M. Wolfgang, R. Boucher, D. F. Gilpin, A. McDowell, and J. S. Elborn. 2008. Detection of anaerobic bacteria in high numbers in sputum from patients with cystic fibrosis. Am. J. Respir. Crit. Care Med. 177:995-1001. [DOI] [PubMed] [Google Scholar]
- 42.van der Gast, C. J. 2008. Islands shaping thought in microbial ecology. Adv. Appl. Microbiol. 64:167-182. [DOI] [PubMed] [Google Scholar]
- 43.van der Gast, C. J., D. Ager, and A. K. Lilley. 2008. Temporal scaling of bacterial taxa is influenced by both stochastic and deterministic ecological factors. Environ. Microbiol. 10:1411-1418. [DOI] [PubMed] [Google Scholar]
- 44.Worlitzsch, D., C. Rintelen, K. Bohm, B. Wollschlager, N. Merkel, M. Borneff-Lipp, and G. Doring. 2009. Antibiotic-resistant obligate anaerobes during exacerbations of cystic fibrosis patients. Clin. Microbiol. Infect. 15:454-460. [DOI] [PubMed] [Google Scholar]
- 45.Yoon, S. S., R. F. Hennigan, G. M. Hilliard, U. A. Ochsner, K. Parvatiyar, M. C. Kamani, H. L. Allen, T. R. DeKievit, P. R. Gardner, U. Schwab, J. J. Rowe, B. H. Iglewski, T. R. McDermott, R. P. Mason, D. J. Wozniak, R. E. Hancock, M. R. Parsek, T. L. Noah, R. C. Boucher, and D. J. Hassett. 2002. Pseudomonas aeruginosa anaerobic respiration in biofilms: relationships to cystic fibrosis pathogenesis. Dev. Cell 3:593-603. [DOI] [PubMed] [Google Scholar]