Abstract
Statistical inference from MEG-based distributed activation maps is well suited to the general linear modeling framework, a standard approach to the analysis of fMRI and PET neuroimaging studies. However, there are important differences from the other neuroimaging modalities related to how observations are created and fitted in GLM models, as well as how subsequent statistical inference is performed. In this paper, we demonstrate how MEG oscillatory components can be analyzed in this framework based on a custom ANCOVA modeling that takes into account baseline and inter-hemispheric effects, rather than a simpler ANOVA design. We present the methodology using as an example an MEG study of visual spatial attention, since the model design depends on the specific experiment and neuroscience hypotheses being tested. However, the techniques presented here can be readily adapted to accommodate other experimental paradigms. We create statistics that estimate the temporal evolution of attention effects on alpha power in several cortical regions. We present evidence for direction specific attention effects on alpha activity in occipital and parietal regions and demonstrate the sub-second timing of these effects in each region. The results support a mechanism for anticipatory attentional deployment that dynamically modulates the local alpha synchrony in a network of parietal control and occipital sensory regions.
Keywords: MEG, ANCOVA, Visual Attention, False Discovery Rate
1 Introduction
The General Linear Modeling (GLM) framework is a standard approach for fMRI (Friston et al., 1995) and PET (Worsley et al., 1992) neuroimaging studies, and together with subsequent statistical inference, is generally referred to as Statistical Parametric Mapping (SPM) (Kiebel, 2003). Similar analysis techniques can be used to analyze distributed cortical current source maps computed from MEG data, however there are important differences from the other neuroimaging modalities related to how observations are created and fitted to GLM models, as well as how subsequent statistical inference is performed.
The temporal resolution of MEG is on the order of milliseconds, much higher than fMRI and PET. Standard analysis of MEG data involves the use of stimulus locked averaging over epochs to produce the evoked response. Recently there has also been a great deal of interest in analysis of the induced response, which corresponds to stimulus-related variations in power in different oscillatory bands where the phase is not locked to the stimulus (David et al., 2006). Induced effects are typically investigated using a time-frequency decomposition such as the Morlet wavelet transform (Teolis, 1998). The fact that in MEG we often want to identify and localize experimental effects not only over space, as traditionally done in fMRI with the notion of voxels, but also in time and possibly frequency, introduces challenges that differentiate MEG analysis from that of PET and fMRI. The high dimensionality of the data (space ×time × frequency × experimental design) presents challenges, in terms of the high computational costs, but also possibilities, in terms of the greater flexibility that this affords us in the design of the linear models.
Another important difference relative to fMRI is that MEG offers only limited spatial resolution. Distributed cortical imaging involves the reconstruction of thousands of elemental current sources from a few hundred measurements. The problem is highly underdetermined and requires regularization to produce a stable solution (Hämäläinen et al., 1993; Baillet et al., 2001). The resulting images are typically of low resolution so that reconstructions of a focal source are blurred with significant point spread functions (PSF) (de Peralta-Menendez et al., 1997; Liu et al., 2002). The shape of the PSF will depend on the reconstruction space, cortical or volumetric, and whether the orientations of the sources are constrained to be normal to the cortical surface. Unlike in fMRI, the PSFs for MEG are highly asymmetric and can extend over multiple gyri or sulci. As a result, even after thresholding to control for false positives, one can still observe false positives at locations within the point spread of truly active regions, therefore, care must be taken in interpreting these results. An alternative approach, which may often be acceptable given the limited resolution of MEG, is to divide the cortex into regions of interest based on hypotheses of where experimental effects are expected.
In this paper, we demonstrate how MEG oscillatory components can be analyzed in a GLM framework, based on a custom ANCOVA modeling that takes into account baseline effects and inter-hemispheric effects, rather than a simple ANOVA design. We present the methodology using as an example an MEG study of visual spatial attention, since the model design greatly depends on the experiment at hand and the neuroscience hypotheses being tested. However, the techniques presented here can be readily adapted to accommodate other experimental paradigms. A preliminary version of this approach was presented in our conference article (Pantazis et al., 2007).
The cognitive neuroscience-based motivation for the study used to demonstrate this analysis method was to better understand the role of cortical alpha activity in anticipatory visual attention. Covert deployment of anticipatory attention to locations in space improves perception of target stimuli (Posner and Petersen, 1990), and neural mechanisms of visual spatial anticipatory attention have been studied with several methods. The present report focuses on posterior regions of parietal and occipital cortex because they have been shown to be involved in the voluntary deployment of visual spatial attention in fMRI studies (e.g. Kastner et al. (1999); Gitelman et al. (1999); Hopfinger et al. (2000); Corbetta and Shulman (2002); Giesbrecht et al. (2003)). Oscillatory EEG activity in the alpha band has been proposed to play a role in sustaining anticipatory attention (e.g. Worden et al. (2000); Marrufo et al. (2001); Sauseng et al. (2005); Kelly et al. (2006); Thut et al. (2006); Rihs et al. (2007); Palva and Palva (2007). Monkey recordings have revealed that oscillatory activity in the alpha range is lower when the receptive field of extrastriate neurons is attended versus unattended (Fries et al., 2001). It is not known whether a similar mechanism occurs in parietal neurons. While human EEG studies have shown that alpha power over left or right posterior scalp is lower when the visual hemifield contralateral to the scalp recording is attended versus unattended, it remains to be determined whether these attention-related alpha effects occur in occipital regions, parietal regions, or both. Our EEG study (Worden et al., 2000) found alpha effects having scalp topographic specificity at the visual quadrant level, and this has been supported by findings of octant-level specificity (Rihs et al., 2007). Activity arising from upper versus lower visual field representations in parietal cortices are unlikely to be differentiable at the scalp, suggesting that the alpha effects are generated at least in part by occipital regions. Whether or not there is direction-specific anticipatory attentional modulation of alpha in parietal regions remains uncertain. Many studies require anticipatory deployment of attention both to a spatial location and in anticipation of a pattern discrimination of target stimuli at that location (e.g. (Worden et al., 2000; Sauseng et al., 2005; Rihs et al., 2007). Under these task demands anticipatory attention could operate by modulating dorsal occipital regions alone or both dorsal and ventral regions. The present study uses anatomically defined ROIs to parse the parietal and occipital lobes into a set of six regions in each hemisphere in order to address these issues.
Our GLM model involves the analysis of dynamic maps of cortical activity over the alpha frequency range (8–14 Hz). To explore the temporal dynamics of the attention process and identify the top-down mechanisms that deploy attention, we fit separate linear models over distinct time regions. Rather than using voxel-based statistics, we limit our analysis to cortical regions of interest in occipital and parietal lobes. In addition to the general framework described below, the novelty of this work lies in the exploration of the dynamics of these attentional effects at the cortical rather than sensor level. By creating statistics that estimate the ipsilateral vs. contralateral alpha activity in cortical regions, we present evidence for direction specific attention effects on alpha activity in occipital and parietal regions and demonstrate the sub-second timing of these effects in each region. The results support a mechanism for anticipatory attentional deployment that dynamically modulates the local alpha synchrony in a network of parietal control and occipital sensory regions.
2 Experiment
2.1 Subjects
Eight right handed subjects (6 male, 2 female) participated in the experiment (mean age 27.4 years ± 4.6 years). Two additional subjects were excluded from analysis, due to excessive head movements. Informed consent was obtained from all subjects, and the experiment was approved by the Institutional Review Board at the University of California, San Francisco.
2.2 Visual spatial cueing experiment
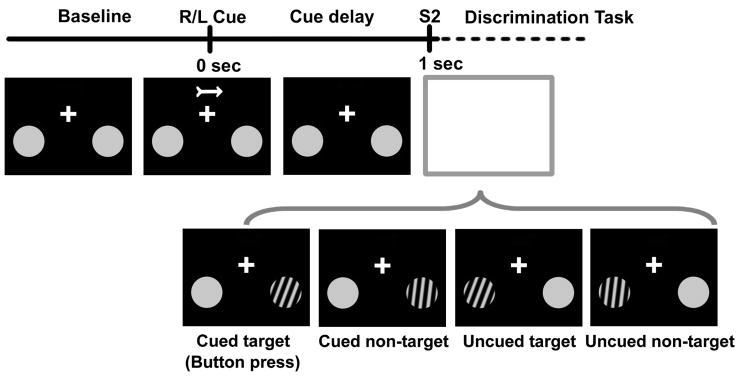
A liquid crystal projection system displayed stimuli to the subjects using a screen placed 36 cm from the nasion. Subjects were instructed to maintain fixation at all times on a cross located at the center of their visual field (Fig. 1). Following a variable inter-trial baseline period (2150–2950ms), a brief central arrow cue (50ms) instructed subjects to covertly deploy their attention to a location in the lower left or right visual quadrant. After a 1 sec delay, a discrimination task was performed by the subjects, to ensure they oriented and maintained attention as instructed. This task was cued by a second stimulus (S2) presented with equal probability to the right or left visual field (a small circular patch containing a sinewave grating). The subjects were instructed to press a button with their right index finger only if S2 occurred at the cued location and was a target (20 degrees clockwise grating pattern).
Fig. 1.
Visual spatial cueing experiment. A brief central arrow cue directs covert attention to the lower left or right visual field, in anticipation of a second stimulus (S2) delivered 1 sec later to the left or right with equal probability. S2 consists of gratings slanted clockwise from the vertical by either 5 (non-target) or 20 (target) degrees, with a response required if the S2 appeared at the cued location and had the target orientation.
2.3 MEG data collection and preprocessing
Continuous MEG signals were recorded using a 275-channel whole-cortex CTF Omega 2000 system. After acquisition, we applied 3rd order synthetic gradiometer correction to remove far-field noise. A total of 900 trials were collected from each subject in a series of 18 blocks of 50 trials, with acquisition time approximately 80 minutes. The head location within the MEG helmet was recorded during the short breaks between blocks, and subjects with excessive head movement (above 5 mm) were excluded from analysis. The MEG recordings were low-pass filtered at 0–300 Hz, and sampled at 1200 Hz. Eye activity was measured with vertical and horizontal electrooculographs. All trials were inspected for eye movements and other artifacts (MEG artifacts, muscle activity) and contaminated trials discarded, leaving around 700 trials per subject for analysis. Cardiac artifacts on the remaining trials were removed using an infomax independent component analysis algorithm (Hyvarinen et al., 2001), by identifying periodic independent components with a characteristic EKG waveform. As our analysis was focused on low frequencies (alpha band), we then further downsampled the timeseries to 120 Hz to reduce processing time.
3 Methods
Our goal is to develop a model through which we can explore the temporal evolution of human visual attention and identify the functional role various cortical sites play in directing and sustaining attention. Spatially localized ipsilateral vs. contralateral changes in alpha activity with respect to the attended visual field can elucidate the top-down control mechanisms of visual spatial attention. For this reason, we design statistics that estimate the statistical significance of the ipsilateral vs. contralateral alpha effect for several cortical and temporal regions.
We combine minimum-norm imaging (Hämäläinen et al., 1993; K-Yildirim et al., 2006) with wavelet analysis to compute dynamic images of oscillatory cortical activity. We then select a number of cortical regions in the parietal, occipital, and temporal lobes that are believed to play an important role in forming and maintaining attention (Kastner et al., 1999; Gitelman et al., 1999; Hopfinger et al., 2000; Corbetta and Shulman, 2002; Giesbrecht et al., 2003). To extract contrast statistics of attention related alpha activity, we follow a univariate approach and model each subject, region of interest (in bilateral pairs), and time-frequency band separately with a novel ANCOVA (analysis of covariance) design, where power in rectangular time-frequency bands forms the observation variables, and baseline power forms the covariate. We incorporate trial indicator variables in our model to account for the spatially-dependent data obtained from right and left hemispheres in each trial. The temporal evolution of the estimated ipsilateral vs. contralateral statistic reveals the top-down control mechanisms of visual attention. Statistical analysis using permutation tests and false discovery rate demonstrates the significance of our findings.
3.1 Model
We assume that MEG data are collected as a set of stimulus-related trials (one per cue stimulus), each consisting of a baseline period and a post-cue interval. Each trial consists of an array of data M (nchannels × ntimepoints) representing the measured magnetic field at each sensor as a function of time. The measurements M are linearly related with the brain activation X (nsources × ntimepoints) as:
| (1) |
where G (nchannels × nsources) is the forward operator and N represents additive noise in the channel measurements. The lead field matrix G depends on the shape and conductivity of the head (Darvas et al., 2004), and in this study we compute it based on an overlapping spheres model (Huang et al., 1999) using the BrainStorm electromagnetic software (Mosher et al., 2005).
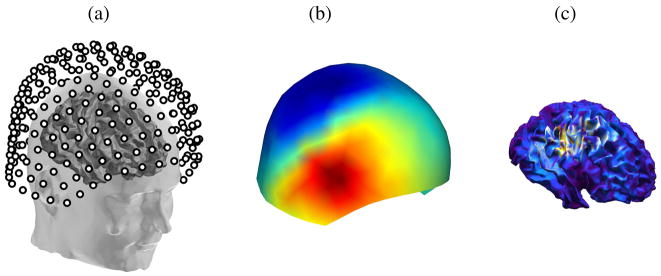
A cortical map is computed for each epoch by applying a Tikhonov regularized minimum norm inverse method (Tikhonov and Arsenin, 1977) to produce an estimate of the temporal activity at each surface element in the cortex (Fig. 2):
| (2) |
Fig. 2.
MEG model; (a) Sensor arrangement of a 275-channel CTF MEG system, (b) Topography of sensor measurements M, (c) Min-norm inverse solution X on a tessellated cortical surface
We write the reconstructed cortical maps as {Xst}, where s and t are indices in space and time respectively. We use the pre-stimulus data to estimate the baseline mean ms at each spatial element s, by averaging over time t. We then estimate the centered data as:
| (3) |
3.2 Wavelet Expansion
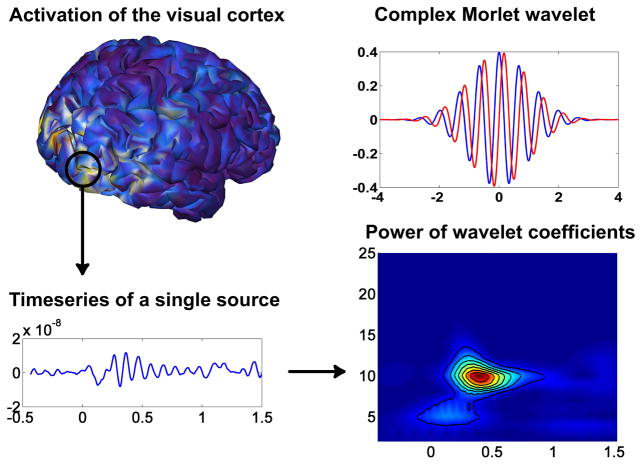
We use a continuous wavelet transform (Vetterli and Kovacevic, 1995) to decompose the source timeseries Yst into their wavelet coefficients. Unlike the Fourier transform, which decomposes a signal into infinite length sines and cosines and loses all temporal localization information, the continuous wavelet transform basis functions are scaled and shifted versions of the temporally-local mother wavelet. The complex Morlet wavelet (Teolis, 1998) is a continuous time wavelet often used in MEG studies (Tallon-Baudry and Bertrand, 1999; Tallon-Baudry et al., 1996; Pantazis et al., 2005b; Kiebel et al., 2005). It is a Gaussian-windowed complex sinusoid defined as:
| (4) |
where b is the bandwidth parameter and f is the central frequency. The complex Morlet wavelet has a Gaussian shape in the time domain with standard deviation and a Gaussian shape at the frequency domain around its central frequency f with standard deviation σf = 1/(2πσt) It is characterized by a constant product , which for this paper was set to 2.12. At f = 10Hz, the wavelet shown in Fig. 3 had temporal resolution 2σt = 300ms and frequency resolution 2σf = 2.12Hz.
Fig. 3.
Time-varying frequency components of a source on the visual cortex; we notice alpha activity around 300–600 ms after stimulus. The Morlet wavelet is a Gaussian-windowed complex sinusoid with the real part shown in blue, and the imaginary part in red.
For each source location s we obtain an estimate of the time-varying frequency components by expanding the time series using Morlet wavelets as:
| (5) |
where (★) denotes the convolution operator over the time index t, and Cstf are the complex wavelet coefficients (Fig. 3). Because the wavelet decomposition is linear and computed entirely in the time domain, while the inverse operator (2) is computed entirely in the spatial domain, the two operators commute. In practice, it is computationally more efficient to first compute the wavelet decomposition in the channel domain, and then to apply the inverse operator (2) to each of the wavelet coefficients.
3.3 Statistics
Our goal is to detect spatial-temporal-spectral components of cortical activity that relate to visual attention effects. A statistic that estimates neural activation energy at specific time-frequency instances, given by the squared wavelet coefficients, can capture such attention effects:
| (6) |
To improve the signal to noise ratio, and increase the statistical power by minimizing the total number of statistics we need to test for significance, we integrate the energy over time T = [t1, t2], frequency F = [f1, f2], and cortical area S:
| (7) |
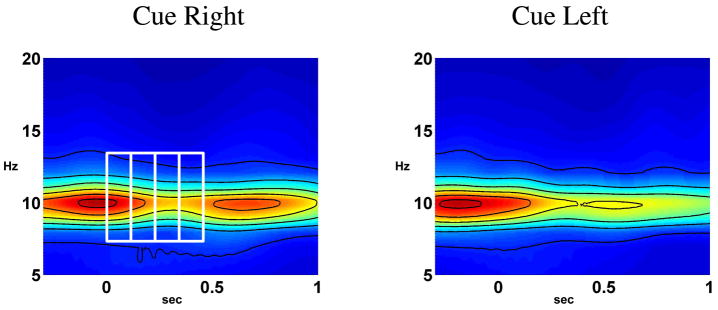
Figure 4 shows how we select rectangular time-frequency bands in the wavelet signal domain. We divide the 1 sec post-cue time period into several equal length intervals (only a few are shown), and select bands in the alpha range [8, 14Hz]. We estimate the ESTF statistics on the six cortical sites shown in Fig. 5. The present approach can use any type of pre-defined anatomical ROIs, including those defined on the basis of previous functional imaging studies, PET, fMRI or source imaged MEG, EEG studies. For the present attention study, we identified regions that have a functional role in voluntary deployment of visual spatial attention, as identified by neuroimaging studies (Kastner et al., 1999; Gitelman et al., 1999; Hopfinger et al., 2000; Corbetta and Shulman, 2002; Giesbrecht et al., 2003). The regions were derived by analysis of published fMRI studies that used cued spatial attention designs related to the present study. The composite talairach coordinates across studies were used to define large ROIs that inclusively represent active regions from these studies. The ROIs were then identified manually on the cortical surfaces of 8 subjects.
Fig. 4.
Selection of rectangular time-frequency bands in the wavelet signal domain (right figure). Also shown is the average frequency content of the cue-right and cue-left trials in the right intra-parietal sulcus (Fig. 5) of a subject. Alpha power is stronger on the cue-right trials (ipsilateral hemisphere) around 500–800 ms, indicating a topographical change of alpha activity in anticipation of a target stimulus at 1 sec in the cued direction.
Fig. 5.
Visual attention effects are explored in 6 cortical regions, selected symmetrically in each hemisphere; SPL: Superior Parietal Lobe, TPJ: Temporal Parietal Junction, IPS: Intra-Parietal Sulcus, OM: Occipital Middle, OL: Occipital Lateral, OV: Occipital Ventral.
3.4 ANCOVA Model
During the visual attention experiment, we acquire many energy observations ESTF in several spatial-temporal-spectral bands (STF). We introduce new indices to identify the observations: k ∈ {1 … K} denotes the subject, i ∈ {1, 2} denotes the main effect cue (1 for right, 2 for left), j ∈ {1, 2} denotes the main effect hemisphere (1 for right, 2 for left), and l denotes the individual measurements collected over each subject and main effect.
The new indices allow us to arrange the observations into general linear models. We follow a univariate approach and model each spatial-temporal-spectral band (and subject) separately with an ANCOVA model. Our approach resembles the statistical parametric mapping methodology in fMRI data analysis, where a general linear model is fit in each voxel location (Friston, 1996), with the exception that bilaterally pairs of spatial data are modeled instead of individual spatial elements. Also, MEG has lower spatial resolution and higher temporal resolution, so instead of voxels we use cortical regions and instead of a hemodynamic response function we expand the neural activity in time-frequency bands. We also use a baseline covariate, because it is reasonable to expect that pre-cue brain state will affect our post-cue observations; high overall alpha activity before the stimulus may predict high alpha activity after the stimulus and vice versa. Finally, since observations from the right and left hemisphere of the same trial are correlated, we incorporate trial indicator variables in our model to compensate for correlated observations. Note that if there were j > 2 correlated measurements modeled, this indicator variable only accounts for a compound symmetric correlation structure (all correlations equal) among sets of j observations. If a more general correlation structure is desired, a repeated measures or mixed effects modelling approach would be required (see, e.g. (Verbeke and Molenberghs, 2000)).
The ANCOVA model we use is:
| (8) |
where are the main effects for cue and hemisphere conditions, are the baseline covariates (observations of neural energy in the baseline) multiplied by the hemisphere-specific parameter accounts for the correlation between the two hemispheres, and is the model error term. The superscripts STF, k indicate that we fit the same ANCOVA model for all spatial-temporal-spectral bands and subjects.
Equivalently, in matrix form:
| (9) |
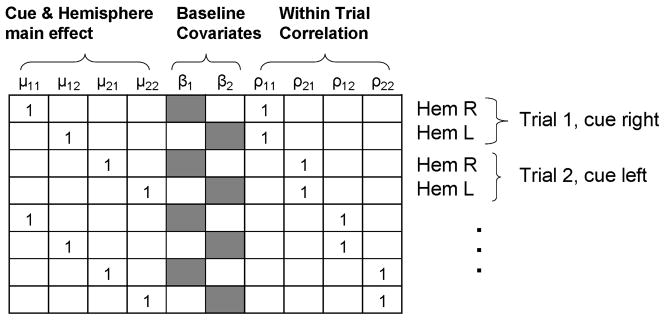
where ESTF,k is the vector of all observations, and bSTF,k is the vector of unknown parameters. Each observation corresponds to a row in the design matrix X, as shown in Fig. 6. We find the least squares solution of bSTF,k, and then compute a contrast that captures the ipsilateral vs. contralateral effect for each subject:
| (10) |
where the first two terms represent the ipsilateral effect (same i and j) and the last two terms represent the contralateral effect.
Fig. 6.
First few rows of the ANCOVA design matrix X. Each MEG trial produces two observations (post-cue energy in the right and left hemisphere) that account for two rows in the design matrix. We place 1s in the appropriate cue and hemisphere indicator variable, and the within trial correlation term. The baseline energy is placed in the fifth or sixth column depending on whether it comes from the right or left hemisphere.
At this point we could divide the contrast values by their standard errors, creating time-frequency t-images for each contrast, for each subject. However, our interest is in inference on population mean effects, so we simply average over all subjects k,
| (11) |
We hypothesize that large values of the statistic SSTF in the alpha band indicate increased attention since in that case the ipsilateral vs. contralateral attention modulation of alpha activity is more pronounced.
3.5 Statistical Significance
The spatial and temporal evolution of SSTF can reveal the dynamics of visual attention. However, we need to establish if the observed effects are statistically significant. We could use either standard parametric inference as part of the GLM, but this is based on normality assumptions, which are impossible to verify on the small group data that are typical. Instead, we use a permutation scheme (Nichols and Holmes, 2001; Pantazis et al., 2005a, 2003), which only assumes that the contrast data SSTF,k are symmetrically distributed and, in the absense of an effect, mean zero.
Formally, under the null hypothesis of no cue or hemisphere main effect, we can randomly mix the labels of our observations and exchange the ipsilateral and contralateral conditions. Computationally, this is equivalent to randomly multiplying each subject’s response with 1 or −1 (Eq. 12); we avoid a complete randomization scheme that would require mixing the first 4 columns of the design matrix, because recomputing the least squares solution for each permutation sample is too computationally demanding.
| (12) |
Since we have experimental data for 8 subjects, we can generate 28 permutation samples SSTF*, and use them to evaluate the p-value PSSTF of our original statistic SSTF. The symbol (*) denotes the statistic is generated by permutation.
By repeating this procedure for each spatial-temporal-spectral band STF, we evaluate a group of p-values of our original statistics. To find which of these p-values are significant after multiple comparison corrections, we use a false discovery rate (FDR) procedure. FDR controls the expected proportion of errors among the rejected hypothesis (Benjamini and Hochberg, 1995; Genovese et al., 2002). For example, FDR at a level α= 0.05 means that if we reject 100 null hypotheses, on average 5 of these will be false positives. We consider this measure suitable, because when many of our hypotheses are rejected, the error from a single erroneous rejection is not crucial for drawing conclusions about the ipsilateral vs. contralateral effect. Before applying FDR, we confirmed that its assumptions hold (Benjamini and Yekutieli, 2001), namely we have non-negative correlation between the SSTF statistics in the various spatial-temporal-spectral bands.
4 Results
On average, subjects correctly detected about 80% of all cued targets (81.5% ± 11.4%. Correct responses were defined by a reaction time within 100 – 900 ms after a cued target. The false negative rate, defined by a missing response after a cued target, was 17.3% ± 11.1%). The target detection rate was similar for cue left (79.8% ± 14.2%) and cue right (83.2% ± 10.4%; t[7] = −0.92, not significant. The mean target reaction time was 500 ms (500.2 ± 79.2 ms); it was about 20 ms faster for cue right (490.4 ± 80.7 ms) than cue left (510.7 ± 78.9 ms; t[7] = 3.48, p < 0.05). The response data indicated that subjects were attending to the task and performing with a high level of accuracy.
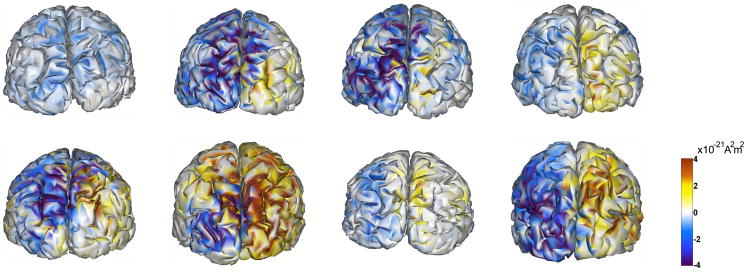
Each subject was cued to attend to the right or left lower visual quadrant in approximately half the trials. Figure 7 shows a sensor map of the difference in alpha activity between cue-right and cue-left trials, averaged over all 8 subjects. Even though these patterns appear dipolar, they should not be confused as such, since these images are power maps. In the right hemisphere, the alpha activity in the cue-right trials is greater than the cue-left trials; the opposite holds true for the left hemisphere. This means that in both hemispheres the ipsilateral is greater than the contralateral alpha activity. Figure 8 provides an example of mapping the attention-related differences in alpha activity onto the cortical surface for a snapshot in time. While there are many commonalities across subjects, Figure 8 also illustrates the variation in activity over time, brain region and subjects that was a motivating factor for the group statistical model described above. Subtracting the Cue Left alpha activity from Cue Right produces positive values in the right hemisphere and negative values in the left hemisphere due to higher alpha levels for ipsilateral (I) versus contralateral (C) conditions. The figure illustrates some of the individual commonalities and differences in effects between hemispheres and subjects at a particular time period (between 500–700 ms, post-cue). It should be noted that these effects are also time-varying (see Fig. 11), consequently the maps for a particular point in time (Figure 8) will not fully reveal the maximal differentiation of each of the multiple cortical foci of activity. Similarly, the Ipsi greater than Contra difference, may not develop at the same time in both hemispheres for all subjects, as seen in Figure 8 where subject 1 does not have an Ipsi > Contra effect in both hemispheres in that time window (but does at a later latency).
Fig. 7.
Alpha power sensor map showing the difference between cue-right and cue-left trials. The effect is averaged over 8 subjects at 600 ms post-cue, and demonstrates that ispilateral is greater than contralateral alpha activity. Spatial accuracy is only approximate, because data has not been aligned with respect to head position among the subjects.
Fig. 8.
An example of inter-subject commonalities and variability in attention effects on cortical alpha levels. Caudal view of cortical maps of eight subjects, displaying attention-related differences in alpha power (cue-right minus cue-left conditions) during the time period of 500–700 ms post-cue. Cortical alpha levels are measured during attention conditions when the cued visual hemifield is ipsilateral (I) or contralateral (C) to the cortical hemisphere. Subtracting the Cue Left activity from Cue Right will produce positive values in the right hemisphere and negative values in the left hemisphere if alpha levels are greater for ipsilateral versus contralateral conditions. Overall, the results show an I > C alpha attention difference in both hemispheres. The magnitude of the I > C difference varies between hemispheres and across subjects, and changes over time for each subject (not shown). While the timing of the I > C difference is similar across subjects, the figure illustrates how the I > C difference may not develop in both hemispheres at the same time for all subjects, as subject 1 does not have an I > C difference in the right hemisphere in this time window (but does at a later latency). The locations of the maximal foci of I > C differences also vary over time (see Fig. 11). Consequently, the maps for a particular point in time will not fully reveal the differentiation of multiple foci of activity.
Fig. 11.
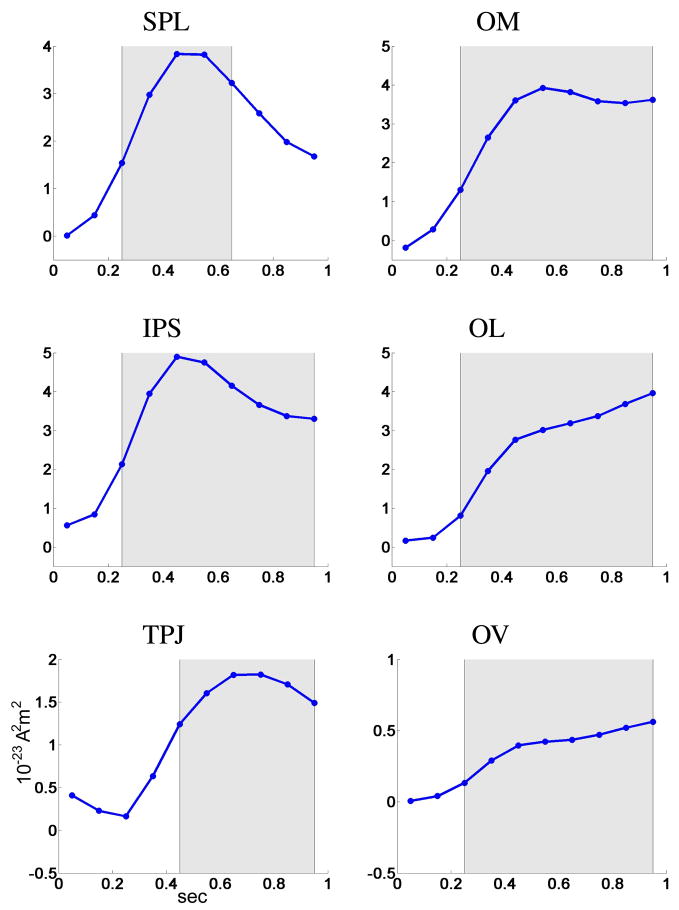
Time course of the ispilateral vs. contralateral statistic SSTF during 0–1 sec at 6 cortical regions. Shaded areas indicate significance after multiplicity correction using a false discovery rate procedure.
We applied our ANCOVA methodology on the 1 s time region following the cue presentation, since at that time the subjects shift and maintain attention to the cued visual quadrant in anticipation of S2. Following the procedure in the method section, we divided the 1 sec post-cue time period into 10 equal intervals, T1 = [0, 100ms], T2 = [100, 200ms], …, T10 = [900, 1000ms], and used the alpha band F1 = [8, 14Hz] and the 6 cortical sites shown in Fig. 5. To estimate baseline activity, we used the time band [−500, −100ms]. For each subject we constructed neural energy observations ESTF,k in these bands, and fit multiple ANCOVA models.
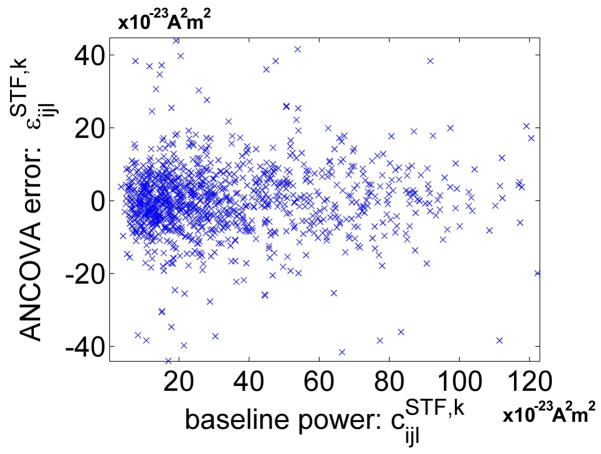
We first investigated how well our model explains the MEG observations. Out of the total variation of ESTF,k, on average 4% was explained by the cue and hemisphere main effects, 12% by the baseline covariate, 66% by the inter-hemispheric correlation, and 18% by the error term. While the error variance is relatively large, we attribute this to large trial to trial variation in the MEG data which we interpret as additive noise in the model. When constructing the ANCOVA model, we made the assumption that the baseline alpha activity has an additive effect on the post-cue activity. If the effect is multiplicative rather than additive, large values of baseline alpha activity would cause large errors in the model. Figure 9 plots the ANCOVA error against the baseline alpha covariate. Since no inflation of error occurs for large baseline alpha activity, a linear model is appropriate for the baseline covariate.
Fig. 9.
Testing model validity. If baseline alpha activity is not an additive effect, as we assume in the ANCOVA model, large values of baseline alpha activity would cause large errors in the model. Since no inflation of error occurs for large baseline alpha activity, the baseline covariate can be included as an additive effect.
After estimating the ispilateral vs. contralateral statistic SSTF using Eq. 11, we established its statistical significance using permutations. The p-values are shown in Table 1. All cortical regions demonstrated significant topographic changes of alpha activity after 200 ms, apart from the temporal parietal junction that had significant activity after 400 ms. Also, the effect in the superior parietal lobe was not significant after 700 ms.
Table 1.
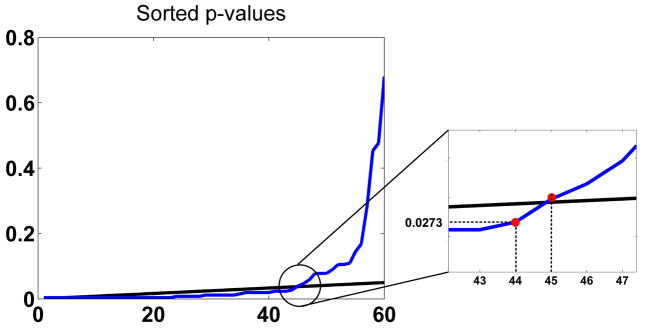
P-values of the ipsilateral vs. contralateral statistic SSTF. Bold values indicate significance after multiplicity correction using a false discovery rate procedure that gave a threshold of 0.0273 (Fig. 10).
| SPL | 0.4766 | 0.1055 | 0.0273 | 0.0039 | 0.0039 | 0.0039 | 0.0234 | 0.0586 | 0.0898 | 0.1055 |
| IPS | 0.0469 | 0.0156 | 0.0039 | 0.0039 | 0.0039 | 0.0039 | 0.0039 | 0.0039 | 0.0195 | 0.0234 |
| TPJ | 0.1094 | 0.1445 | 0.2813 | 0.0781 | 0.0234 | 0.0195 | 0.0195 | 0.0195 | 0.0117 | 0.0117 |
| OM | 0.6797 | 0.0781 | 0.0078 | 0.0039 | 0.0039 | 0.0039 | 0.0039 | 0.0078 | 0.0078 | 0.0117 |
| OL | 0.1680 | 0.0781 | 0.0195 | 0.0039 | 0.0039 | 0.0039 | 0.0039 | 0.0078 | 0.0039 | 0.0039 |
| OV | 0.4531 | 0.0391 | 0.0039 | 0.0039 | 0.0039 | 0.0039 | 0.0078 | 0.0117 | 0.0117 | 0.0117 |
| 0.1 | 0.2 | 0.3 | 0.4 | 0.5 | 0.6 | 0.7 | 0.8 | 0.9 | 1 sec | |
The time course of the statistic SSTF are shown in Figure 11. All cortical regions exhibit significant topographic changes of alpha activity for extended time periods. Alpha band oscillations were higher in all parietal and occipital regions of the ipsilateral hemisphere (ignored representation) relative to the contralateral hemisphere (attended representation), as demonstrated by the positive sign of SSTF. Further, in parietal sites the statistic SSTF reached a peak much earlier than the presentation of the target stimulus (S2): the superior parietal lobe reached a peak in ipsilateral vs. contralateral activity at approximately 500 ms post-cue, and then the effect was suppressed; the temporal parietal junction peaked slightly later at around 700 ms. In contrast, all the cortical occipital sites show increasing alpha topographic changes until the S2 target stimulus occurred.
At 10Hz central frequency, the complex Morlet wavelet we used had approximately 2Hz frequency resolution and 300ms temporal width. The above frequency resolution is enough to guarantee that our analysis in not confounded by nearby frequencies. Furthermore, we investigate the attention effect in much larger temporal scales (1s) than the temporal width of our wavelet, and confounding effects present in peristimulus intervals are limited to only approximately ± 150ms around a stimulus event.
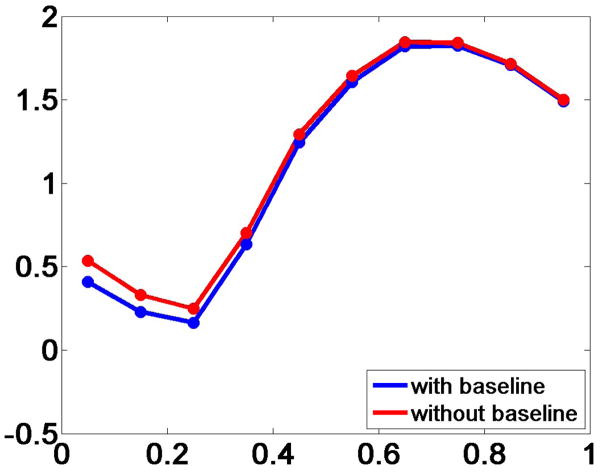
To investigate the effect of the baseline covariate on our ANCOVA model, we removed it and fit the measurements to the reduced model. The timeseries of the SSTF statistic changed slightly at the time region after 0s, and the effect was suppressed as we moved away from the baseline at close to 1s. This indicates that the baseline covariate has prediction power at time instances immediately after the cue stimulus, but not later (Fig. 12).
Fig. 12.
Time course of the attention statistic SSTF at the TPJ for the model shown in Eq. 8 and a reduced model after forcing the baseline covariate to zero.
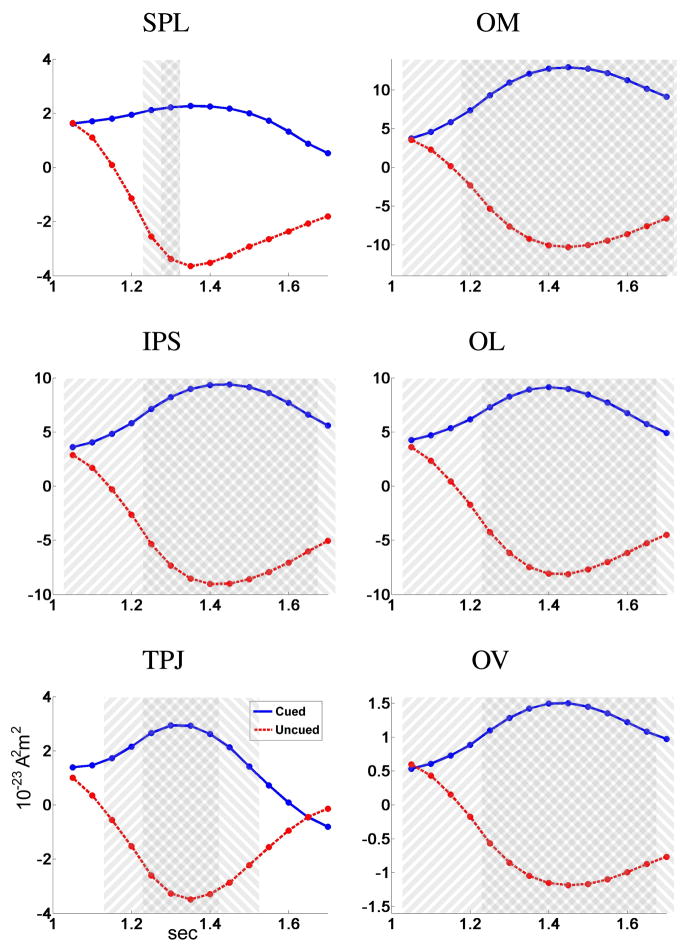
We applied the same ANCOVA analysis for the time period 1–1.7 sec, i.e. after the presentation of the S2. In this case, we used separate models for cued and uncued trials, indicating whether the S2 arrived at the cued direction or the opposite location. For baseline activity, we again used the time band [−500, −100ms]. Notice that the resulting statistic SSTF still represents ispilateral vs. contralateral alpha activity, defined as before relative to the cue stimulus (and not the S2 stimulus). Figure 13 shows separate timeseries for the cued and uncued trials, for a set of 50 ms time bands T1 = [1, 1.05sec], T2 = [1.05, 1.1sec], … T13 = [1.65, 1.7sec]. At the onset of S2 (t = 1 sec) the timeseries are approximately a continuation of Fig. 11. A few hundred milliseconds later, though, the attention statistic for cued trials becomes even more positive, while for the uncued trials the statistic changes sign and becomes negative peaking at 1.3–1.4 sec.
Fig. 13.
Time series of the ispilateral vs. contralateral activity SSTF during 1–1.7 sec for the cued and uncued trials at 6 cortical regions. Shaded areas indicate significance after multiplicity correction using a false discovery rate procedure: 45°clockwise from vertical for cued trials and counter-clockwise for uncued trials.
Even though the above analysis used the total power as observations, it is directly applicable to induced components. The only difference is that, before applying the method, the per condition averaged trial data (evoked components) are removed from the corresponding trials. Then, the analysis proceeds exactly the same, by extracting time-frequency components from each trial and creating observations for a subsequent ANCOVA analysis. In our data, the analysis of only the induced components produced virtually the same results, with timeseries differences typically less than 2%. Therefore, the shape of the timeseries is not affected by the presence of evoked components (N1, P2 and other components from the visual stimulus), but rather is attributed to attention effects.
5 Discussion and Conclusions
Even though topographic changes of alpha activity during anticipatory deployment of visuospatial attention have been explored in multiple EEG studies (e.g. Worden et al. (2000); Sauseng et al. (2005); Marrufo et al. (2001); Thut et al. (2006)), data analyses until now have focused on the sensor domain. Our ANCOVA modeling, combined with minimum-norm inverse imaging and wavelet analysis, allowed us to explore the temporal dynamics of visual attention effects at several cortical sites in the occipital and parietal lobe.
Through the combined use of a cortically-constrained minimum norm mapping and time-frequency analysis we investigated, at the cortical level, induced changes in oscillatory neuronal activity in response to different attentional conditions. Using the ANCOVA framework, we developed a model that includes baseline effects and within trial correlations, as well as main effects. To account for the high dimensionality of these data we perform dimensionality reduction by integrating power over appropriately selected spatial, temporal and frequency regions of interest. Computing contrasts and thresholding to control the false discovery rate then allows us to test hypotheses regarding the spatial and temporal activity, controlling for multiple comparisons. While this framework is applied here to a study of visually cued attention, the approach and model are general and applicable to a broad range of MEG studies that investigate total or induced changes in oscillatory activity. Generally, the method can be applied to any cognitive neuroscience design in which there are cortically specific regions that are expected to vary in accordance with the task conditions. For example, in a language task the effects could be found between different ROIs within a hemisphere, with or without inter-hemispheric comparisons.
The pre-stimulus ‘baseline’ period in cognitive neuroscience studies is frequently treated, either explicitly or implicitly, as a period when physiological activity is zero, or at least as a referent that is considered neutral with respect to the activity that follows the stimulus. However, it is often the case that this referent period could contain activity that reflects a cognitive state related to the subsequent processing. In the present study, for example, the pre-cue ‘baseline’ period reflects an attentive state in which the subject is focused upon discriminating the centrally presented cue stimulus when it arrives. One possible scenario is that such centrally focused attention may be achieved in part by suppressing the peripheral locations, resulting in higher alpha levels bilaterally. By using the alpha activity levels during the baseline as a covariate we can examine whether or not any activity in the baseline contributes to the subsequent attention effects. In the present study this was not the case. However, it is easy to imagine cognitive studies in which the level of baseline activity could be related to the subsequent cognitive processes and our method would be useful in detecting this.
Interpretation of MEG reconstruction maps is typically confounded by limited spatial resolution. This is also the case with our results, where signals from the 6 investigated ROIs can leak to each other, and therefore affect the timeseries extracted in Figs. 11 and 13. However, due to the relatively large extent of the ROIs, the MEG spatial resolution is sufficient to localize the underlying attention mechanisms, as indicated by the different temporal profiles of statistical effects in each cortical ROI.
Scalp EEG studies have provided evidence in support of direction-specific anticipatory modulation of alpha band activity arising, at least in part, from retinotopically-organized cortex in the occipital lobe (Worden et al., 2000; Rihs et al., 2007). However, it was unclear from these studies whether multiple occipital and/or parietal regions are involved. The present results support a mechanism for anticipatory attentional deployment that dynamically modulates local alpha synchrony via a network of parietal and occipital regions, substantiating the claim that occipital sensory cortex is involved in anticipatory attention. Studies of anticipatory attentional deployment often involve both a spatial cue and a pattern discrimination task (Worden et al., 2000; Sauseng et al., 2005; Rihs et al., 2007), yet it has been unclear whether this type of attentional demand induces alpha modulation solely in dorsal occipital regions, or in both dorsal and ventral occipital regions. The results indicate that alpha band activity in both dorsal and ventral occipital regions are modulated by attention, suggesting the network subserving anticipatory visual attention represents both spatial and feature representations. It is known from fMRI studies that parietal regions are involved in anticipatory visuospatial attention (e.g. Kastner et al. (1999); Gitelman et al. (1999); Hopfinger et al. (2000); Corbetta and Shulman (2002); Giesbrecht et al. (2003)), however it is not known whether parietal regions are part of the network of areas that produces attention-related modulation of alpha activity, and whether parietal regions operate bilaterally (Thut et al., 2006) or in a lateralized and direction-specific manner. Our findings indicate that parietal regions are included in the network subserving alpha modulation during anticipatory attention, in a lateralized and direction-specific manner. Our statistical model also allowed us to investigate the timing of attention-related modulations of alpha activity in each cortical region. The results of the present study indicate that the direction-specific alpha modulation increases during the delay, peaking well into the delay period around 500–700 milliseconds after the cue.
Little is known about attention-related modulation of alpha activity following presentation of the S2, as it has not been the emphasis of previous anticipatory attention studies (but see Sauseng et al. (2005). Many of the same questions about the involvement of occipital and/or parietal regions during deployment of anticipatory attention following the cue also apply to the attentive processing of the S2. Sauseng et al. (2005) demonstrated modulation of alpha over posterior scalp similar to the pattern of effects reported in the present study, consistent with attentive processing of the S2. Our results are consistent with the view that alpha modulation during S2 processing arises from activity within a network of occipital and parietal regions.
This paper details a new way of statistically modeling high-dimensional data obtained from MEG, and demonstrates the value of our approach via application of these methods to a visual attention study.
Fig. 10.
FDR procedure for the p-values of the SSTF statistics. The blue line sorts the 60 p-values of Table 1 in ascending order. The black line is the 0.05 significance line for 60 hypothesis tests. Based on FDR theory, all p-values below the highest crossing point, i.e. p ≤ 0.0273, are significant.
Footnotes
Publisher's Disclaimer: This is a PDF file of an unedited manuscript that has been accepted for publication. As a service to our customers we are providing this early version of the manuscript. The manuscript will undergo copyediting, typesetting, and review of the resulting proof before it is published in its final citable form. Please note that during the production process errors may be discovered which could affect the content, and all legal disclaimers that apply to the journal pertain.
References
- Baillet S, Mosher JC, Leahy RM. Electromagnetic brain mapping. IEEE Signal Processins Magazine. 2001;18:14–30. [Google Scholar]
- Benjamini Y, Hochberg Y. Controlling the false discovery rate: a practical and powerful approach to multiple testing. Journal of the Royal Statistical Society. 1995;57:289–300. [Google Scholar]
- Benjamini Y, Yekutieli D. The control of the false discovery rate in multiple testing under dependency. The Annals of Statistics. 2001;29(4):1165–1188. [Google Scholar]
- Corbetta M, Shulman GL. Control of goal-directed and stimulus driven attention in the brain. Nature Review Neuroscience. 2002;3:201–215. doi: 10.1038/nrn755. [DOI] [PubMed] [Google Scholar]
- Darvas F, Pantazis D, Yildirim E, Leahy R. Mapping human brain function with MEG and EEG: methods and validation. NeuroImage. 2004;23(Supplement 1):S289–S299. doi: 10.1016/j.neuroimage.2004.07.014. [DOI] [PubMed] [Google Scholar]
- David O, Kilner JM, Friston KJ. Mechanisms of evoked and induced responses in MEG/EEG. NeuroImage. 2006;31(4):150–158. doi: 10.1016/j.neuroimage.2006.02.034. [DOI] [PubMed] [Google Scholar]
- de Peralta-Menendez R, Hauk O, Gonzalez-Andino S, Vogt H, Michel C. Linear inverse solutions with optimal resolution kernels applied to electromagnetic tomography. Human Brain Mapping. 1997;5:454–467. doi: 10.1002/(SICI)1097-0193(1997)5:6<454::AID-HBM6>3.0.CO;2-2. [DOI] [PubMed] [Google Scholar]
- Fries P, Reynolds JH, Rorie AE, Desimone R. Modulation of oscillatory neuronal synchronization by selective visual attention. Science. 2001;291:1560–1563. doi: 10.1126/science.1055465. [DOI] [PubMed] [Google Scholar]
- Friston K. Brain Mapping: The Methods. Academic Press; 1996. Statistical parametric mapping and other analysis of functional imaging data; pp. 363–385. [Google Scholar]
- Friston KJ, Holmes AP, Worsley KJ, Poline JB, Frith C, Frackowiak RSJ. Statistical parametric maps in functional imaging: A general linear approach. Human Brain Mapping. 1995;2:189–210. [Google Scholar]
- Genovese C, Lazar N, Nichols T. Thresholding of statistical maps in functional neuroimaging using the false discovery rate. NeuroImage. 2002;15:870–878. doi: 10.1006/nimg.2001.1037. [DOI] [PubMed] [Google Scholar]
- Giesbrecht B, Woldorff M, Song A, Mangun G. Neural mechanisms of top-down control during spatial and feature attention. NeuroImage. 2003;19:496–512. doi: 10.1016/s1053-8119(03)00162-9. [DOI] [PubMed] [Google Scholar]
- Gitelman D, Nobre A, Parrish T, LaBar K, Kim Y, Meyer J, Mesulam M. A large-scale distributed network for covert spatial attention. Brain. 1999;122:1093–1106. doi: 10.1093/brain/122.6.1093. [DOI] [PubMed] [Google Scholar]
- Hämäläinen M, Hari R, Ilmoniemi R, Knuutila J, Lounasmaa O. Magnetoencephalography. theory, instrumentation and applications to the noninvasive study of human brain function. Reviews of Modern Physics. 1993;65:413–448. [Google Scholar]
- Hopfinger JB, Buonocore MH, Mangun GR. The neural mechanisms of top-down attentional control. Nature Neuroscience. 2000;3(3):284–291. doi: 10.1038/72999. [DOI] [PubMed] [Google Scholar]
- Huang M, Mosher J, Leahy R. A sensor-weighted overlapping-sphere head model and exhaustive head model comparison for MEG. Physics in Medicine and Biology. 1999;44(2):423–440. doi: 10.1088/0031-9155/44/2/010. [DOI] [PubMed] [Google Scholar]
- Hyvarinen Aj, Karhunen Oja E., editors. Independent Component Analysis. Wiley-Interscience; 2001. [Google Scholar]
- K-Yildirim E, Pantazis D, Leahy R. Task-based comparison of inverse methods in magnetoencephalography. IEEE Transactions on Biomedical Engineering. 2006;53(9):1783–1793. doi: 10.1109/TBME.2006.873747. [DOI] [PubMed] [Google Scholar]
- Kastner S, Pinsk MA, Weerd PD, Desimone R, Ungerleider LG. Increased activity in human visual cortex during directed attention in the absence of visual stimulation. Neuron. 1999;22:751–761. doi: 10.1016/s0896-6273(00)80734-5. [DOI] [PubMed] [Google Scholar]
- Kelly SP, Lalor EC, Reilly RB, Foxe JJ. Increases in alpha oscillatory power reflect an active retinotopic mechanism for distracter suppression during sustained visuospatial attention. Journal of Neurophysiology. 2006;95:3844–3851. doi: 10.1152/jn.01234.2005. [DOI] [PubMed] [Google Scholar]
- Kiebel S. The general linear model. In: Frackowiak R, Friston K, Frith C, Dolan R, Friston K, Price C, Zeki S, Ashburner J, Penny W, editors. Human Brain Function. 2. Academic Press; 2003. [Google Scholar]
- Kiebel S, Baudry CT, Friston K. Parametric analysis of oscillatory activity as measured with EEG/MEG. Human Brain Mapping. 2005;26(3):170–177. doi: 10.1002/hbm.20153. [DOI] [PMC free article] [PubMed] [Google Scholar]
- Liu A, Dale A, Belliveau J. Monte carlo simulation studies of EEG and MEG localization accuracy. Human Brain Mapping. 2002;16:47–62. doi: 10.1002/hbm.10024. [DOI] [PMC free article] [PubMed] [Google Scholar]
- Marrufo MV, Vaquero E, Cardoso MJ, Gomez CM. Temporal evolution of alpha and beta bands during visual spatial attention. Cognitive Brain Research. 2001;12:315–320. doi: 10.1016/s0926-6410(01)00025-8. [DOI] [PubMed] [Google Scholar]
- Mosher J, Baillet S, Darvas F, Pantazis D, Yildirim E, Leahy R. Brainstorm electromagnetic imaging software. International Journal of Bioelectromagnetism. 2005;7(2):189–190. [Google Scholar]
- Nichols TE, Holmes AP. Nonparametric permutation tests for functional neuroimaging: A primer with examples. Human Brain Mapping. 2001;15:1–25. doi: 10.1002/hbm.1058. [DOI] [PMC free article] [PubMed] [Google Scholar]
- Palva S, Palva J. New vistas for α-frequency band oscillations. Trends in Neurosciences. 2007;30(4):1580–1591. doi: 10.1016/j.tins.2007.02.001. [DOI] [PubMed] [Google Scholar]
- Pantazis D, Nichols TE, Baillet S, Leahy RM. Spatiotemporal localization of significant activation in MEG using permutation tests. In: Taylor C, Noble JA, editors. Proc 18th Conf. Information Processing in Medical Imaging. Jul, 2003. pp. 512–523. [DOI] [PubMed] [Google Scholar]
- Pantazis D, Nichols TE, Baillet S, Leahy RM. A comparison of random field theory and permutation methods for the statistical analysis of MEG data. Neuroimage. 2005a;25(2):383–394. doi: 10.1016/j.neuroimage.2004.09.040. [DOI] [PubMed] [Google Scholar]
- Pantazis D, Simpson G, Weber D, Dale C, Nichols T, Leahy R. Exploring human visual attention in an MEG study of a spatial cueing paradigm using a novel ANCOVA design. 2007 IEEE International Symposium on Biomedical Imaging: From Nano to Macro.April 12–15, 2007. [Google Scholar]
- Pantazis D, Weber D, Dale C, Nichols T, Simpson GV, Leahy R. Imaging of oscillatory behavior in event-related MEG studies. In: Bouman C, Miller E, editors. Proceedings of SPIE, Computational Imaging III. Vol. 5674. 2005b. pp. 55–63. [Google Scholar]
- Posner MI, Petersen SE. The attention system of the human brain. Annual Reviews of Neuroscience. 1990;13:25–42. doi: 10.1146/annurev.ne.13.030190.000325. [DOI] [PubMed] [Google Scholar]
- Rihs T, Michel C, Thut G. Mechanisms of selective inhibition in visual spatial attention are indexed by α-band EEG synchronization. European Journal of Neuroscience. 2007;25(2):603–610. doi: 10.1111/j.1460-9568.2007.05278.x. [DOI] [PubMed] [Google Scholar]
- Sauseng P, Klimesch W, Stadler W, Schabus M, Doppelmayr M, Hanslmayr S, Gruber WR, Birbaumer N. A shift of visual spatial attention is selectively associated with human EEG alpha activity. Journal of Neuroscience. 2005;22:2917–2926. doi: 10.1111/j.1460-9568.2005.04482.x. [DOI] [PubMed] [Google Scholar]
- Tallon-Baudry C, Bertrand O. Oscillatory gamma activity in humans and its role in object representation. Trends in Cognitive Sciences. 1999 April;3 (4):151–162. doi: 10.1016/s1364-6613(99)01299-1. [DOI] [PubMed] [Google Scholar]
- Tallon-Baudry C, Bertrand O, Delpuech C, Permier J. Stimulus specificity of phase-locked and non-phase-locked 40Hz visual responses in human. Neuroscience. 1996;16 (16):4240–4249. doi: 10.1523/JNEUROSCI.16-13-04240.1996. [DOI] [PMC free article] [PubMed] [Google Scholar]
- Teolis A, editor. Computational Signal Processing With Wavelets (Applied and Numerical Harmonic Analysis) Birkhauser; Boston: Mar, 1998. [Google Scholar]
- Thut G, Nietzel A, Brandt SA, Pascual-Leone A. α-band electroencephalographic activity over occipital cortex indexes visuospatial attention bias and predicts visual target detection. Journal of Neuroscience. 2006;26(37):9494–9502. doi: 10.1523/JNEUROSCI.0875-06.2006. [DOI] [PMC free article] [PubMed] [Google Scholar]
- Tikhonov A, Arsenin V. Solutions of ill-posed problems. Winston and Sons; 1977. [Google Scholar]
- Verbeke G, Molenberghs G. Linear Mixed Models for Longitudinal Data. Springer-Verlag Inc.; 2000. [Google Scholar]
- Vetterli M, Kovacevic J, editors. Prentice Hall PTR. 1 Apr, 1995. Wavelets and Subband Coding. [Google Scholar]
- Worden MS, Foxe JJ, Wang N, Simpson GV. Anticipatory biasing of visuospatial attention indexed by retinotopically specific alpha-band electroencephalography increases over occipital cortex. The Journal of Neuroscience. 2000;20:RC631–6. doi: 10.1523/JNEUROSCI.20-06-j0002.2000. [DOI] [PMC free article] [PubMed] [Google Scholar]
- Worsley KJ, Evans AC, Marrett S, Neelin P. A three-dimensional statistical analysis for CBF activation studies in human brain. Journal of Cerebral Blood Flow and Metabolism. 1992;12:900–918. doi: 10.1038/jcbfm.1992.127. [DOI] [PubMed] [Google Scholar]


