Abstract
Many physiological and synthetic agents act by occluding the ion conduction pore of ion channels. A hallmark of charged blockers is that their apparent affinity for the pore usually varies with membrane voltage. Two models have been proposed to explain this voltage sensitivity. One model assumes that the charged blocker itself directly senses the transmembrane electric field, i.e., that blocker binding is intrinsically voltage dependent. In the alternative model, the blocker does not directly interact with the electric field; instead, blocker binding acquires voltage dependence solely through the concurrent movement of permeant ions across the field. This latter model may better explain voltage dependence of channel block by large organic compounds that are too bulky to fit into the narrow (usually ion-selective) part of the pore where the electric field is steep. To date, no systematic investigation has been performed to distinguish between these voltage-dependent mechanisms of channel block. The most fundamental characteristic of the extrinsic mechanism, i.e., that block can be rendered voltage independent, remains to be established and formally analyzed for the case of organic blockers. Here, we observe that the voltage dependence of block of a cyclic nucleotide–gated channel by a series of intracellular quaternary ammonium blockers, which are too bulky to traverse the narrow ion selectivity filter, gradually vanishes with extreme depolarization, a predicted feature of the extrinsic voltage dependence model. In contrast, the voltage dependence of block by an amine blocker, which has a smaller “diameter” and can therefore penetrate into the selectivity filter, follows a Boltzmann function, a predicted feature of the intrinsic voltage dependence model. Additionally, a blocker generates (at least) two blocked states, which, if related serially, may preclude meaningful application of a commonly used approach for investigating channel gating, namely, inferring the properties of the activation gate from the kinetics of channel block.
INTRODUCTION
The conduction pore of ion channels can be physically blocked by natural or synthetic agents. Occlusion of the pore by natural blockers underlies important physiological processes, including visual signal transduction, neurotransmission, or shaping of the cardiac action potential (Hille, 2001). Several pharmacological agents produce therapeutic effects by blocking ion channels (Macdonald and Kelly, 1995; Carmeliet and Mubagwa, 1998; Bräu et al., 2001). In some cases, channel block produces severe adverse effects, such as the lethal acquired long-QT syndrome (Keating and Sanguinetti, 2001). Given that ion channel pores possess substantial longitudinal depth, blockers may travel along and interact with parts of the pore before reaching their deepest site. Binding schemes for such interactions will likely comprise multiple steps (Shin and Lu, 2005; Shin et al., 2005; Xu et al., 2009). In cases where blocker affinity for all but the final binding site is negligible, a multistep block may be mistaken for a single-step reaction. As discussed later, the existence of multiple, sequential blocked states may preclude deduction of channel-gating mechanisms from the dependence of blocking kinetics on channel open probability.
Most pore blockers are charged, and the apparent affinity of channels for these blockers often varies significantly with membrane voltage. Two general model types have been proposed to explain this voltage dependence. In one model, the voltage dependence is intrinsic to the binding of the blocking ion within the transmembrane electric field (Woodhull, 1973), and if the blocker is not permeant, the extent of block is expected to be a Boltzmann function of membrane voltage. During the past three decades, this model has been invoked over a thousand times to account for voltage dependence of channel block (e.g., Hagiwara et al., 1978; Neher and Steinbach, 1978; Coronado and Miller, 1979; Blatz and Magleby, 1984; Mayer and Westbrook, 1987; Blaustein and Finkelstein, 1990). The alternative model posits that the blocker does not bind within the electric field, but that the apparent voltage dependence of block reflects the concurrent movement of permeant ions displaced across the electric field by the blocker (Armstrong, 1971; see also Spassova and Lu, 1998, 1999). This model has mostly been used to explain how raising the permeant ion concentration on the opposite side of the membrane lowers the apparent blocker affinity, a phenomenon sometimes dubbed the trans knock-off effect (Armstrong and Binstock, 1965; Hille and Schwarz, 1978; Yellen, 1984; Neyton and Miller, 1988). However, it has relatively infrequently been used to interpret the voltage dependence of channel block itself (e.g., MacKinnon and Miller, 1988; Park and Miller, 1992; Ruppersberg et al., 1994; Spassova and Lu, 1998; Thompson and Begenisich, 2001, 2003; Nimigean and Miller, 2002; Guo et al., 2003; Kutluay et al., 2005; Shin and Lu, 2005; Oseguera et al., 2007; Xu et al., 2009), even though it is the more plausible mechanism for block by organic compounds too bulky to fit into the narrow, high-field part of the pore.
It is noteworthy that in typical voltage-gated channels, the apparent rate of an intracellular blocker entering or exiting the pore may depend on voltage-regulated channel open probability. Such dependence of channel block on voltage gating would complicate studies of the voltage sensitivity of channel block that arises solely from the movement of a blocker and/or permeant ions within the transmembrane electric field along the pore. To avoid this complication, we have used a retinal CNG channel as a model to illustrate the electrophysiological hallmarks and analytical characteristics of both types of mechanism underlying voltage-dependent channel block.
CNG channels mediate visual signal transduction in vertebrate retinal rods and are activated by cGMP (Yau and Baylor, 1989), opening in darkness when the intracellular cGMP concentration is elevated and closing when it is lowered in light. These channels exhibit practically no (or modest) voltage gating in saturating (or subsaturating) concentrations of cGMP (Benndorf et al., 1999; Martínez-François et al., 2009). They can be blocked by divalent cations and polyamines from either side of the membrane in a voltage-dependent manner (Stern et al., 1987; Colamartino et al., 1991; Zimmerman and Baylor, 1992; Root and MacKinnon, 1993; Eismann et al., 1994; Guo and Lu, 2000). Physiological block of the channels reduces the relative contribution of individual channel currents to the overall macroscopic current, a property that allows accurate phototransduction of light intensity (Yau and Baylor, 1989; Rieke and Baylor, 1998).
MATERIALS AND METHODS
Molecular biology and oocyte preparation
Complementary DNA for CNGA1 (Kaupp et al., 1989) was cloned into the pGEM-HE plasmid (Liman et al., 1992), which was provided by S. Siegelbaum (Columbia University, New York, NY). The cRNA was synthesized with T7 polymerase (Promega) using linearized cDNA as a template. Oocytes harvested from Xenopus laevis were incubated in a solution containing (in mM): 82.5 NaCl, 2.5 KCl, 1.0 MgCl2, and 5.0 HEPES, pH 7.6, and 2–4 mg/ml collagenase (Worthington Biochemical Corp.). The oocyte preparation was agitated at 100 rpm. It was then rinsed thoroughly and stored in a solution containing (in mM): 96 NaCl, 2.5 KCl, 1.8 CaCl2, 1.0 MgCl2, and 5 HEPES, pH 7.6, and 50 µg/ml gentamicin. Defolliculated oocytes were selected and injected with RNA at least 2 and 16 h, respectively, after collagenase treatment. All oocytes were stored at 18°C.
Recordings and solutions
Macroscopic currents were recorded from inside-out membrane patches of Xenopus oocytes heterologously expressing CNGA1 channels with an amplifier (Axopatch 200B; MDS Analytical Technologies), filtered at 5 kHz, and sampled at 25 kHz using an analogue-to-digital converter (Digidata 1322A; MDS Analytical Technologies) interfaced to a personal computer. pClamp8 software (MDS Analytical Technologies) was used for amplifier control and data acquisition. To elicit macroscopic currents, the voltage across the membrane patch was first hyperpolarized from the 0-mV holding potential to the most hyperpolarizing or depolarizing potential indicated, and then stepped to various test voltages in 10-mV increments and back to 0 mV. The currents in the absence of cGMP were used as templates for subsequent offline background current corrections. Both the internal and external solutions contained (in mM): 0.1 EDTA, 5 HEPES, pH 7.6, and, unless otherwise specified, 130 NaCl. To activate the channel, a saturating (2-mM) concentration of cGMP was included in the internal solution. All chemicals were purchased from Sigma-Aldrich, except for C10-TEA, which was provided by C. Armstrong (University of Pennsylvania, Philadelphia, PA).
Data analysis
Data analysis and curve fitting were performed with Origin 8.0 (OriginLab Corp.). The figures were made using Origin 8.0 and CorelDRAW X14 (Corel Corp.).
RESULTS
CNGA1 channel block by extracellular philanthotoxin (PhTx)
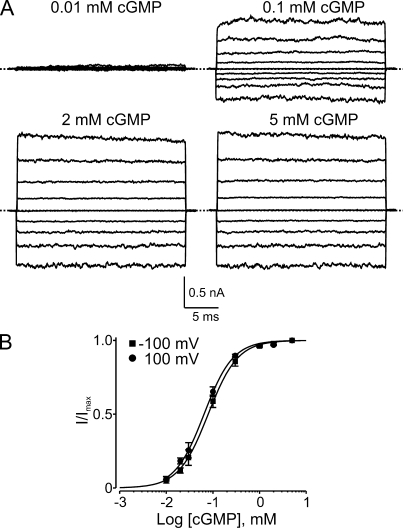
We first constructed a dose–response curve for cGMP activation of retinal CNGA1 channels in our recording system. Fig. 1 A shows currents recorded from an inside-out membrane patch in the presence of four concentrations of intracellular cGMP. Confirming previous reports (Kaupp et al., 1989; Goulding et al., 1994; Zagotta and Siegelbaum, 1996; Benndorf et al., 1999), cGMP stimulates current with an EC50 of ∼80 µM, approaching saturation at 2 mM cGMP. The dose–response curve differs little between −100 and 100 mV (Fig. 1 B).
Figure 1.
cGMP activation of CNGA1 channels. (A) Macroscopic current traces recorded in symmetric 130 mM Na+ from an inside-out patch containing CNGA1 channels in the presence of the indicated concentrations of intracellular cGMP. Currents were elicited by stepping from the 0-mV holding potential to voltages between −200 and 200 mV in 50-mV increments. Currents in the absence of cGMP were used as templates for subsequent offline background current corrections. Dotted lines indicate 0 current levels. (B) Fraction of maximal current (I/Imax; mean ± SEM; n = 3–7) plotted against cGMP concentration for −100 mV (squares) and 100 mV (circles). Solid curves are Hill equation fits yielding EC50 = 79 ± 1 µM and h = 1.37 ± 0.03 at −100 mV, and EC50 = 64 ± 2 µM and h = 1.39 ± 0.05 at 100 mV.
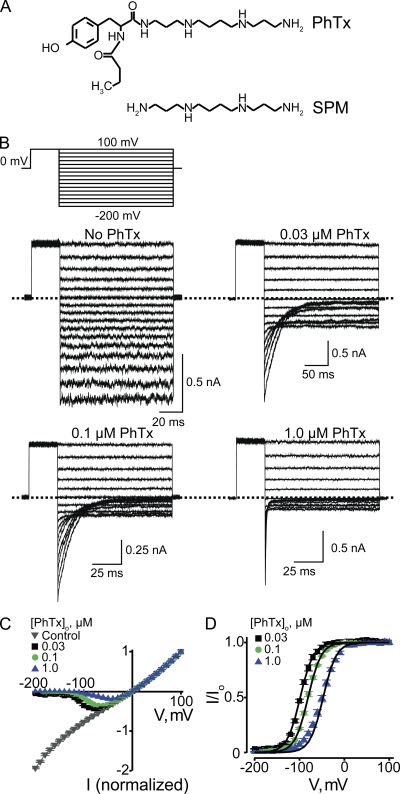
The polyamine spermine not only blocks (from either side) but also robustly permeates CNGA1 channels (Lu and Ding, 1999; Lynch, 1999; Guo and Lu, 2000; Nevin et al., 2000). As the latter property complicates the study of the mechanism of block, we used PhTx instead, which can be thought of as a spermine molecule with a bulky group at one end (Fig. 2 A). The spermine portion of the PhTx molecule, like spermine itself, is expected to bind in the narrow selectivity filter, but the bulky group will prevent PhTx from sliding through (Guo and Lu, 2000; see also Bähring et al., 1997). Fig. 2 B shows CNGA1 currents in the absence or presence of three concentrations of extracellular PhTx. The channels were activated with 2 mM of intracellular cGMP, and currents were elicited with the voltage protocol shown. The corresponding steady-state I-V curves are shown in Fig. 2 C. In the absence of PhTx, the I-V curve is approximately linear. Extracellular PhTx blocks the channels in a voltage-dependent manner, rendering the I-V curve outwardly rectifying. To better illustrate the voltage dependence of channel block, we made a plot of the fraction of current not blocked (I/Io) against voltage, which we will call the (voltage-dependent) blocking curve (Fig. 2 D). As expected for a mechanism where a positively charged extracellular blocker enters the transmembrane electric field, the fraction of current not blocked obeys a Boltzmann function that approaches 0 at extreme negative potentials. A fit of the data yields an apparent dissociation constant (appKd) at 0 mV of 2.71 ± 0.20 × 10⁻⁵ M and an effective valence (Z) of 1.76 ± 0.02.
Figure 2.
Voltage-dependent CNGA1 block by extracellular PhTx. (A) Structures of PhTx and spermine (SPM). (B) Macroscopic current traces recorded from inside-out patches containing CNGA1 channels in the presence of the indicated concentrations of extracellular PhTx (in the pipette solution). Currents were activated with 2 mM of intracellular cGMP and elicited with the voltage protocol shown. Dotted lines indicate 0 current levels. (C) Mean I-V curves (mean ± SEM; n = 3–11) determined at the end of the test pulses in the absence or presence of three concentrations of extracellular PhTx. (D) Fraction of current not blocked (mean ± SEM; n = 4–6) by extracellular PhTx is plotted against membrane voltage. Curves are fits of a Boltzmann function (Eq. 1) to the three datasets simultaneously with parameters: appKd (0 mV) = 2.71 ± 0.20 × 10⁻⁵ M and Z = 1.76 ± 0.02.
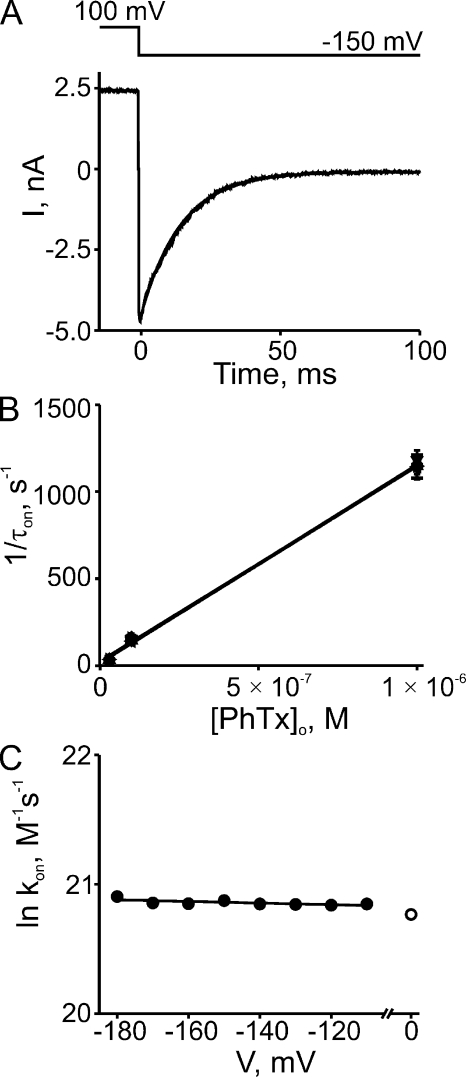
At low blocker concentrations, the ON rates of current block are sufficiently slow to allow kinetic analysis. Fig. 3 A shows current block by 0.1 µM PhTx initiated by a voltage step from 100 to −150 mV; it follows a single-exponential time course. Similar records were made for three PhTx concentrations (0.03, 0.1, and 1 µM) at eight voltages between −110 and −180 mV. In Fig. 3 B, we plot the reciprocals of the corresponding averaged time constants against PhTx concentration. At each PhTx concentration, the data points for all eight voltages are superimposed; thus, there is no discernible effect of voltage on the value of the individual slopes, i.e., on the second-order rate constant for blocker binding (Fig. 3 C). Linear extrapolation of the fit in Fig. 3 C to 0 mV yields a second-order rate constant kon (0 mV) of 1.04 ± 0.06 × 10⁹ M−1s−1 for extracellular blocker binding to the pore, with valence (zon, estimated from the extrapolating slope) indistinguishable from 0 (0.01 ± 0.01).
Figure 3.
Kinetics of hyperpolarization-induced CNGA1 block by extracellular PhTx. (A) Current transient elicited by stepping membrane voltage from 100 to −150 mV in the continued presence of 0.1 µM of extracellular PhTx. The superimposed curve is a single-exponential fit. (B) Reciprocal of the time constant (mean ± SEM; n = 4–6) for channel block (1/τon), obtained from fits as shown in A, is plotted against the extracellular concentration of PhTx for eight voltages. The (unresolved) lines through the data are linear fits whose slope represents the apparent second-order rate constant (kon) for blocker binding. (C) Natural logarithm of kon from B is plotted against membrane voltage. The plot is fitted with the equation ln kon = ln kon (0 mV) − zonVF/RT, yielding kon (0 mV) = 1.04 ± 0.06 × 10⁹ M−1s−1 (open circle) and zon = 0.01 ± 0.01.
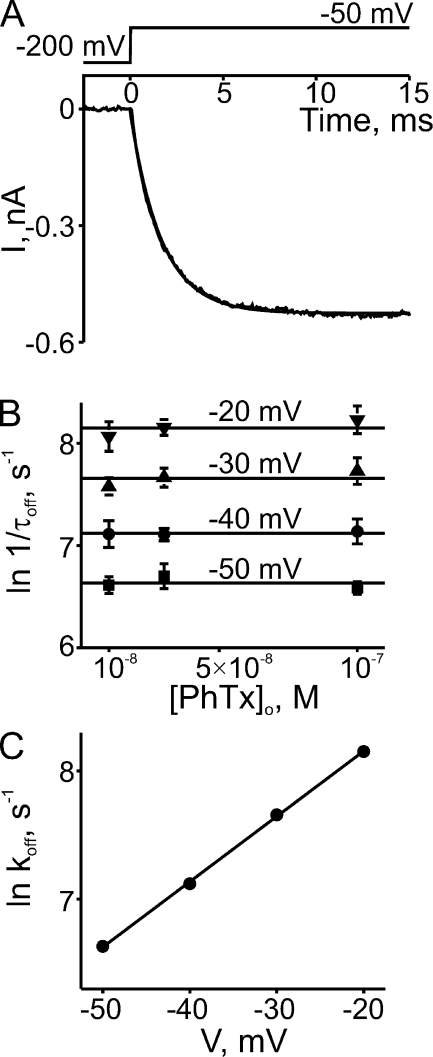
Unblocking kinetics were inferred from the time course of depolarization-induced current recovery. Fig. 4 A shows an example of current recovery from block by 0.1 µM PhTx, initiated by a voltage step from −200 to −50 mV; recovery again follows a single-exponential time course. The reciprocal of the time constant (1/τoff or koff) is independent of PhTx concentration (as expected) but varies with voltage (Fig. 4 B). The averages (over the three concentrations tested) of the natural logarithm of koff are plotted against voltage in Fig. 4 C. A linear fit of the plot yields koff (0 mV) = 9.65 ± 0.35 × 10³ s−1 and valence (zoff) = 1.31 ± 0.02. The calculated ratio koff/kon = 9.28 × 10⁻⁶ M (at 0 mV) is 34% of the apparent dissociation constant appKd (0 mV) = 2.71 × 10⁻⁵ M determined from equilibrium measurements, and zon + zoff = 1.32 is 75% of the latter’s apparent valence Z = 1.76 (Fig. 2). The implication of these differences will be discussed below.
Figure 4.
Kinetics of depolarization-induced recovery from CNGA1 block by extracellular PhTx. (A) Current transient elicited by stepping the membrane voltage from −200 to −50 mV in the presence of 0.1 µM of extracellular PhTx. The superimposed curve is a single-exponential fit. (B) Natural logarithm of the reciprocal of the time constant (mean ± SEM; n = 4–6) for channel unblock (1/τoff, an estimate of the apparent off-rate constant koff) at four voltages, obtained from fits as shown in A, is plotted against the concentration of extracellular PhTx. Lines through the data represent averages over the three concentrations tested at each voltage. (C) Natural logarithm of koff from B is plotted against membrane voltage. The plot is fitted with the equation ln koff = ln koff (0 mV) + zoffVF/RT, yielding koff (0 mV) = 9.65 ± 0.35 × 10³ s−1 and zoff = 1.31 ± 0.02.
CNGA1 channel block by intracellular PhTx
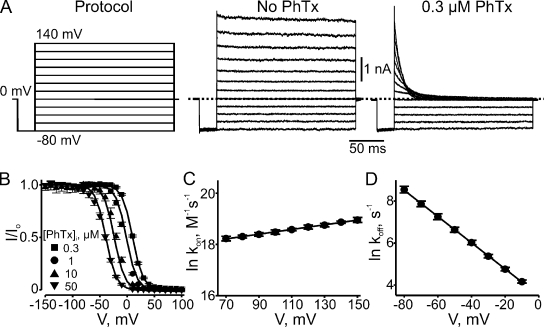
In similar fashion, we examined CNGA1 block by intracellular PhTx. Fig. 5 A shows currents recorded in the absence or presence of 0.3 µM PhTx. Intracellular PhTx, like extracellular PhTx, blocks the channels in a voltage-dependent manner. To examine the voltage dependence of channel block by intracellular PhTx, we plotted the blocking curves for four concentrations of intracellular PhTx in Fig. 5 B. As expected, if PhTx were binding in the electric field, the fraction of current not blocked decreases with membrane depolarization and approaches 0 at extreme positive potentials. A Boltzmann function fits the data well and yields appKd (0 mV) = 8.58 ± 0.38 × 10⁻⁷ M and valence Z = 2.67 ± 0.04.
Figure 5.
Voltage-dependent block by intracellular PhTx. (A) Macroscopic current traces recorded from an inside-out patch containing CNGA1 channels in the absence or presence of 0.3 µM of intracellular PhTx. Currents were activated with 2 mM of intracellular cGMP and elicited with the voltage protocol shown. Dotted line indicates 0 current level. (B) Fraction of current not blocked (mean ± SEM; n = 5–10) by intracellular PhTx is plotted against membrane voltage. Curves are fits of a single Boltzmann function to the four datasets simultaneously with parameters: appKd (0 mV) = 8.58 ± 0.38 × 10⁻⁷ M and Z = 2.67 ± 0.04. (C) Kinetics of depolarization-induced CNGA1 block by intracellular PhTx. Natural logarithm of second-order rate constant kon, determined as in Fig. 3, at three concentrations of intracellular PhTx (0.3, 1, and 10 µM; n = 8) is plotted against membrane voltage. The plot is fitted with the equation ln kon = ln kon (0 mV) + zonVF/RT, yielding kon (0 mV) = 4.23 ± 0.34 × 10⁷ M−1s−1 and zon = 0.23 ± 0.01. (D) Kinetics of hyperpolarization-induced recovery from CNGA1 block by intracellular PhTx. Natural logarithm of koff, determined as in Fig. 4, at three concentrations of intracellular PhTx (0.1, 0.3, and 1 µM; n = 5) is plotted against membrane voltage. The plot is fitted with the equation ln koff = ln koff (0 mV) − zoffVF/RT, yielding koff (0 mV) = 33 ± 1 s−1 and zoff = 1.60 ± 0.01.
We also performed kinetic analyses of the development of, and recovery from, channel block by intracellular PhTx, initiated with voltage jumps. Fig. 5 (C and D) plots the natural logarithm of the second-order blocking rate constant (kon) and of the unblocking rate constant (koff), respectively, against membrane voltage. Voltage dependence is weak for kon and strong for koff. A linear fit of the data yields kon (0 mV) = 4.23 ± 0.34 × 10⁷ M−1s−1 with low valence zon = 0.23 ± 0.01, and koff (0 mV) = 33 ± 1 s−1 with high valence zoff = 1.60 ± 0.01. The calculated ratio koff/kon = 7.80 × 10⁻⁷ M is comparable to appKd = 8.58 × 10⁻⁷ M determined from equilibrium measurements (Fig. 5 B), but zon + zoff = 1.83 is 68% of the latter’s Z = 2.67. As demonstrated later, this discrepancy signifies that a two-step (at least) model is required to account for block by intracellular PhTx.
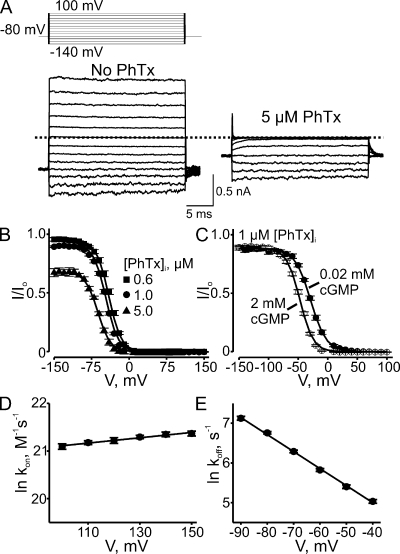
The simplest way to reveal a suspected low affinity blocking state would be to apply much higher PhTx concentrations, but this was cost prohibitive. We therefore increased the apparent affinity of the toxin by lowering the Na+ concentration on both sides of the membrane from 130 mM (used in all experiments thus far) to 30 mM. As shown in Fig. 6 (A and B), under low Na+ conditions, intracellular PhTx, as expected, produces voltage-dependent block with markedly higher affinity. Lowering Na+ now also reveals the existence of dose-dependent but voltage-independent channel block at highly hyperpolarized voltages (−100 to −150 mV). Thus, intracellular PhTx apparently produces both voltage-dependent and -independent blocked states, and the blocking curve is no longer described by a simple Boltzmann function.
Figure 6.
Voltage dependence of intracellular PhTx block under low Na+ conditions. (A) Macroscopic current traces recorded in an inside-out patch containing CNGA1 channels in the absence or presence of 5 µM of intracellular PhTx in symmetrical 30 mM Na+. Currents were activated with 2 mM of intracellular cGMP and elicited with the voltage protocol shown. Dotted line indicates 0 current level. (B) Fraction of current not blocked (mean ± SEM; n = 4–8) by the indicated concentrations of intracellular PhTx is plotted against membrane voltage. Curves are fits of Eq. 3 to the three datasets simultaneously with Z1 fixed at 0. The best-fit parameters were: K1 = 1.04 ± 0.03 × 10⁻⁵ M, K2 = 2.03 ± 0.14 × 10⁻³, and Z2 = 2.08 ± 0.04. (C) Fraction of current not blocked (mean ± SEM; n = 8) by 1 µM of intracellular PhTx in the presence of 0.02 mM (filled circles) or 2 mM (open circles; taken from B) cGMP is plotted against membrane voltage. Curves are fits of Eq. 3 to both datasets simultaneously, with Z1 set to 0 and K1 common to both cGMP curves. The best-fit parameters were: K1 = 7.65 ± 0.22 × 10⁻⁶ M for both cGMP concentrations; K2 = 1.29 ± 0.08 × 10⁻² and Z2 = 1.92 ± 0.05 for 0.02 mM cGMP; and K2 = 1.72 ± 0.18 × 10⁻³ and Z2 = 2.29 ± 0.06 for 2 mM cGMP. (D) Kinetics of depolarization-induced CNGA1 block by intracellular PhTx in 30 mM Na+. Natural logarithm of kon, determined as in Fig. 3, at four concentrations (0.03, 0.1, 0.3, and 1 µM; n = 6) of intracellular PhTx is plotted against membrane voltage. The plot is fitted with the equation ln kon = ln kon (0 mV) + zonVF/RT, yielding kon (0 mV) = 8.42 ± 0.68 × 10⁸ M−1s−1 and zon = 0.14 ± 0.01. (E) Kinetics of hyperpolarization-induced recovery from CNGA1 block by intracellular PhTx in 30 mM Na+. Natural logarithm of koff, determined as in Fig. 4, at four concentrations (0.1, 0.3, 0.6, and 1 µM; n = 6) of intracellular PhTx is plotted against membrane voltage. The plot is fitted with the equation ln koff = ln koff (0 mV) − zoffVF/RT, yielding koff (0 mV) = 27 ± 2 s−1 and zoff = 1.10 ± 0.02.
We also analyzed the kinetics of block and unblock under low Na+ conditions. The logarithms of kon and koff are plotted against voltage in Fig. 6 (D and E, respectively). As was the case under high Na+ conditions, kon (8.42 ± 0.68 × 10⁸ M−1s−1 at 0 mV) exhibits little voltage dependence (zon = 0.14 ± 0.01), whereas koff (27 ± 2 s−1 at 0 mV) exhibits considerable dependence (zoff = 1.10 ± 0.02).
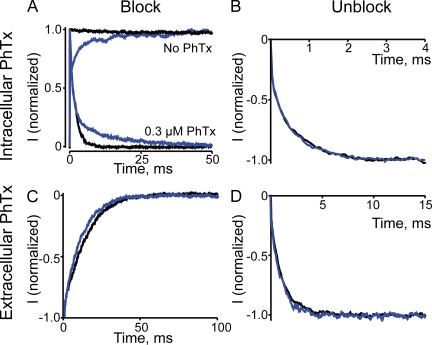
The low affinity, voltage-independent block was unaffected, i.e., the plateau of the blocking curve seen at hyperpolarized voltages in low Na+ conditions remained unchanged by lowering the cGMP concentration from 2 mM (saturating) to 20 µM (Fig. 6 C), where only 14.1 ± 1.9% (n = 8) of maximal current was activated. However, lowering the cGMP concentration shifted the blocking curve to the right. As explained in the Discussion, this shift may reflect a cGMP-sensitive gating transition that is not directly probed by the following kinetic measurements. Fig. 7 (A and B) compares the ON and OFF kinetics of intracellular PhTx block of channels activated by either 2 mM or 20 µM cGMP. Depolarization-induced block of current activated by 2 mM cGMP (Fig. 7 A; lower black trace) follows a single-exponential time course. At low (20 µM) cGMP, the time course of current block (Fig. 7 A; lower blue trace) initially tracks that in 2 mM cGMP and then becomes slower. A slow component is expected because at low cGMP concentrations, outward current elicited by a depolarizing voltage pulse also develops in two phases: a nearly instantaneous step, followed by a slow phase that reflects modest further enhancement of channel activation by voltage (Benndorf et al., 1999; Martínez-François et al., 2009), which is seen only at subsaturating cGMP concentrations (Fig. 7 A; upper traces). It follows then that only the fast phase of voltage step–induced current block in 20 µM cGMP reflects the actual kinetics of channel block, whereas the slow phase is primarily rate limited by the voltage-dependent additional channel activation that occurs at subsaturating cGMP concentrations. Because the fast phase in 20 µM cGMP tracks faithfully the time course of current block in 2 mM cGMP, we conclude that the kinetics of current block by intracellular PhTx are not significantly influenced by cGMP concentration. The time courses of current recovery at low and high cGMP concentrations are similarly superimposable (Fig. 7 B). As for the kinetics of channel interaction with extracellular PhTx, we found that they, too, are virtually independent of cGMP concentration (Fig. 7, C and D).
Figure 7.
Voltage dependence of intracellular and extracellular PhTx block at saturating and subsaturating cGMP concentrations. (A) Normalized current transients elicited by stepping membrane voltage from −80 to 120 mV in the absence (top) or presence (bottom) of 0.3 µM of intracellular PhTx and of 2 mM (black) or 20 µM cGMP (blue; average of 20 consecutive traces from the same patch). The current in 20 µM cGMP is sevenfold smaller than that in 2 mM. (B) Normalized current transients, elicited by stepping membrane voltage from 120 to −80 mV, in the presence of 0.3 µM of intracellular PhTx and of 2 mM (black; average of five consecutive traces from the same patch) or 20 µM cGMP (blue; average of 10 consecutive traces from the same patch). (C) Normalized current transients elicited by stepping membrane voltage from 100 to −150 mV in the presence of 0.1 µM of extracellular PhTx and of 2 mM (black) or 20 µM cGMP (blue; average of 20 consecutive traces from the same patch). (D) Normalized current transients elicited by stepping membrane voltage from −200 to −50 mV in the presence of 0.1 µM of intracellular PhTx and of 2 mM (black) or 20 µM cGMP (blue; average of 20 consecutive traces from the same patch).
CNGA1 channel block by intracellular quaternary ammonium (QA) ions
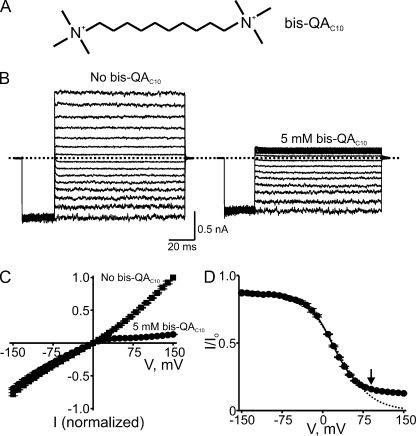
CNGA1 channels are blocked by millimolar concentrations of QAs from the intracellular but not extracellular side (Goulding et al., 1993; Stotz and Haynes, 1996; Contreras and Holmgren, 2006). Because QAs are generally too bulky to enter the narrow selectivity filter, the voltage sensitivity of their block of CNGA1 channels must arise indirectly, as it does when they block K+ channels (Armstrong, 1971; French and Shoukimas, 1981; Spassova and Lu, 1998; Shin and Lu, 2005; Xu et al., 2009). We examined the voltage dependence of CNGA1 block by a series of QAs to learn how it differs from block by PhTx. Using decane-bis-trimethylammonium (bis-QAC10; Fig. 8 A) as an example, we will first illustrate the basic properties of QA block.
Figure 8.
Voltage-dependent block by intracellular bis-QAC10. (A) Chemical structure of bis-QAC10. (B) Macroscopic current traces recorded from an inside-out patch containing CNGA1 channels in the absence or presence of 5 mM of intracellular bis-QAC10. Currents were elicited by first stepping the voltage from the 0-mV holding potential to −150 mV, and then testing voltages between −150 and 150 mV in 10-mV increments before returning to the holding potential. For clarity, only traces every 20 mV are shown. Dotted line indicates 0 current level. (C) I-V curves (mean ± SEM; n = 5) determined at the end of the test pulses in the absence or presence of 5 mM bis-QAC10. (D) Fraction of current not blocked (mean ± SEM; n = 5) by 5 mM bis-QAC10 is plotted against membrane voltage. The solid curve is a fit of Eq. 10 to the data from −150 to 90 mV (arrow) with KB1 = 3.17 ± 0.05 × 10⁻² M, KB2 = 2.23 ± 0.14 × 10⁻², KB2-Na = 2.67 ± 0.09 M−1, and Z = 1.11 ± 0.02. Dotted curve is a fit to the data from −150 to 90 mV (arrow) of a Boltzmann function (similar to Eq. 1, except for a nonunity asymptote at hyperpolarized potentials) with parameters appKd = 1.23 ± 0.08 × 10⁻² M and Z = 0.83 ± 0.03.
Fig. 8 B shows CNGA1 current records in the absence or presence of 5 mM of intracellular bis-QAC10, a molecule of the same length as spermine but with wider head groups. Like PhTx, bis-QAC10 blocks the channels in a voltage-dependent manner, rendering the I-V curve inwardly rectifying (Fig. 8 C). The fraction of current not blocked by 5 mM bis-QAC10 is plotted against voltage in Fig. 8 D. This blocking curve is superficially similar to that of PhTx in that it exhibits a voltage-independent blocking component at very negative voltages, followed by a voltage-dependent component. However, unlike that of PhTx, the blocking curve of bis-QAC10 does not proceed to completion at extreme positive voltages but reaches a voltage-independent plateau, i.e., it deviates markedly from a pure Boltzmann function.
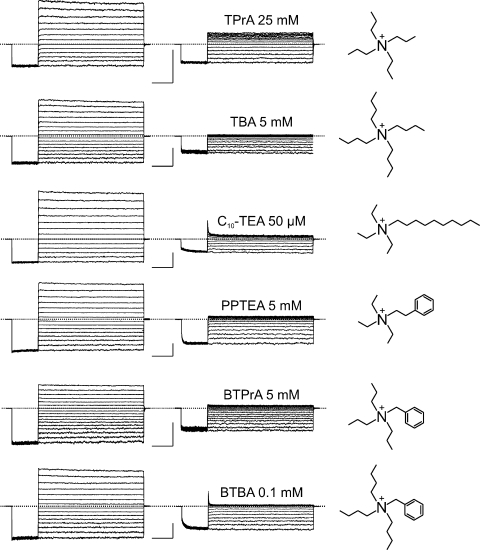
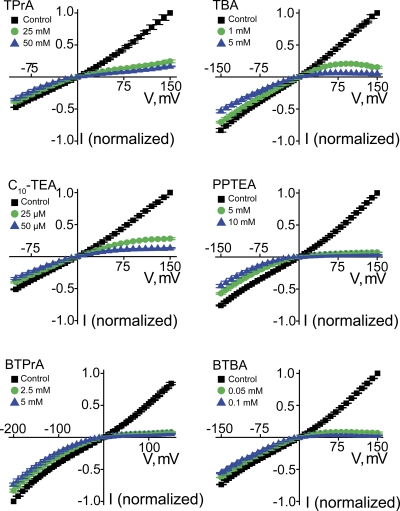
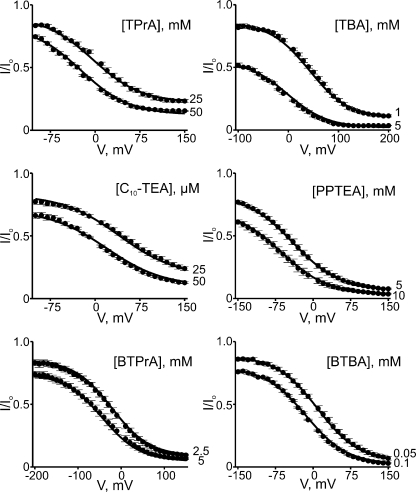
We tested six additional intracellular QA derivatives that cause voltage-dependent block (Fig. 9) and render the I-V curve inwardly rectifying (Fig. 10). Given that these QAs block CNGA1 channels with much lower affinity than PhTx, much higher concentrations of QAs must be used. Consequently, the time course of current block is barely or not resolvable (Figs. 8 and 9), depending on the concentration of the blockers (as well as their inherent second-order blocking rate constant). To further illustrate the voltage dependence of channel block, we plotted the fraction of current not blocked against voltage for all seven QAs (Figs. 11 and 12 A). These QAs differ in size, shape, and chemistry, exhibiting various affinities and somewhat differing voltage dependence. Despite their differences, the blocking curves for all seven QAs share a characteristic shape: they exhibit two voltage-independent blocking phases, one at extreme positive and one at extreme negative voltages, with an intervening voltage-dependent phase. Thus, QA blockers appear to create more than one blocked state.
Figure 9.
CNGA1 block by six intracellular QA compounds. Macroscopic currents recorded in the absence (left column) or presence (middle column) of the indicated blocker concentration. Bars, 1 nA and 20 ms. Chemical structures of the blockers are shown on the right.
Figure 10.
Intracellular QA blockers render current–voltage relations of CNGA1 channels inwardly rectifying. Mean I-V curves (mean ± SEM; n = 3–8) in the absence (control) or presence of six QAs, each at two concentrations.
Figure 11.
Voltage-dependent block by six intracellular QAs. Fraction of current not blocked (mean ± SEM; n = 3–8) plotted against voltage for six QAs, each at two concentrations. Curves were obtained by fitting Eq. 10 to the two datasets in each plot simultaneously. The resulting parameters are listed in Table I.
Figure 12.
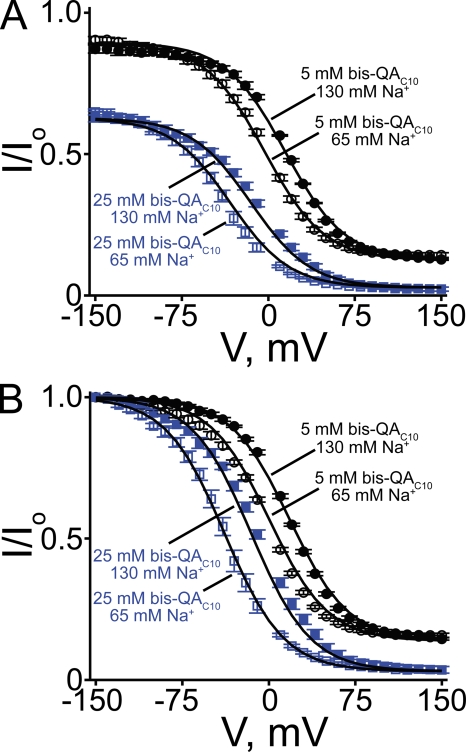
CNGA1 block by intracellular bis-QAC10 in 65 and 130 mM of symmetrical Na+. (A) The fraction of current not blocked (mean ± SEM; n = 4–7) in the presence of 65 mM (open symbols) and 130 mM (filled symbols) of symmetrical Na+ by 5 mM (black symbols) and 25 mM (blue symbols) bis-QAC10 is plotted against voltage. Curves were obtained by fitting Eq. 10 to the four datasets simultaneously. The resulting parameters are listed in Table I. (B) Data in A scaled to unity at −150 mV. Curves were obtained by fitting Eq. 7 to the four datasets simultaneously. The best-fit parameters were: KB = 7.97 ± 0.31 × 10⁻⁴ M, KB-Na = 8.97 ± 0.16 × 10⁻², and Z = 1.00 ± 0.01.
Again using bis-QAC10 as an example, we show that altering the permeant Na+ concentration affects only the voltage-dependent phase of the curve, not the two voltage-independent ones, whereas altering blocker concentration affects all three phases (Fig. 12 A).
DISCUSSION
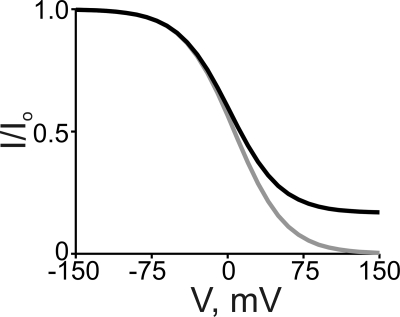
Two general model types have been proposed to account for the voltage dependence of ion channel block by charged blockers. One model assumes that the blocker itself traverses (a portion of) the transmembrane electric field to reach its binding site in the pore (Woodhull, 1973), and the voltage dependence is thus a property intrinsic to blocker binding. Characteristic of this intrinsic model is that the fraction of current not blocked (I/Io) by a nonpermeant blocker is described over the entire membrane voltage range by a single Boltzmann function. Thus, for a positively charged intracellular blocker (Fig. 13, gray curve):
| (1) |
where appKd is the apparent equilibrium dissociation constant for the blocker-binding reaction in the absence of a membrane potential, [B] is the concentration of blocker, Z is the effective valence (sometimes denoted as zδ), V is the membrane voltage, and F, R, and T have their usual meaning. As shown here, the voltage dependence of CNGA1 channel block by extracellular PhTx can be well accounted for by this type of mechanism, as equilibrium channel block varies with voltage from none to complete block according to single Boltzmann functions (Figs. 2 D and 5 B).
Figure 13.
Simulated curves of a Boltzmann function (gray curve) and of the three-state ion displacement model (black curve), both for the case of a positively charged intracellular blocker. The Boltzmann curve was generated from Eq. 1 with [B] = 5 mM, appKd = 6.5 mM, and Z = 1. The black curve was generated from Eq. 7 with [B] = 5 mM, [Na+] = 130 mM, KB = 1 mM, KB-Na = 0.05, and Z = 1.
The other model posits that the blocker itself does not bind within the electric field, but that the apparent voltage dependence reflects phenomena extrinsic to blocker binding per se, namely, displacement by the blocker of permeant ions across the field (Armstrong, 1971). We show below that block by intracellular QAs too bulky to enter the channel’s selectivity filter (Goulding et al., 1993) is entirely accounted for by the extrinsic model. A prediction of this ion displacement model is that the voltage dependence of blocker–channel interaction should vanish if permeant ions were removed, a prediction not testable electrophysiologically because removing all permeant ions would abolish current. Fortunately, an alternative approach exists, as argued with the following example. According to the model, an intracellular cationic blocker binds at a site, outside the field, normally occupied by a permeant cation about to enter the electric field. Increasingly, strong depolarizations will lower the permeant ion occupancy of that site until eventually a blocker could occupy it without encountering and displacing a permeant ion. In the limit when blocker binding is no longer coupled to the movement of permeant ions, channel block must lose its extrinsic voltage dependence. As a consequence, the blocking curve characteristically deviates from a pure Boltzmann function at extreme positive voltages to reach a nonzero current plateau (Fig. 13, black curve). We now proceed to a quantitative examination of these two types of voltage-dependent block using PhTx and QAs as examples.
Analysis of PhTx block with the intrinsic voltage dependence model
PhTx blocks the channel from either side of the membrane in a strongly voltage-dependent manner (Figs. 2 and 5). The voltage-dependent blocking curves for extracellular (Fig. 2) or intracellular PhTx (Fig. 5) are well described by true Boltzmann functions, so that current vanishes completely at sufficiently strong potentials of the polarity that favors blocker binding. Such behavior is expected for a blocker that binds within the electric field.
In kinetic terms, block by extracellular PhTx (Figs. 2–4) appears at first sight to be a simple one-step bimolecular reaction. Although voltage jump–induced blocking and unblocking transients follow single-exponential time courses, the ratio koff/kon at 0 mV is only 34% of the apparent equilibrium dissociation constant appKd (0 mV), and zon + zoff is 75% of the effective valence of the voltage-sensitive apparent equilibrium appKd. Additionally, the voltage dependence associated with appKd is entirely attributable to koff, whereas kon is essentially voltage independent. As we will discuss below, these phenomena betray more complex kinetics.
The characteristics of CNGA1 block by intracellular PhTx are similar to those of block by extracellular PhTx. As in the case of block by extracellular PhTx, the sum of zoff (1.60) and zon (0.23) from kinetic measurements of intracellular PhTx block is also noticeably smaller than the Z value (2.67) obtained at equilibrium. This discrepancy indicates that the blocking process is not a one-step bimolecular reaction. At least one additional transition must exist, which we have not been able to measure directly. For example, there may be a blocked state with such low affinity that it is insignificantly populated at the blocker concentrations we used. Higher PhTx concentrations might reveal a potential low affinity state, but this is impractical given the high cost of PhTx. An alternative approach is to raise the apparent blocker affinity by lowering the permeant ion concentration to reduce competition and/or trans knock-off by permeant ions (Armstrong and Binstock, 1965). Having lowered the Na+ concentration on both sides of the membrane from 130 to 30 mM, we find that at negative potentials (which minimize intrinsic voltage-sensitive blocker binding), PhTx indeed blocks current in a dose-dependent but voltage-independent manner (Fig. 6, A and B). Therefore, binding of intracellular PhTx to the channel evidently produces at least two blocked states: a voltage-dependent state plus a voltage-independent state.
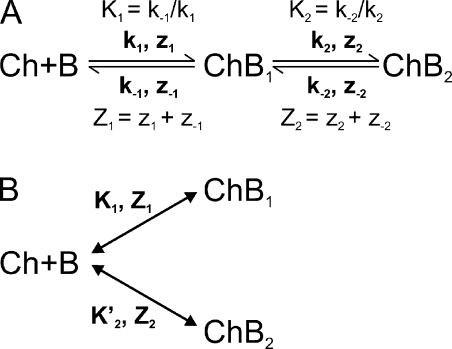
The two blocked states (ChB1 and ChB2) could in principle be formed via either sequential or parallel transitions (Fig. 14, A or B). For either model, the fraction of current not blocked is given by the ratio of the nonblocked state to the sum of all states:
| (2) |
Figure 14.
Models for multistate channel block. Binding of a blocker denoted as “B” to a channel (Ch) produces two blocked states (ChB1 and ChB2) in sequential (A) or parallel (B) steps. Kx are equilibrium constants with effective valences Zx; kx are rate constants and zx their effective valences.
For the sequential model (Fig. 14 A), the equilibrium constants in the absence of an electric field are defined as K1 = [Ch][B]/[ChB1] and K2 = [ChB1]/[ChB2]. In the presence of an applied electric field, the fraction of current not blocked is then given by:
| (3) |
where Z1 and Z2 are the effective valences associated with K1 and K2, respectively. For the parallel model (Fig. 14 B), the fraction of current not blocked is given by:
| (4) |
where K1 = [Ch][B]/[ChB1], K’2 = [Ch][B]/[ChB2]. Eqs. 3 and 4 are of identical form, but K2 in the sequential model (Eq. 3) and K’2 in the parallel model (Eq. 4) have different physical meanings. The ΔG of the blocked states with respect to the unblocked state is ΔGChB2 = −RT × ln (K1K2) for the sequential model and ΔGChB2 = −RT × ln K’2 in the parallel model; for both models, ΔGChB1 = −RT × ln K1. As discussed in the next section, a sequential model has important practical implications for attempts to deduce channel gate properties from channel block kinetics. For this reason, we will discuss in detail the sequential two-step model as we analyze block by intracellular PhTx (under low Na+ conditions to reveal the low affinity blocker-binding step).
A blocker is likely to transiently contact parts of the pore with some affinity on its way to the energetically most stable site. That is, a realistic blocking scheme likely consists of sequential interactions (regardless of whether there are additional parallel blocking transitions). In principle, the first blocked state may reflect the engagement of a blocker with a part of the pore as shallow at its innermost (or outermost) end. Indeed, as previously demonstrated with inward-rectifier K+ channels (Shin and Lu, 2005; Shin et al., 2005; Xu et al., 2009), a sequential model is physically plausible given the significant depth of ion channel pores.
We fitted the steady-state blocking curves in Fig. 6 B with Eq. 3 to obtain equilibrium constants K1 = 1.04 ± 0.03 × 10⁻⁵ M and K2 = 2.03 ± 0.14 × 10⁻³, and valence Z2 = 2.08 ± 0.04. Z1 was set to 0 because formation of the first (shallow) blocked state is of little voltage sensitivity (witness the voltage-insensitive but dose-dependent asymptotes at extreme negative voltages). As for the individual rate constants at 0 mV, analysis of the blocking and unblocking kinetics (Fig. 6, D and E) yields kon = 8.42 × 10⁸ M−1s−1 with zon = 0.14, and koff = 27 s−1 with zoff = 1.10. As a first approximation, the experimental blocking rate kon primarily reflects k1 in the model (and thus z1 = zon), and the model’s k–1 can then be calculated as K1k1 = 8.76 × 10³ s−1. This value of k–1 is ∼300-fold larger than the experimental unblocking rate koff. The latter must therefore approximate the model’s OFF-rate–limiting k–2 (and zoff must approximate z–2). Finally, we can estimate the model’s k2 as k–2/K2 = 1.33 × 10⁴ s−1 with z2 as Z2 − z–2 = 0.98. Our kinetic analysis in terms of a sequential two-step blocking model shows that most of the voltage sensitivity of channel block by intracellular PhTx resides in the transition between the two blocked states, with k2 and k–2 exhibiting comparable voltage dependence.
According to Eq. 3 derived for the sequential two-step blocking model, the apparent equilibrium constant at 0 mV is given by:
| (5) |
Because in the present example k–2 (= 27 s−1) ≪ k2 (= 1.3 × 10⁴ s−1), appKd reduces to
| (6) |
and because in this instance the values of k–1 and k2 differ by less than twofold, appKd is approximately equal to k–2/k1. As current is blocked from the instant the first blocked state is reached, k1 must effectively determine the experimental ON rate of channel block. Given the low PhTx concentrations we used, the pseudo first-order rate constants k1[B] were resolvable by our recording system. As for k–2, we saw above that it is vastly slower than k–1 in this example; therefore, it effectively determines the experimental OFF rate for recovery from PhTx block. The finding that in this instance the equilibrium appKd approximates the experimental koff/kon ratio is then merely a coincidence and, by no means, indicative of a one-step process. A clear indication that the blocking reaction involves more than one step is the discrepancy between the equilibrium valence, Z, and the sum of the valences zon and zoff associated with kinetic constants kon and koff. Not only for intracellular, but also in the case of extracellular PhTx block, is experimental koff voltage dependent and kon independent. Within the theoretical framework of a simple one-step blocking model, almost the entire voltage dependence of equilibrium block would have to be attributed to the sole dissociation reaction—an unlikely scheme. In the sequential two-step model, however, blocker binding to and unbinding from the first (shallow) site are voltage insensitive, but the transitions to and from the deep site are sensitive in such a manner that the voltage dependence is nearly evenly allocated between the forward and backward reactions—a physically more plausible scheme. Even though experimental demonstration has thus far succeeded only for intracellular PhTx, it is likely that extracellular PhTx also interacts with the channel in more than one step as it penetrates into the selectivity filter.
Implications of a sequential blocking mechanism for attempts to probe channel gating by analyzing blocking kinetics
Mindful of the possibility that channel-blocking kinetics encompass several binding steps, we now examine how the existence of multiple, sequential blocked states may preclude inferences being drawn regarding channel-gating behavior from the dependence of blocking kinetics on channel open probability. The apparent rate of channel inhibition caused by the binding of an open-channel blocker (or by, for example, a cysteine residue modifier) that travels through the channel gate region is expected to vary with the gating state. Such variation has been successfully exploited to delineate the channel gate, e.g., in voltage-gated K+ channels (Liu et al., 1997). To our surprise, the apparent rate of channel block by either extracellular or intracellular PhTx exhibits little dependence on channel open probability, even though block is strongly voltage dependent in both cases. This unexpected finding may help us stipulate the necessary conditions under which properties of the channel gate may be inferred from the dependence of blocking kinetics on gating status.
Kinetics of CNGA1 channel block or unblock are essentially unaltered by lowering the cGMP concentration from 2 mM (saturating) to 20 µM (Fig. 7). This holds for both extracellular and intracellular PhTx. There are two possible explanations for these unexpected results. One possibility is that the gate location, e.g., in the selectivity filter (Sun et al., 1996; Bucossi et al., 1997; Becchetti et al., 1999; Becchetti and Roncaglia, 2000; Liu and Siegelbaum, 2000; Flynn and Zagotta, 2001; Contreras et al., 2008), is inaccessible to PhTx from either side of the membrane. This would mean, in the present example, that the ∼20-Å long spermine portion of the PhTx molecule cannot reach deep into the ∼12-Å long filter, even though spermine itself readily permeates the channel from either direction. This possibility appears unlikely.
Alternatively, constancy of the apparent channel-blocking rate regardless of ligand concentration may reflect the fact that the rate-limiting transition in the PhTx-blocking sequence is not affected by channel gating. In the initial step of the blocking sequence, PhTx associates with the channel, docking at a site which may, in principle, be as shallow as the innermost part of the pore. It then travels deeper along the pore to form an additional blocked state (or more). If a gate were located between the shallow and the deep sites (or at the deep site), formation of only the deep, not the shallow, blocked state would depend on the gate’s open probability. The second-order rate constant for PhTx associating with the channel to form the first blocked state is very large and arguably near diffusion limited: kon = 8.42 × 10⁸ M−1s−1 in symmetric 30 mM Na+ or 4.23 × 10⁷ M−1s−1 in 130 mM Na+. However, because we used very low PhTx concentrations to achieve experimentally resolvable ON rates, the resulting pseudo first-order rate constant (k1[PhTx]) for formation of the first blocked state in fact became rate limiting, being much lower than the (first-order) rate constant k2 for PhTx transit from the shallow to the deep binding site. As a result, any gating effect on k2 would be obscured. Although k2 might well be sensitive to the gating state, the reverse rate constant k–2 clearly (in the present example) is not because recovery from PhTx block, which is rate limited by k–2 (see above), is insensitive to cGMP concentration. Now, if only k2 is gating sensitive and k–2 is not, this sensitivity will still be reflected in K2 (Fig. 14 A). Indeed, lowering cGMP from 2 mM to 20 µM, which decreases the macroscopic current (that is, Po) by 8.6 ± 1.2–fold (n = 8), causes a 7.5-fold increase in K2 for PhTx block (Fig. 6 C). Therefore, insensitivity of the apparent PhTx-blocking rate to cGMP concentration may simply be a consequence of the multistep character of channel block. In any case, whereas probing the gate by examining the kinetics of channel block (or cysteine modification) is conceptually straightforward for a single-step blocking reaction, this approach is possible for a reaction involving multiple sequential steps only if the observed effect is rate limited by a gating-dependent transition. The mere demonstration that a second-order association rate constant kon is (nearly) diffusion limited does not ensure that the association step is not in fact rate limiting under the actual experimental conditions.
Analysis of QA block with the extrinsic voltage dependence model
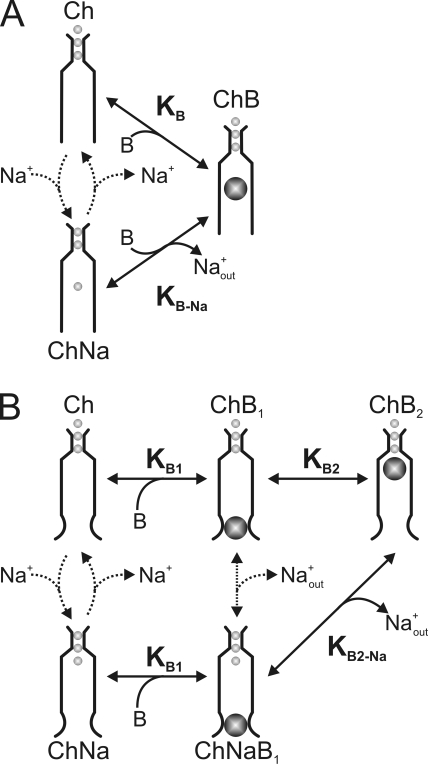
We next discuss extrinsic voltage dependence of channel block by QAs in the framework of an ion displacement model. The most economical version of this model exhibiting the features described in Results (Figs. 8–12) considers three states: one blocked plus two states of the ion conduction cycle that are blocker free (Fig. 15 A). In this model, the narrow external part of the channel (Ch) can only be occupied by permeant ions, whereas the wide internal part can accommodate either a permeant (e.g., Na+) or a blocking (B) ion. The transmembrane electric field exists exclusively across the narrow part of the pore. The two states of the steady-state Na+ conduction cycle are represented on the left. Extracellular, but not intracellular, Na+ must traverse the narrow part of the pore to reach the internal site in a process that is voltage sensitive. The upper blocking transition is voltage independent as the empty blocker site is outside the field. The left and upper transitions together represent competition between Na+ and intracellular blocker for the internal site. In the limit when the empty species (Ch) vanishes and Na+ and blocker move in a concerted manner, these two processes collapse into a single (electrostatic) displacement reaction as described by the lower transition. This “concerted” blocking transition is voltage sensitive as the blocker site is already occupied by a permeant Na+ ion that must then enter the field.
Figure 15.
Ion displacement models for channel block. (A) Minimal three-state ion displacement model for voltage-dependent block. The transmembrane voltage drops exclusively across the narrow part of the pore that can only be occupied by permeant ions. The number of permeant ions in the selectivity filter is inconsequential to the model, and the number of ions in the inner pore is set at the minimum of one. The channel can exist in two nonblocked states with (ChNa) or without (Ch) a permeant Na+ ion at the inner pore site (internal to the narrow selectivity filter) and one blocked state (ChB). The upper blocking transition is voltage independent as the blocker binds in the empty inner pore with equilibrium constant KB, whereas the lower transition (equilibrium constant KB-Na) is voltage dependent as the blocker displaces the Na+ ion. (B) Ion displacement model with sequential blocking steps. The two leftmost nonblocked states are equivalent to those of the minimal three-state model in A, with (ChNa) and without (Ch) a Na+ ion in the inner pore. The blocker may bind (common equilibrium constant KB1) to the shallow site of either nonblocked form. It then binds at the deep binding site (ChB2). The transition that involves Na+ displacement is characterized by KB2-Na and is voltage dependent, whereas the one that does not involve Na+ displacement is characterized by KB2 and is voltage independent.
For this simple three-state model, the fraction of current not blocked is given by:
| (7) |
The apparent equilibrium blocker dissociation constant is
| (7.1) |
where the equilibrium constants for the blocker-binding transitions without and with concomitant Na+ displacement are KB = [Ch][B]/[ChB] and KB-Na = [ChNa][B]/([ChB][Na+]), respectively (Spassova and Lu, 1998). Eq. 7.1 parses how the two blocking transitions contribute to the overall blocking process, for the experimentally simplest case where the Na+ concentrations on both sides of the membrane are equal.
At sufficiently hyperpolarized voltages where [Na+] >> KB, Eq. 7 reduces to:
| (8) |
an equation dominated by the voltage-dependent blocking transition that involves Na+ displacement. Conversely, at highly depolarized potentials, approaches 0 and Eq. 7 reduces to
| (9) |
which describes voltage-insensitive block not accompanied by Na+ displacement. Eq. 9 accounts for the voltage-independent plateau at depolarized potentials whose amplitude varies with blocker concentration. Indeed, the blocking curve for all seven intracellular QAs tested becomes voltage independent at strongly depolarized potentials. Using bis-QAC10 as an example, we show below that this ion displacement model accounts well for channel block by QAs that are too bulky to enter the selectivity filter (compare Huang et al., 2000).
As shown in Fig. 8 D for bis-QAC10, the blocking curve clearly deviates from a Boltzmann function (dotted curve) at depolarized potentials but is well fitted by the ion displacement model (solid curve). As already discussed for PhTx, the voltage-insensitive block at very negative potentials points to an additional blocked state. A detailed treatment of this additional blocked state will be presented in the next section. To limit the present discussion to the properties of a three-state ion displacement model, we simply scaled the fraction of current not blocked at hyperpolarized potentials (Fig. 12 A) to unity (Fig. 12 B). Eq. 7 derived for our three-state model makes the following experimental prediction: increasing the blocker concentration would not only shift the blocking curve to the left but also lower the plateau seen at positive potentials. This is consistent with our experimental observations (Fig. 12 B; compare black with blue symbols). Mathematically, at higher blocker concentrations, half-maximal block will occur at a lower voltage (Eq. 7) and, consequently, the blocking curve shifts leftward. Thermodynamically, the total energy needed to achieve a given amount of block remains unchanged, and thus the relative energy contribution of electric or chemical origin varies reciprocally. At highly depolarized potentials, Eq. 7 reduces to Eq. 9, meaning that the extent of channel block in this voltage range is independent of voltage and determined solely by the blocker concentration. Therefore, the plateau of the blocking curve at very depolarized potentials decreases with increasing blocker concentration. These predictions make intuitive sense in that strong depolarization reduces the permeant ion occupancy at the shared site, so the blocker will be able to occupy the site without the need to displace permeant Na+. In the limit, binding becomes a standard bimolecular chemical reaction, where the extent of block increases with blocker concentration.
Another prediction is that decreasing the permeant ion concentration will shift the blocking curve leftward without affecting the plateau level at positive potentials, as in fact we observed when we lowered the Na+ concentration from 130 to 65 mM (Fig. 12 B; compare filled with open symbols). Eq. 7 shows that for a given blocker concentration, at lower Na+ concentrations lower voltage suffices to produce 50% block because less electric energy is needed to generate the same probability of vacancy for the blocker. It follows that block of a channel with lower affinity for permeant ions should lose its extrinsic voltage dependence at lower voltages. Eq. 9, on the other hand, indicates that the extent of channel block at extreme positive potentials is independent of Na+ concentration because at sufficiently strong depolarization, Na+ occupancy will vanish.
Ion displacement model with sequential blocked states for QA block
When we analyzed (in the above section) intracellular QA block in the framework of an ion displacement model, we deferred discussion of voltage-independent block at very negative potentials. To account for that additional feature, we now extend the ion displacement model to include a sequential blocking scheme, analogous to the one we formulated for PhTx (Fig. 15 B). Inserting an extra blocked state in each of the two blocking transitions raises the number of states in the model to five. The additional blocked states ChB1 and ChNaB1 represent a blocker bound at a shallow site without and with a Na+ at the deep site, respectively. For simplicity, we assume that the equilibrium between the shallow blocked state and the unblocked state is characterized by the same equilibrium dissociation constant KB1. KB2-Na and KB2 are the equilibrium constants for the two subsequent transitions to the deep blocked state (ChB2) with and without Na+ displacement, respectively. For this five-state model, the fraction of current not blocked is given by:
| (10) |
The equilibrium constant for blocker binding to the shallow site is:
| (11) |
Blocker movement between the shallow and the deep site is governed by:
| (12) |
for blocker partition to the empty deep site and
| (13) |
for blocker binding to the deep site occupied by Na+. The latter step, which displaces Na+, is the only one assumed to be voltage dependent; this is accounted for by the exponential term in Eq. 10.
At sufficiently hyperpolarized voltages where
approaches 0, Eq. 10 reduces to a simple voltage-independent blocking mechanism:
| (14) |
Eq. 14 accounts for voltage-independent block at hyperpolarized potentials. At these potentials, the block primarily involves the two left horizontal transitions, and the fraction of current not blocked is a function of blocker concentration.
At extreme positive voltages, the term
approaches 0 and Eq. 10 reduces to
| (15) |
where the block again becomes voltage independent. At depolarized potentials, the block primarily involves the two upper transitions, and Eq. 15 thus contains both KB1 and KB2. The curves superimposed on the blocking curves of all seven QAs (Figs. 8 D, 11, and 12 A) are fits of Eq. 10 (all resulting parameters are listed in Table I). Thus, the five-state model fully accounts for QA block.
Table I.
Five-state ion displacement model parameters for QA block
| Z | KB1 | KB2 | KB2-Na | |
| (M) | (M−1) | |||
| TPrA | 0.63 ± 0.03 | 2.49 ± 0.36 × 10⁻¹ | 2.93 ± 0.53 × 10⁻² | 0.84 ± 0.15 |
| TBA | 0.65 ± 0.03 | 6.12 ± 0.38 × 10⁻³ | 1.72 ± 0.27 × 10⁻² | 3.50 ± 0.40 |
| C10-TEA | 0.54 ± 0.03 | 1.24 ± 0.01 × 10⁻⁴ | 4.75 ± 0.89 × 10⁻² | 3.95 ± 0.51 |
| PPTEA | 0.55 ± 0.01 | 2.38 ± 0.01 × 10⁻² | 1.49 ± 0.10 × 10⁻² | 0.61 ± 0.02 |
| BTPrA | 0.58 ± 0.01 | 1.44 ± 0.04 × 10⁻² | 1.70 ± 0.16 × 10⁻² | 0.77 ± 0.03 |
| BTBA | 0.62 ± 0.01 | 3.87 ± 0.12 × 10⁻⁴ | 5.88 ± 0.84 × 10⁻³ | 1.16 ± 0.04 |
| Bis-QAC10 | 0.99 ± 0.02 | 4.21 ± 0.07 × 10⁻² | 1.72 ± 0.01 × 10⁻² | 1.67 ± 0.05 |
Best-fit parameters of Eq. 10.
A brief comment is in order regarding how an additional, shallow blocking site may affect extrinsic voltage dependence of channel block. Recall that a reduction in ion occupancy due to a lowered permeant ion concentration shifts the voltage-dependent blocking curve in the hyperpolarized direction. Consequently, the blocking process loses its apparent voltage dependence at less depolarized potentials (Fig. 12). As explained below, this phenomenon can also be caused by the binding of a blocker at the shallow site. Blocker binding at the shallow site (not shared with permeant ions) would prevent intracellular ions from accessing the deep site (shared by both permeant ions and blocker) (Fig. 15 B). In this case, refilling the deep site with permeant ions from the intracellular side would no longer be possible. In addition, at very depolarized potentials, the deep site could not be effectively refilled from the extracellular side because depolarization decreases the probability of extracellular ions moving across the selectivity filter to reach the site. Thus, the existence of a shallow blocking site could lower the permeant ion occupancy of the deep site, causing the extrinsic voltage sensitivity to vanish at less depolarized potentials.
In conclusion, given that an ion channel pore has considerable depth, a blocker likely blocks the pore in sequential steps. Experimentally, at appropriate blocker concentrations, association with the shallow site may be the rate-limiting step of current block, even if the steady-state occupancy of that site is negligible. Consequently, a sequential binding mechanism could preclude inferences being drawn regarding channel-gating behavior from the dependence of blocking kinetics on channel open probability. Penetration of blocker into the pore can exhibit voltage sensitivity in two possible ways with experimentally distinguishable characteristics. In one case, the charged blocker itself enters the transmembrane electric field (with and without displacing permeant ions), and the observed voltage sensitivity is an intrinsic property of the blocker. Such voltage sensitivity arising from a direct interaction of the charged blocker with the electric field follows a Boltzmann function. Alternatively, the blocker does not bind within the electric field, and its binding indirectly derives voltage sensitivity solely from the concurrent movement of permeant ions across the electric field. Such acquired voltage sensitivity vanishes at voltages where displaceable permeant ions no longer occupy the blocker binding site, and therefore does not follow a Boltzmann function. This striking feature is the electrophysiological hallmark of the extrinsic type of voltage-dependent ion channel block.
Acknowledgments
We thank S. Siegelbaum for the CNGA1 channel cDNA clone, C. Armstrong for C10-TEA, and P. De Weer for critical review and discussion of our manuscript.
This study was supported by a grant (GM55560) from the National Institutes of Health. Z. Lu is an investigator of the Howard Hughes Medical Institute.
Christopher Miller served as editor.
Footnotes
Abbreviations used in this paper:
- bis-QAC10
- decane-bis-trimethylammonium
- PhTx
- philanthotoxin
- QA
- quaternary ammonium
References
- Armstrong C.M. 1971. Interaction of tetraethylammonium ion derivatives with the potassium channels of giant axons. J. Gen. Physiol. 58:413–437 10.1085/jgp.58.4.413 [DOI] [PMC free article] [PubMed] [Google Scholar]
- Armstrong C.M., Binstock L. 1965. Anomalous rectification in the squid giant axon with tetraethylammonium chloride. J. Gen. Physiol. 48:859–872 10.1085/jgp.48.5.859 [DOI] [PMC free article] [PubMed] [Google Scholar]
- Bähring R., Bowie D., Benveniste M., Mayer M.L. 1997. Permeation and block of rat GluR6 glutamate receptor channels by internal and external polyamines. J. Physiol. 502:575–589 10.1111/j.1469-7793.1997.575bj.x [DOI] [PMC free article] [PubMed] [Google Scholar]
- Becchetti A., Roncaglia P. 2000. Cyclic nucleotide-gated channels: intra- and extracellular accessibility to Cd2+ of substituted cysteine residues within the P-loop. PflÜgers Arch. 440:556–565 [DOI] [PubMed] [Google Scholar]
- Becchetti A., Gamel K., Torre V. 1999. Cyclic nucleotide-gated channels. Pore topology studied through the accessibility of reporter cysteines. J. Gen. Physiol. 114:377–392 [DOI] [PMC free article] [PubMed] [Google Scholar]
- Benndorf K., Koopmann R., Eismann E., Kaupp U.B. 1999. Gating by cyclic GMP and voltage in the α subunit of the cyclic GMP-gated channel from rod photoreceptors. J. Gen. Physiol. 114:477–490 [DOI] [PMC free article] [PubMed] [Google Scholar]
- Blatz A.L., Magleby K.L. 1984. Ion conductance and selectivity of single calcium-activated potassium channels in cultured rat muscle. J. Gen. Physiol. 84:1–23 10.1085/jgp.84.1.1 [DOI] [PMC free article] [PubMed] [Google Scholar]
- Blaustein R.O., Finkelstein A. 1990. Voltage-dependent block of anthrax toxin channels in planar phospholipid bilayer membranes by symmetric tetraalkylammonium ions. Effects on macroscopic conductance. J. Gen. Physiol. 96:905–919 10.1085/jgp.96.5.905 [DOI] [PMC free article] [PubMed] [Google Scholar]
- Bräu M.E., Dreimann M., Olschewski A., Vogel W., Hempelmann G. 2001. Effect of drugs used for neuropathic pain management on tetrodotoxin-resistant Na+ currents in rat sensory neurons. Anesthesiology. 94:137–144 10.1097/00000542-200101000-00024 [DOI] [PubMed] [Google Scholar]
- Bucossi G., Nizzari M., Torre V. 1997. Single-channel properties of ionic channels gated by cyclic nucleotides. Biophys. J. 72:1165–1181 [DOI] [PMC free article] [PubMed] [Google Scholar]
- Carmeliet E., Mubagwa K. 1998. Antiarrhythmic drugs and cardiac ion channels: mechanisms of action. Prog. Biophys. Mol. Biol. 70:1–72 10.1016/S0079-6107(98)00002-9 [DOI] [PubMed] [Google Scholar]
- Colamartino G., Menini A., Torre V. 1991. Blockage and permeation of divalent cations through the cyclic GMP-activated channel from tiger salamander retinal rods. J. Physiol. 440:189–206 [DOI] [PMC free article] [PubMed] [Google Scholar]
- Contreras J.E., Holmgren M. 2006. Access of quaternary ammonium blockers to the internal pore of cyclic nucleotide–gated channels: implications for the location of the gate. J. Gen. Physiol. 127:481–494 10.1085/jgp.200509440 [DOI] [PMC free article] [PubMed] [Google Scholar]
- Contreras J.E., Srikumar D., Holmgren M. 2008. Gating at the selectivity filter in cyclic nucleotide-gated channels. Proc. Natl. Acad. Sci. USA. 105:3310–3314 10.1073/pnas.0709809105 [DOI] [PMC free article] [PubMed] [Google Scholar]
- Coronado R., Miller C. 1979. Voltage-dependent caesium blockade of a cation channel from fragmented sarcoplasmic reticulum. Nature. 280:807–810 10.1038/280807a0 [DOI] [Google Scholar]
- Eismann E., Müller F., Heinemann S.H., Kaupp U.B. 1994. A single negative charge within the pore region of a cGMP-gated channel controls rectification, Ca2+ blockage, and ionic selectivity. Proc. Natl. Acad. Sci. USA. 91:1109–1113 10.1073/pnas.91.3.1109 [DOI] [PMC free article] [PubMed] [Google Scholar]
- Flynn G.E., Zagotta W.N. 2001. Conformational changes in S6 coupled to the opening of cyclic nucleotide-gated channels. Neuron. 30:689–698 10.1016/S0896-6273(01)00324-5 [DOI] [PubMed] [Google Scholar]
- French R.J., Shoukimas J.J. 1981. Blockage of squid axon potassium conductance by internal tetra-N-alkylammonium ions of various sizes. Biophys. J. 34:271–291 10.1016/S0006-3495(81)84849-7 [DOI] [PMC free article] [PubMed] [Google Scholar]
- Goulding E.H., Tibbs G.R., Liu D., Siegelbaum S.A. 1993. Role of H5 domain in determining pore diameter and ion permeation through cyclic nucleotide-gated channels. Nature. 364:61–64 10.1038/364061a0 [DOI] [PubMed] [Google Scholar]
- Goulding E.H., Tibbs G.R., Siegelbaum S.A. 1994. Molecular mechanism of cyclic-nucleotide-gated channel activation. Nature. 372:369–374 10.1038/372369a0 [DOI] [PubMed] [Google Scholar]
- Guo D., Lu Z. 2000. Mechanism of cGMP-gated channel block by intracellular polyamines. J. Gen. Physiol. 115:783–798 10.1085/jgp.115.6.783 [DOI] [PMC free article] [PubMed] [Google Scholar]
- Guo D., Ramu Y., Klem A.M., Lu Z. 2003. Mechanism of rectification in inward-rectifier K+ channels. J. Gen. Physiol. 121:261–275 10.1085/jgp.200208771 [DOI] [PMC free article] [PubMed] [Google Scholar]
- Hagiwara S., Miyazaki S., Moody W., Patlak J. 1978. Blocking effects of barium and hydrogen ions on the potassium current during anomalous rectification in the starfish egg. J. Physiol. 279:167–185 [DOI] [PMC free article] [PubMed] [Google Scholar]
- Hille B. 2001. Ion Channels of Excitable Membranes. 3rd ed Sinauer Associates, Sunderland, MA: 814 pp [Google Scholar]
- Hille B., Schwarz W. 1978. Potassium channels as multi-ion single-file pores. J. Gen. Physiol. 72:409–442 10.1085/jgp.72.4.409 [DOI] [PMC free article] [PubMed] [Google Scholar]
- Huang C.-J., Favre I., Moczydlowski E. 2000. Permeation of large tetra-alkylammonium cations through mutant and wild-type voltage-gated sodium channels as revealed by relief of block at high voltage. J. Gen. Physiol. 115:435–454 10.1085/jgp.115.4.435 [DOI] [PMC free article] [PubMed] [Google Scholar]
- Kaupp U.B., Niidome T., Tanabe T., Terada S., Bönigk W., StÜhmer W., Cook N.J., Kangawa K., Matsuo H., Hirose T., et al. 1989. Primary structure and functional expression from complementary DNA of the rod photoreceptor cyclic GMP-gated channel. Nature. 342:762–766 10.1038/342762a0 [DOI] [PubMed] [Google Scholar]
- Keating M.T., Sanguinetti M.C. 2001. Molecular and cellular mechanisms of cardiac arrhythmias. Cell. 104:569–580 10.1016/S0092-8674(01)00243-4 [DOI] [PubMed] [Google Scholar]
- Kutluay E., Roux B., Heginbotham L. 2005. Rapid intracellular TEA block of the KcsA potassium channel. Biophys. J. 88:1018–1029 10.1529/biophysj.104.052043 [DOI] [PMC free article] [PubMed] [Google Scholar]
- Liman E.R., Tytgat J., Hess P. 1992. Subunit stoichiometry of a mammalian K+ channel determined by construction of multimeric cDNAs. Neuron. 9:861–871 10.1016/0896-6273(92)90239-A [DOI] [PubMed] [Google Scholar]
- Liu J., Siegelbaum S.A. 2000. Change of pore helix conformational state upon opening of cyclic nucleotide-gated channels. Neuron. 28:899–909 10.1016/S0896-6273(00)00162-8 [DOI] [PubMed] [Google Scholar]
- Liu Y., Holmgren M., Jurman M.E., Yellen G. 1997. Gated access to the pore of a voltage-dependent K+ channel. Neuron. 19:175–184 10.1016/S0896-6273(00)80357-8 [DOI] [PubMed] [Google Scholar]
- Lu Z., Ding L. 1999. Blockade of a retinal cGMP-gated channel by polyamines. J. Gen. Physiol. 113:35–43 10.1085/jgp.113.1.35 [DOI] [PMC free article] [PubMed] [Google Scholar]
- Lynch J.W. 1999. Rectification of the olfactory cyclic nucleotide-gated channel by intracellular polyamines. J. Membr. Biol. 170:213–227 10.1007/s002329900551 [DOI] [PubMed] [Google Scholar]
- Macdonald R.L., Kelly K.M. 1995. Antiepileptic drug mechanisms of action. Epilepsia. 36:S2–S12 10.1111/j.1528-1157.1995.tb05996.x [DOI] [PubMed] [Google Scholar]
- MacKinnon R., Miller C. 1988. Mechanism of charybdotoxin block of the high-conductance, Ca2+-activated K+ channel. J. Gen. Physiol. 91:335–349 10.1085/jgp.91.3.335 [DOI] [PMC free article] [PubMed] [Google Scholar]
- Martínez-François J.R., Xu Y., Lu Z. 2009. Mutations reveal voltage gating of CNGA1 channels in saturating cGMP. J. Gen. Physiol. 134:151–164 10.1085/jgp.200910240 [DOI] [PMC free article] [PubMed] [Google Scholar]
- Mayer M.L., Westbrook G.L. 1987. Permeation and block of N-methyl-D-aspartic acid receptor channels by divalent cations in mouse cultured central neurones. J. Physiol. 394:501–527 [DOI] [PMC free article] [PubMed] [Google Scholar]
- Neher E., Steinbach J.H. 1978. Local anaesthetics transiently block currents through single acetylcholine-receptor channels. J. Physiol. 277:153–176 [DOI] [PMC free article] [PubMed] [Google Scholar]
- Nevin S.T., Haddrill J.L., Lynch J.W. 2000. A pore-lining glutamic acid in the rat olfactory cyclic nucleotide-gated channel controls external spermine block. Neurosci. Lett. 296:163–167 10.1016/S0304-3940(00)01650-5 [DOI] [PubMed] [Google Scholar]
- Neyton J., Miller C. 1988. Potassium blocks barium permeation through a calcium-activated potassium channel. J. Gen. Physiol. 92:549–567 10.1085/jgp.92.5.549 [DOI] [PMC free article] [PubMed] [Google Scholar]
- Nimigean C.M., Miller C. 2002. Na+ block and permeation in a K+ channel of known structure. J. Gen. Physiol. 120:323–335 10.1085/jgp.20028614 [DOI] [PMC free article] [PubMed] [Google Scholar]
- Oseguera A.J., Islas L.D., García-Villegas R., Rosenbaum T. 2007. On the mechanism of TBA block of the TRPV1 channel. Biophys. J. 92:3901–3914 10.1529/biophysj.106.102400 [DOI] [PMC free article] [PubMed] [Google Scholar]
- Park C.S., Miller C. 1992. Interaction of charybdotoxin with permeant ions inside the pore of a K+ channel. Neuron. 9:307–313 10.1016/0896-6273(92)90169-E [DOI] [PubMed] [Google Scholar]
- Rieke F., Baylor D.A. 1998. Origin of reproducibility in the responses of retinal rods to single photons. Biophys. J. 75:1836–1857 10.1016/S0006-3495(98)77625-8 [DOI] [PMC free article] [PubMed] [Google Scholar]
- Root M.J., MacKinnon R. 1993. Identification of an external divalent cation-binding site in the pore of a cGMP-activated channel. Neuron. 11:459–466 10.1016/0896-6273(93)90150-P [DOI] [PubMed] [Google Scholar]
- Ruppersberg J.P., Kitzing E.V., Schoepfer R. 1994. The mechanism of magnesium block of NMDA receptors. Semin. Neurosci. 6:87–96 10.1006/smns.1994.1012 [DOI] [Google Scholar]
- Shin H.G., Lu Z. 2005. Mechanism of the voltage sensitivity of IRK1 inward-rectifier K+ channel block by the polyamine spermine. J. Gen. Physiol. 125:413–426 10.1085/jgp.200409242 [DOI] [PMC free article] [PubMed] [Google Scholar]
- Shin H.G., Xu Y., Lu Z. 2005. Evidence for sequential ion-binding loci along the inner pore of the IRK1 inward-rectifier K+ channel. J. Gen. Physiol. 126:123–135 10.1085/jgp.200509296 [DOI] [PMC free article] [PubMed] [Google Scholar]
- Spassova M., Lu Z. 1998. Coupled ion movement underlies rectification in an inward-rectifier K+ channel. J. Gen. Physiol. 112:211–221 10.1085/jgp.112.2.211 [DOI] [PMC free article] [PubMed] [Google Scholar]
- Spassova M., Lu Z. 1999. Tuning the voltage dependence of tetraethylammonium block with permeant ions in an inward-rectifier K+ channel. J. Gen. Physiol. 114:415–426 10.1085/jgp.114.3.415 [DOI] [PMC free article] [PubMed] [Google Scholar]
- Stern J.H., Knutsson H., MacLeish P.R. 1987. Divalent cations directly affect the conductance of excised patches of rod photoreceptor membrane. Science. 236:1674–1678 10.1126/science.3037695 [DOI] [PubMed] [Google Scholar]
- Stotz S.C., Haynes L.W. 1996. Block of the cGMP-gated cation channel of catfish rod and cone photoreceptors by organic cations. Biophys. J. 71:3136–3147 10.1016/S0006-3495(96)79507-3 [DOI] [PMC free article] [PubMed] [Google Scholar]
- Sun Z.P., Akabas M.H., Goulding E.H., Karlin A., Siegelbaum S.A. 1996. Exposure of residues in the cyclic nucleotide-gated channel pore: P region structure and function in gating. Neuron. 16:141–149 [DOI] [PubMed] [Google Scholar]
- Thompson J., Begenisich T. 2001. Affinity and location of an internal K+ ion binding site in shaker K channels. J. Gen. Physiol. 117:373–384 10.1085/jgp.117.5.373 [DOI] [PMC free article] [PubMed] [Google Scholar]
- Thompson J., Begenisich T. 2003. External TEA block of shaker K+ channels is coupled to the movement of K+ ions within the selectivity filter. J. Gen. Physiol. 122:239–246 10.1085/jgp.200308848 [DOI] [PMC free article] [PubMed] [Google Scholar]
- Woodhull A.M. 1973. Ionic blockage of sodium channels in nerve. J. Gen. Physiol. 61:687–708 10.1085/jgp.61.6.687 [DOI] [PMC free article] [PubMed] [Google Scholar]
- Xu Y., Shin H.G., Szép S., Lu Z. 2009. Physical determinants of strong voltage sensitivity of K+ channel block. Nat. Struct. Mol. Biol. 16:1252–1258 10.1038/nsmb.1717 [DOI] [PMC free article] [PubMed] [Google Scholar]
- Yau K.W., Baylor D.A. 1989. Cyclic GMP-activated conductance of retinal photoreceptor cells. Annu. Rev. Neurosci. 12:289–327 10.1146/annurev.ne.12.030189.001445 [DOI] [PubMed] [Google Scholar]
- Yellen G. 1984. Relief of Na+ block of Ca2+-activated K+ channels by external cations. J. Gen. Physiol. 84:187–199 10.1085/jgp.84.2.187 [DOI] [PMC free article] [PubMed] [Google Scholar]
- Zagotta W.N., Siegelbaum S.A. 1996. Structure and function of cyclic nucleotide-gated channels. Annu. Rev. Neurosci. 19:235–263 10.1146/annurev.ne.19.030196.001315 [DOI] [PubMed] [Google Scholar]
- Zimmerman A.L., Baylor D.A. 1992. Cation interactions within the cyclic GMP-activated channel of retinal rods from the tiger salamander. J. Physiol. 449:759–783 [DOI] [PMC free article] [PubMed] [Google Scholar]


