Abstract
Vascular endothelial growth factor (VEGF) plays a key role in physiological blood vessel formation and pathological angiogenesis such as tumor growth and ischemic diseases. Hypoxia is a potent inducer of VEGF in vitro. Here we demonstrate that VEGF is induced in vivo by exposing mice to systemic hypoxia. VEGF induction was highest in brain, but also occurred in kidney, testis, lung, heart, and liver. In situ hybridization analysis revealed that a distinct subset of cells within a given organ, such as glial cells and neurons in brain, tubular cells in kidney, and Sertoli cells in testis, responded to the hypoxic stimulus with an increase in VEGF expression. Surprisingly, however, other cells at sites of constitutive VEGF expression in normal adult tissues, such as epithelial cells in the choroid plexus and kidney glomeruli, decreased VEGF expression in response to the hypoxic stimulus. Furthermore, in addition to VEGF itself, expression of VEGF receptor-1 (VEGFR-1), but not VEGFR-2, was induced by hypoxia in endothelial cells of lung, heart, brain, kidney, and liver. VEGF itself was never found to be up-regulated in endothelial cells under hypoxic conditions, consistent with its paracrine action during normoxia. Our results show that the response to hypoxia in vivo is differentially regulated at the level of specific cell types or layers in certain organs. In these tissues, up- or down-regulation of VEGF and VEGFR-1 during hypoxia may influence their oxygenation after angiogenesis or modulate vascular permeability.
Mammals respond to reduced oxygen concentrations (hypoxia) in many different ways at the systemic, local, and cellular levels. Adaptations at the systemic level include an increase in ventilation and the oxygen-transport capacity by enhanced erythropoiesis, which depends on the concentration of erythropoietin in the blood (reviewed in ref. 1). At the cellular level, survival of the individual cell under hypoxic conditions is governed by induction of glycolytic enzymes, facilitating ATP production by glycolysis rather than by oxidative phosphorylation. Induction of vascular endothelial growth factor (VEGF) is an example of local adaptation to hypoxia. In tissues suffering from insufficient oxygen supply, neovascularization aimed to increase perfusion and, hence, to improve tissue oxygenation, is thought to be mediated by VEGF.
VEGF is a major inducer of angiogenesis during development. It binds to two endothelial tyrosine kinase receptors, VEGF receptor-1 (VEGFR-1) (Flt-1) and VEGFR-2 (Flk-1/KDR). In the adult, VEGF activity is associated with induction of endothelial fenestrations, vascular permeability (2–4), and physiological angiogenesis, for example during the female reproductive cycle or in wound healing. Pathological angiogenesis is also connected to the up-regulation of VEGF expression, which occurs in ophthalmic and rheumatic diseases, ischemia, and tumor growth (reviewed in ref. 5).
Tissue hypoxia is a common feature in all these diseases and may play a role in their pathogenesis. Indeed, hypoxia is a strong inducer of VEGF mRNA expression in a variety of normal and transformed cells in vitro (6–10). The increase in secreted biologically active VEGF protein from cells exposed to hypoxia is partly because of an increased transcription rate, mediated by binding of hypoxia-inducible factor-1 to a hypoxia responsive element in the 5′-flanking region of the VEGF gene (7, 11, 12) and also because of an increase in VEGF mRNA stability (6, 13), probably because of binding of the RNA-binding protein HuR (14). In addition, an internal ribosome entry site ensures efficient translation of VEGF mRNA even under hypoxia (15). In vivo, VEGF expression is clearly induced in hypoxic regions in the vicinity of tumor necroses (16–18) and VEGF up-regulation has been demonstrated in various models of ischemia in brain (19, 20), heart (21, 22), and lung (23). Thus, hypoxia has been identified as a stimulus for induction of VEGF in pathological situations. In addition, hypoxia-induced VEGF seems to be an important driving force during embryogenesis, for example during development of the retinal vasculature (24). It is unclear, however, whether VEGF is hypoxia responsive in more physiological situations, such as adaptation to high-altitude exposure and chronic hypoxia. Indeed, studies using hypoxemic or hypobaric hypoxia have yielded conflicting results concerning VEGF inducibility by tissue hypoxia in vivo (25, 26). Furthermore, little is known about the regulation of VEGF receptor expression. VEGFR-1 and VEGFR-2 seem to be relatively confined to endothelial cells (27, 28). Both receptors are expressed during embryonic development but are down-regulated in most adult tissues when angiogenesis ceases (27, 28). Hypoxia has also been proposed to play a role in the regulation of VEGF receptor expression (29, 30). However, results concerning inducibility by hypoxia of both VEGFR-1 and VEGFR-2 are contradictory (31–33).
Therefore, we aimed to investigate the hypoxia inducibility of VEGF and its receptors in vivo by exposing adult mice to hypoxemic hypoxia. We show a distinct cellular expression pattern and the inducibility of these genes in different organs during normoxia and hypoxia.
MATERIALS AND METHODS
Animals.
All experiments were performed according to protocols approved by the Regierungspräsidium Darmstadt. Adult male C57BL/6 mice from our breeding facility were exposed in three different experiments to 0.1% carbon monoxide (CO) resulting in functional anemia, where 50% of the binding sites of hemoglobin for oxygen are blocked, or to 6% oxygen for 6 hours, or were kept at room air as described (34, 35). Mice were then killed by decapitation. Tissues (brain, heart, lung, liver, kidney, and testis) were harvested and immediately frozen in liquid nitrogen.
RNA Extraction and Northern Blot Analyses.
Total RNA was extracted and used for Northern blot analysis as described (36). The signal on the membrane was quantified by using a Bio-Imaging Analyzer (BAS-2500, Fuji). The VEGF probe has been described before (34) and the probes for mouse VEGFR-1 and VEGFR-2 were a kind gift from G. Breier (Max Planck Institute, Bad Nauheim, Germany). The cDNA probe for chicken β-actin (6) was used for correction of RNA loading.
Reverse Transcription–PCR (RT-PCR).
Total RNA (2 μg) from normoxic and hypoxic organs was reverse-transcribed by using GIBCO’s reverse transcriptase system. One-tenth of the reaction mixture was used as template for PCR amplification with the primers 5′-GCGGGCTGCCTCGCAGTC-3′ (sense) and 5′-TCACCGCCTTGGCTTGTCAC-3′ (antisense), respectively, corresponding to base pairs 16–33 and 659–640 of the mouse VEGF cDNA sequence [numbering according to (37)]. RT-PCR products were 716 bp (VEGF188), 644 bp (VEGF164), and 512 bp (VEGF120), respectively. The amplification profile was 94°C for 1 min, 65°C for 1 min, and 72°C for 1.5 min for 30 cycles.
In Situ Hybridization and Immunohistochemistry.
The techniques used for in situ hybridization were essentially as described (38). cDNA clones of mouse VEGF (38), VEGFR-2 (27), and VEGFR-1 (28) were used to generate 35S-UTP-labeled single-stranded RNA probes. Slides coated with Kodak NTB-2 emulsion (Eastman Kodak) were developed after 12–21 days and counterstained with 0.02% Toluidine Blue. PECAM-1 immunohistochemistry using MEC 13.3 antimouse PECAM-1/CD31 antibody was performed as described (39). To map hypoxic regions of various organs in vivo, 250 μl of 10 mM, 2-(2-nitro-1H-imidazol-1-yl)-N-(2,2,3,3,3-pentafluoropropyl)acetamide (EF5) (40) was administered intravenously before exposure to hypoxia or normoxia. Immunofluorescence for EF5 with Cy3-conjugated ELK3–51 monoclonal antibody was performed as described (40, 41).
RESULTS AND DISCUSSION
Systemic Hypoxia Induces VEGF Expression in Mouse Tissues.
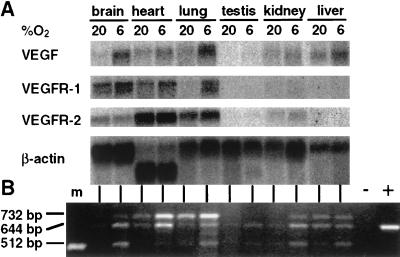
VEGF mRNA was present in all normoxic mouse tissues tested, as demonstrated by Northern blot analysis (Fig. 1A) and RT-PCR (Fig. 1B). Expression of VEGF mRNA was most abundant in lung, followed by kidney, heart, liver, and brain. The weakest signal was detected in testis. The distribution pattern in mouse tissues reported here is similar to that observed for rat, guinea pigs, and humans (42, 43).
Figure 1.
(A) Northern blot hybridization of VEGF, VEGFR-1, and -2 transcripts in adult mice tissues. Total RNA (20 μg) from normoxic and hypoxic (6% O2 for 6 h) organs was hybridized to the indicated 32P-labeled cDNA probes and exposed to a BioImager screen (BAS-2500, Fuji). (B) PCR analysis of VEGF transcripts (VEGF188, 716 bp; VEGF164, 644 bp; VEGF120, 512 bp). cDNA was synthesized from 2 μg of total RNA from normoxic and hypoxic organs. −, no RT; +, positive control (plasmid VEGF164); m, molecular weight marker (506 bp).
To test whether VEGF is regulated by tissue hypoxia in vivo, mice were exposed to either 6% oxygen for 6 hours (hypoxemic hypoxia) or to 0.1% CO for 6 h, resulting in functional anemia and subsequent tissue hypoxia. Northern blot analysis revealed that hypoxemic hypoxia was a stimulus for VEGF mRNA expression in all organs analyzed (Fig. 1A). VEGF mRNA was induced 4-fold in the brain, 3-fold in testis, and about 2-fold in heart, lung, kidney, and liver compared with normoxic controls (normalized to β-actin). Induction by CO gave essentially the same results (data not shown). RT-PCR experiments revealed that all three VEGF isoforms known to be expressed in the mouse (38, 44) were induced by hypoxia, albeit to various degrees (Fig. 1B). Results from a recent report have suggested that systemic hypoxemia was not a significant stimulatory factor for VEGF gene expression in vivo (25). In that study, rats were exposed to 8% oxygen. Thus, differences in the severity of hypoxia (i.e., 6% vs. 8% oxygen), exposure time, species reaction, and RNA analyzing techniques may account for this discrepancy. Furthermore, VEGF expression in brain was not analyzed in the aforementioned study, while we found the most striking increase in VEGF mRNA in this organ. Our results partially agree with a study where an increase in VEGF gene expression in kidney and brain was shown after hypoxic exposure (26). However, VEGF induction in liver and heart was found only after CO treatment and not after exposure to a reduced oxygen concentration. We found essentially the same induction levels as measured by quantitative Northern blot analysis when comparing stimulation by 6% oxygen and 0.1% CO.
Hypoxia Changes the Organ-Specific Cellular Distribution of VEGF Expression.
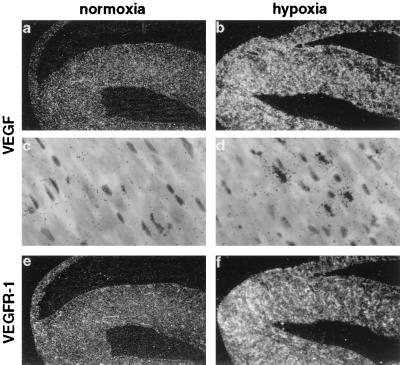
To identify cellular localization of VEGF mRNA expression in normal and hypoxic tissues, in situ hybridization with mVEGF riboprobes was performed. Clear differences were seen in the cellular expression patterns in the various organs. In principle, we observed two different responses. First, there was a uniform increase in VEGF expression throughout the organ in the same cell types that expressed VEGF already under normoxic conditions, e.g., in the heart and lung. VEGF was very weakly expressed in a subset of myocytes, homogeneously spread throughout the heart (Fig. 2 a and c). After exposure to 0.1% CO (hypoxic exposure) more myocytes expressed VEGF mRNA, and the amount of VEGF gene expression per cell also increased (Fig. 2d), leading to a general up-regulation of VEGF mRNA throughout the heart (Fig. 2b). In the lung, VEGF expression was scattered throughout the organ. A relatively strong labeling was observed under normoxic conditions at the luminal surface of alveolar walls, mostly in alveolar epithelial cells as previously described (23, 43). After hypoxic exposure, VEGF expression increased slightly but homogeneously in all regions of the lung, mostly in alveolar epithelial cells (not shown). No significant expression was observed in the endothelium or in cartilaginous structures, as previously reported (42).
Figure 2.
Localization of VEGF (a–d) and VEGFR-1 (e, f) mRNA in adult mouse heart. Serial sections from normoxic (a, c, e) and hypoxic (CO-treated) (b, d, f) heart were hybridized in situ with 35S-labeled RNA probes. Shown are dark-field images at a magnification of ×6.25 (a, b, e, f) and bright-field images at a magnification of ×250 (c, d). No signal was observed in control hybridization with sense probes (not shown).
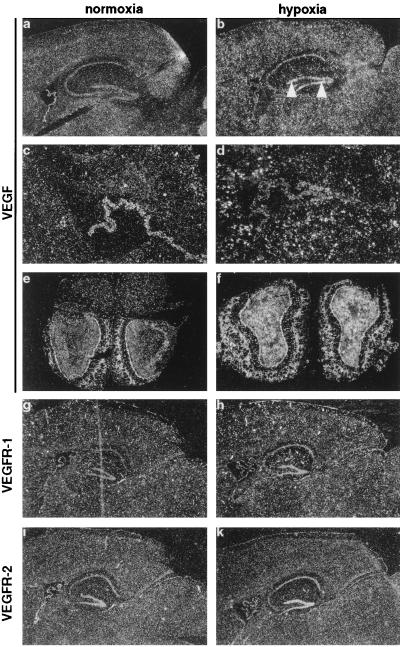
Secondly, we noticed a rather unexpected redistribution of VEGF expression concerning either the localization within the organ or the cell type, which expressed VEGF mRNA when comparing normoxia and hypoxia. Throughout the brain, a low level of VEGF expression was observed in glial cells (Figs. 3a and 7b). Higher hybridization signals were detected in epithelial cells of choroid plexus (Fig. 3b), associated with endothelial cell fenestrations and vascular permeability (38, 42, 43), and in the cerebellum (not shown). Strongest expression of VEGF was found in the olfactory bulb, specifically in the glomerular and granule layers (Fig. 3e). Under hypoxic conditions, however, VEGF expression was strongly increased in glial cells (Figs. 3 b and d and 7f), and was now also detectable in neuronal cells within hippocampus and dentate gyrus (Fig. 3b). By contrast, expression levels in the epithelial cells of the choroid plexus decreased (Fig. 3d). Previously, chronic hypoxia had been shown to lead to an increased vascular density in the brain (45, 46). Therefore, reduced oxygen levels may induce angiogenesis in the adult brain by up-regulating VEGF, most likely in astrocytes. VEGF expression in cultured astrocytes has been reported before (9, 34). VEGF expression was also augmented in the cerebellum (not shown) and the olfactory bulb (Fig. 3f). Whereas expression in the cerebellum has been reported before (42), this is the first study to describe VEGF expression in the olfactory bulb, where VEGF mRNA levels were the highest detected in the brain. The functional role of VEGF expression in neurons in the hippocampus and in the olfactory bulb, apart from inducing permeability and angiogenesis, remains to be identified. However, it is noteworthy that neuropilin-1, a receptor for collapsin/semaphorins involved in neuronal guidance in the brain, has very recently been identified as a receptor for VEGF (47). In addition, VEGFR-2 has been shown to be expressed in neural progenitor cells of the retina (48), and expression of VEGFR-1 was found on reactive astrocytes after VEGF stimulation (49). Thus, VEGF may have an important function within the central nervous system for neurogenesis, neural guidance, or for the interaction between neurons and glial cells.
Figure 3.
Detection of VEGF (a–f), VEGFR-1 (g, h) and VEGFR-2 (i, k) mRNA in adult brain. Sagittal sections through normoxic (a, c, g, i) and hypoxic (CO-treated) (b, d, h, k) mouse brain. VEGF expression in dentate gyrus is indicated by arrowheads. (c) Higher magnification of choroid plexus shown in a. (d) Corresponding hypoxic section. Note down-regulation of VEGF expression in the plexus, while surrounding glial cells show an increased expression. (e) Coronal section through a normoxic olfactory bulb. Note the strong VEGF staining in the glomerular and granule layers. (f) Corresponding hypoxic section. [Magnification: ×6.25 (a, b, and e–k); ×25 (c and d).]
Figure 7.
Localization of VEGF (a, b, e, f) and VEGFR-1 (c, g) mRNA and PECAM-1 protein (d, h) on serial sections from normoxic (a–d) and hypoxic (CO-treated) (e–h) brain. A cortical microvessel is shown on bright-field (a, e) and dark-field images (b, c, f, g) from in situ hybridization experiments and immunohistochemistry images (d, h). Note that endothelial cells do not express VEGF.
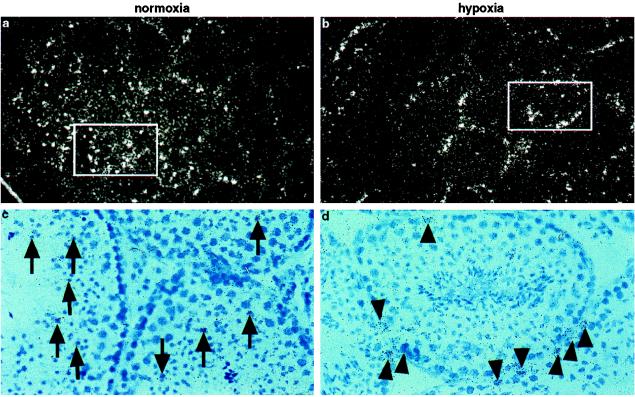
Testis represents an example of a complete switch in the cell type expressing VEGF. In general, VEGF expression in testis was very low and barely detectable by Northern blot. By in situ hybridization, however, we found VEGF expression in normoxic testis predominantly in germ cells within the seminiferous tubules (Fig. 4 a and c). In contrast, after hypoxic exposure, Sertoli cells, which line the border of the seminiferous tubules, became the most prominent VEGF-expressing cell type (Fig. 4 b and d). These results suggest that regulation of VEGF expression differs from one cell type to another during hypoxia. However, we did not detect VEGF expression in Leydig cells as has previously been described for human testis (50). The function of VEGF in these cells remains unclear, although it has been suggested that VEGF produced by Sertoli cells might induce and maintain fenestrations in testicular capillaries (50).
Figure 4.
Localization of VEGF mRNA in mouse testis. (a, c) Section through a normoxic testis showing VEGF staining predominantly in spermatoid cells (arrows) localized within tubuli. (b, d) Corresponding section through a hypoxic (CO-treated) testis. Note the predominant VEGF staining of Sertoli cells at the border of the tubuli (arrowhead). Bright-field images (×50, c, d) show the area depicted in the dark-field images (×25, a, b).
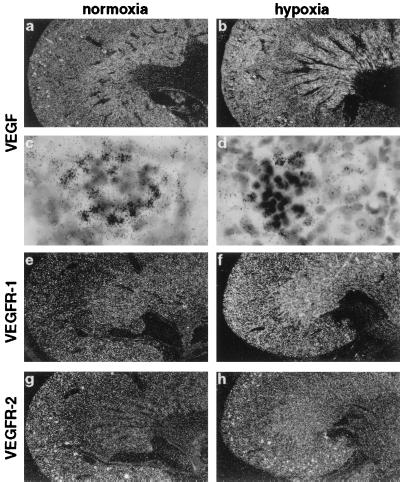
A restricted pattern of VEGF expression was also found in kidney and liver. In the kidney, in situ hybridization revealed that VEGF was expressed predominantly in glomeruli (Fig. 5 a and c), where it is believed to be involved in the maintenance of endothelial cell fenestrations (42), but a low level of expression was also detected in periglomerular cells in the renal cortex and in the medulla (Fig. 5a). In hypoxic kidneys, VEGF expression was strikingly increased in the inner medulla (Fig. 5b), where it may induce angiogenesis after the hypoxic stimulus, whereas expression levels in the glomeruli were strikingly decreased (Fig. 5d).
Figure 5.
Localization of VEGF (a–d), VEGFR-1 (e, f) and VEGFR-2 (g, h) mRNA in adult mouse kidney. Dark-field images from sections of normoxic (a, e, g) and hypoxic (CO-treated) (b, f, h) kidneys and bright-field images from normoxic (c) and hypoxic (d) glomeruli are shown. Note the strong VEGF (a, c) staining in glomeruli under normoxic conditions and the intense VEGF expression in the inner medulla during hypoxia (b), while expression in the glomerulus is down-regulated during hypoxia (d). Original magnification: ×6.25 (a, b, e–h); ×250 (c, d).
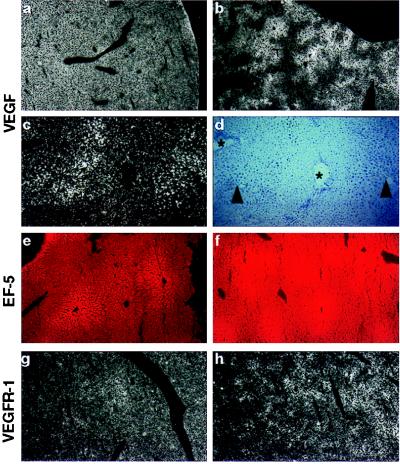
In the liver, VEGF expression was evenly distributed throughout the organ under normoxic conditions in hepatocytes (Fig. 6a). This constitutive expression is thought to be responsible for the extreme permeability of the endothelial cells lining the hepatic sinuses (42). The expression pattern in livers isolated from hypoxic animals showed a redistribution rather than a general induction (Fig. 6b). VEGF expression was increased around central veins and diminished around periportal fields (Fig. 6 c and d).
Figure 6.
Localization of VEGF (a–d) and VEGFR-1 (g, h) mRNA in adult liver. (a) Homogenous VEGF staining in normoxic liver. (b) Patchy VEGF expression during hypoxia. (c) Magnification of b, showing intensified VEGF expression around central veins (marked by arrowheads in d) and reduced expression around periportal fields (indicated by asterices in d). (d) Bright-field image of c. (e) Weak EF5 staining in normoxic liver. (f) Hypoxic regions in liver are shown by strong EF5 staining, especially around central veins. (g) Low expression of VEGFR-1 in normoxic liver. (h) Increased VEGFR-1 expression around central veins during hypoxia. Original magnification: ×6.25 (a, b, g, h); ×25 (e, f); ×50 (c, d).
Spatial Relationship Between Hypoxia and VEGF Expression.
The expression pattern for VEGF in kidney and liver suggested that VEGF mRNA levels were increased in areas prone to hypoxia such as the regions around central veins in liver. To demarcate regions of hypoxia in vivo, the 2-nitroimidazole compound EF5 was injected intravenously just before hypoxic exposure. EF5 is reduced under hypoxic conditions, facilitating the formation of covalent linkages with cellular protein thiols. These EF5 protein adducts can be identified by immunostaining and serve as a marker of hypoxia (40, 41). As shown in Fig. 6f, hypoxic exposure resulted in strong EF5 staining in the liver with the maximum around central veins, indicating the most hypoxic area. These regions coincided well with VEGF gene expression, suggesting tissue hypoxia as the stimulus for VEGF gene induction. The EF5 staining in normoxic control liver was much weaker and more diffuse (Fig. 6e). There was, however, a slight tendency for increased staining around the central veins, probably reflecting the physiological oxygen gradient from the arterial (periportal) to venous (central vein) vasculature. These results strongly confirm the importance of hypoxia as a stimulatory factor for VEGF expression in vivo.
VEGF Is Not Expressed in Endothelial Cells.
The general concept suggests that VEGF is expressed in parenchymal cells adjacent to vessels to stimulate endothelial cells in a paracrine fashion by means of its receptors. However, results from various in vitro studies suggested endothelial cells as a production site for VEGF and thus postulated an autocrine mechanism of action (12, 51). We therefore analyzed whether endothelial cells in vivo can express VEGF mRNA. Fig. 7 shows brain cortical microvessels as an example. Endothelial cells did not express VEGF mRNA, either under control conditions (Fig. 7 a and b) or under hypoxia (Fig. 7 e and f). On the other hand, the adjacent glial cells did express VEGF and increased its expression level during hypoxic exposure (Fig. 7 e and f), thus clearly demonstrating a hypoxic response of the tissue. The vessels, though, were clearly positive for VEGFR-1 (Fig. 7 c and g, and see below) and PECAM-1 (Fig. 7 d and h), two endothelial cell markers. Thus, although many different cell types have the capacity to express VEGF, endothelial cells were not observed to do so in vivo as analyzed by in situ hybridization, either under normoxic or hypoxic conditions in any of the organs analyzed (brain, kidney, liver, heart, lung, and testis). These results suggest that under normoxia and hypoxia in vivo VEGF acts in a paracrine rather than autocrine manner.
VEGFR-1 (Flt-1) and VEGFR-2 (Flk-1) Are Differently Expressed in Adult Mouse Tissues.
Although both VEGFRs are down-regulated in most adult organs where angiogenesis has ceased (27, 28), we found an abundant but differential expression in various organs of adult mice as analyzed by Northern blot (Fig. 1A) and in situ hybridization. In the brain, VEGFR-1 expression was most prominent in endothelial cells of cortical vessels (Figs. 3g and 7c), but was also found in the choroid plexus (Fig. 3g). In contrast, VEGFR-2, which was strongly expressed in the plexus, was found only in a small subset of VEGFR-1-positive vessels (Fig. 3i). A difference in the expression pattern for the two VEGF receptors was also found in the kidney. Whereas VEGFR-1 was predominantly expressed in peritubular vessels of both kidney cortex and medulla (Fig. 5e), VEGFR-2 expression was most prominent in glomerular endothelial cells (Fig. 5g). In heart, liver and lung, VEGR-1 and -2 colocalized in vascular structures (data not shown).
Hypoxia Induces VEGFR-1 (Flt-1) but Not VEGFR-2 (Flk-1) Expression in Vivo.
Hypoxia has been proposed to play an important role also in the regulation of VEGF receptor gene expression. We therefore analyzed expression of both receptors in hypoxic mouse organs. Northern blot analysis showed that VEGFR-1 was clearly inducible in lung, heart, and brain, while VEGFR-2 was not (Fig. 1A). At the cellular level, VEGFR-1 expression was induced in cortical microvessels, but not in the choroid plexus (Figs. 3h and 7d). In the liver, VEGFR-1 expression became also more evident in hypoxic animals and was elevated in sinusoidal endothelial cells located near central veins, thus showing the same regional distribution as VEGF (Fig. 6h). In kidney, VEGFR-1 expression became more prominent in the cortex under hypoxia and was now extended into the medulla (Fig. 5f). In contrast to brain, liver, and kidney, VEGFR-1 expression was induced more homogeneously throughout the organ by hypoxia in heart (Fig. 2f) and lung (not shown). By contrast, VEGFR-2 was not inducible by hypoxia in any of the organs tested, but rather decreased in the expression level (Figs. 1A, 3k, and 5f). Thus, the responsiveness of these receptors to hypoxia was strikingly different. Previous reports demonstrating hypoxic induction of VEGFRs have been contradictory (23, 29–31). Several reports have shown an up-regulation of VEGFR-2 when endothelial cells were exposed to hypoxia in vitro (29, 30), although no induction at the transcriptional level was observed (30). However, our results are in line with a study demonstrating the induction of VEGFR-1, but not VEGFR-2, in the lung after systemic hypoxia (31). In addition, a hypoxia responsive element in the promoter of VEGFR-1, but not of VEGFR-2, has recently been identified and demonstrated to be involved in the hypoxia-induced transcription of VEGFR-1 in vitro (33).
In summary, adaptations to hypoxia, defined as an imbalance between the oxygen delivery to and the demand of a given tissue, may, among other compensatory mechanisms, involve new vessel growth to provide enough oxygen and nutrition for the suffering tissue. Regarding VEGF expression, we have identified two different ways in which cells react to hypoxic exposure in vivo. Cells at sites where VEGF expression is associated with constitutive endothelial cell functions, e.g., fenestrations in choroid plexus and kidney glomeruli, decrease VEGF expression, whereas cells at sites where angiogenesis is expected to occur as a compensatory mechanism to tissue ischemia, such as glial cells, heart myocytes, and tubular cells in kidney medulla, respond to hypoxia by a marked increase in VEGF gene expression. Thus, endothelial cell maintenance-related VEGF expression is rather unresponsive to hypoxia, whereas angiogenesis-related VEGF gene expression appears to be tightly regulated by oxygen and directed to the most hypoxic regions to allow new vessel growth and subsequent improvement of tissue oxygenation. Together with hypoxia-induced expression of VEGFR-1, this system enables a tight balance of physiological angiogenesis. Formation of new capillaries causes an increase in oxygenation with a concomitant down-regulation of VEGF expression, thus limiting the hypoxic stimulus. This concept may be applicable to situations where increased angiogenesis is desired to counteract situations of chronic hypoxia (45, 46) or ischemic lesions, as in myocardial infarction, hindlimb ischemia, and cerebral ischemia, where VEGF is induced (19, 20, 22). Indeed, promising therapeutic strategies for treatment of hindlimb ischemia in human trials have recently been reported (52).
Acknowledgments
We thank Dr. Cameron J. Koch (Philadelphia) for the generous gift of EF5 and the EF5 antibody (ELK3-51), Dr. Elisabetta Dejana (Milan, Italy) for the MEC 13.3 antibody, and Dr. Georg Breier (Max Planck Institute, Bad Nauheim, Germany) for VEGFR-1 and -2 cDNAs. We thank Dr. Urban Deutsch, Dr. Simon Bamforth, and Dr. Christian Bauer for critically reading the manuscript. H.H.M. was supported by fellowships from the Swiss National Science Foundation (Forschungskommission der Universität Zürich) and from the Schweizerische Stiftung für Medizinisch-Biologische Stipendien.
ABBREVIATIONS
- VEGF
vascular endothelial growth factor
- VEGFR
VEGF receptor
- EF5
2-(2-nitro-1H-imidazol-1-yl)-N-(2,2,3,3,3-pentafluoropropyl)acetamide
Footnotes
This paper was submitted directly (Track II) to the Proceedings Office.
References
- 1.Bunn H F, Poyton R O. Physiol Rev. 1996;76:839–885. doi: 10.1152/physrev.1996.76.3.839. [DOI] [PubMed] [Google Scholar]
- 2.Roberts W G, Palade G E. J Cell Sci. 1995;108:2369–2379. doi: 10.1242/jcs.108.6.2369. [DOI] [PubMed] [Google Scholar]
- 3.Esser S, Wolburg K, Wolburg H, Breier G, Kurzchalia T, Risau W. J Cell Biol. 1998;140:947–959. doi: 10.1083/jcb.140.4.947. [DOI] [PMC free article] [PubMed] [Google Scholar]
- 4.Hippenstiel S, Krüll M, Ikemann A, Risau W, Clauss M, Suttorp N. Am J Physiol. 1998;274:L674–L684. doi: 10.1152/ajplung.1998.274.5.L678. [DOI] [PubMed] [Google Scholar]
- 5.Breier G, Damert A, Plate K H, Risau W. Thromb Haemostasis. 1997;78:678–683. [PubMed] [Google Scholar]
- 6.Ikeda E, Achen M G, Breier G, Risau W. J Biol Chem. 1995;270:19761–19766. doi: 10.1074/jbc.270.34.19761. [DOI] [PubMed] [Google Scholar]
- 7.Forsythe J A, Jiang B-H, Iyer N V, Agani F, Leung S W, Koos R D, Semenza G L. Mol Cell Biol. 1996;16:4604–4613. doi: 10.1128/mcb.16.9.4604. [DOI] [PMC free article] [PubMed] [Google Scholar]
- 8.Gleadle J M, Ebert B L, Firth J D, Ratcliffe P J. Am J Physiol. 1995;268:C1362–C1368. doi: 10.1152/ajpcell.1995.268.6.C1362. [DOI] [PubMed] [Google Scholar]
- 9.Ijichi A, Sakuma S, Tofilon P J. Glia (New York) 1995;14:87–93. doi: 10.1002/glia.440140203. [DOI] [PubMed] [Google Scholar]
- 10.Levy A P, Levy N S, Loscalzo J, Calderone A, Takahashi N, Yeo K-T, Koren G, Colucci W S, Goldberg M A. Circ Res. 1995;76:758–766. doi: 10.1161/01.res.76.5.758. [DOI] [PubMed] [Google Scholar]
- 11.Levy A P, Levy N S, Wegner S, Goldberg M A. J Biol Chem. 1995;270:13333–13340. doi: 10.1074/jbc.270.22.13333. [DOI] [PubMed] [Google Scholar]
- 12.Liu Y, Cox S R, Morita T, Kourembanas S. Circ Res. 1995;77:638–643. doi: 10.1161/01.res.77.3.638. [DOI] [PubMed] [Google Scholar]
- 13.Levy A P, Levy N S, Goldberg M A. J Biol Chem. 1996;271:2746–2753. doi: 10.1074/jbc.271.5.2746. [DOI] [PubMed] [Google Scholar]
- 14.Levy N S, Chung S, Furneaux H, Levy A P. J Biol Chem. 1998;273:6417–6423. doi: 10.1074/jbc.273.11.6417. [DOI] [PubMed] [Google Scholar]
- 15.Stein I, Itin A, Einat P, Skaliter R, Grossman Z, Keshet E. Mol Cell Biol. 1998;18:3112–3119. doi: 10.1128/mcb.18.6.3112. [DOI] [PMC free article] [PubMed] [Google Scholar]
- 16.Plate K H, Breier G, Weich H A, Risau W. Nature (London) 1992;359:845–848. doi: 10.1038/359845a0. [DOI] [PubMed] [Google Scholar]
- 17.Shweiki D, Itin A, Soffer D, Keshet E. Nature (London) 1992;359:843–845. doi: 10.1038/359843a0. [DOI] [PubMed] [Google Scholar]
- 18.Damert A, Machein M, Breier G, Fujita M Q, Hanahan D, Risau W, Plate K H. Cancer Res. 1997;57:3860–3864. [PubMed] [Google Scholar]
- 19.Kovacs Z, Ikezaki K, Samoto K, Inamura T, Fukui M. Stroke (Dallas) 1996;27:1865–1872. doi: 10.1161/01.str.27.10.1865. [DOI] [PubMed] [Google Scholar]
- 20.Hayashi T, Abe K, Suzuki H, Itoyama Y. Stroke (Dallas) 1997;28:2039–2044. doi: 10.1161/01.str.28.10.2039. [DOI] [PubMed] [Google Scholar]
- 21.Li J, Brown L F, Hibberd M G, Grossman J D, Morgan J P, Simons M. Am J Physiol. 1996;270:H1803–H1811. doi: 10.1152/ajpheart.1996.270.5.H1803. [DOI] [PubMed] [Google Scholar]
- 22.Banai S, Shweiki D, Pinson A, Chandra M, Lazarovici G, Keshet E. Cardiovasc Res. 1994;28:1176–1179. doi: 10.1093/cvr/28.8.1176. [DOI] [PubMed] [Google Scholar]
- 23.Tuder R M, Flook B E, Voelkel N F. J Clin Invest. 1995;95:1798–1807. doi: 10.1172/JCI117858. [DOI] [PMC free article] [PubMed] [Google Scholar]
- 24.Stone J, Itin A, Alon T, Peer J, Gnessin H, Chan-Ling T, Keshet E. J Neurosci. 1995;15:4738–4747. doi: 10.1523/JNEUROSCI.15-07-04738.1995. [DOI] [PMC free article] [PubMed] [Google Scholar]
- 25.Sandner P, Gess B, Wolf K, Kurtz A. Pflügers Arch Eur J Physiol. 1996;431:905–912. doi: 10.1007/s004240050084. [DOI] [PubMed] [Google Scholar]
- 26.Minchenko A, Bauer T, Salceda S, Caro J. Lab Invest. 1994;71:374–379. [PubMed] [Google Scholar]
- 27.Millauer B, Wizigmann-Voos S, Schnürch H, Martinez R, Moller N P H, Risau W, Ullrich A. Cell. 1993;72:835–846. doi: 10.1016/0092-8674(93)90573-9. [DOI] [PubMed] [Google Scholar]
- 28.Breier G, Clauss M, Risau W. Dev Dyn. 1995;204:228–239. doi: 10.1002/aja.1002040303. [DOI] [PubMed] [Google Scholar]
- 29.Brogi E, Schatteman G, Wu T, Kim E A, Varticovski L, Keyt B, Isner J M. J Clin Invest. 1996;97:469–476. doi: 10.1172/JCI118437. [DOI] [PMC free article] [PubMed] [Google Scholar]
- 30.Waltenberger J, Mayr U, Pentz S, Hombach V. Circulation. 1996;94:1647–1654. doi: 10.1161/01.cir.94.7.1647. [DOI] [PubMed] [Google Scholar]
- 31.Sandner P, Wolf K, Bergmaier U, Gess B, Kurtz A. Pflügers Arch Eur J Physiol. 1997;433:803–808. doi: 10.1007/s004240050348. [DOI] [PubMed] [Google Scholar]
- 32.Kremer C, Breier G, Risau W, Plate K H. Cancer Res. 1997;57:3852–3859. [PubMed] [Google Scholar]
- 33.Gerber H-P, Condorelli F, Park J, Ferrara N. J Biol Chem. 1997;272:23659–23667. doi: 10.1074/jbc.272.38.23659. [DOI] [PubMed] [Google Scholar]
- 34.Marti H H, Wenger R H, Rivas L A, Straumann U, Digicaylioglu M, Henn V, Yonekawa Y, Bauer C, Gassmann M. Eur J Neurosci. 1996;8:666–676. doi: 10.1111/j.1460-9568.1996.tb01252.x. [DOI] [PubMed] [Google Scholar]
- 35.Yan S F, Zou Y S, Mendelsohn M, Gao Y, Naka Y, Yan SD, Pinsky D J, Stern D. J Biol Chem. 1997;272:4287–4294. doi: 10.1074/jbc.272.7.4287. [DOI] [PubMed] [Google Scholar]
- 36.Wenger R H, Marti H H, Schuerer-Maly C C, Kvietikova I, Bauer C, Gassmann M, Maly F E. Blood. 1996;87:756–761. [PubMed] [Google Scholar]
- 37.Claffey K P, Wilkison W O, Spiegelman B M. J Biol Chem. 1992;267:16317–16322. [PubMed] [Google Scholar]
- 38.Breier G, Albrecht U, Sterrer S, Risau W. Development (Cambridge, UK) 1992;114:521–532. doi: 10.1242/dev.114.2.521. [DOI] [PubMed] [Google Scholar]
- 39.Engelhardt B, Vestweber D, Hallmann R, Schulz M. Blood. 1997;90:4459–4472. [PubMed] [Google Scholar]
- 40.Koch C J, Lord E M, Shapiro I M, Clyman R I, Evans S M. Adv Exp Med Biol. 1997;428:585–593. doi: 10.1007/978-1-4615-5399-1_83. [DOI] [PubMed] [Google Scholar]
- 41.Evans S M, Joiner B, Jenkins W T, Laughlin K M, Lord E M, Koch C J. Br J Cancer. 1995;72:875–882. doi: 10.1038/bjc.1995.427. [DOI] [PMC free article] [PubMed] [Google Scholar]
- 42.Monacci W T, Merrill M J, Oldfield E H. Am J Physiol. 1993;264:C995–C1002. doi: 10.1152/ajpcell.1993.264.4.C995. [DOI] [PubMed] [Google Scholar]
- 43.Berse B, Brown L F, Van De Water L, Dvorak H F, Senger D R. Mol Biol Cell. 1992;3:211–220. doi: 10.1091/mbc.3.2.211. [DOI] [PMC free article] [PubMed] [Google Scholar]
- 44.Bacic M, Edwards N A, Merrill M J. Growth Factors. 1995;12:11–15. doi: 10.3109/08977199509003209. [DOI] [PubMed] [Google Scholar]
- 45.Harik S I, Hritz M A, LaManna J C. J Physiol (London) 1995;485:525–530. doi: 10.1113/jphysiol.1995.sp020748. [DOI] [PMC free article] [PubMed] [Google Scholar]
- 46.LaManna J C, Harik S I. Adv Exp Med Biol. 1997;428:163–167. doi: 10.1007/978-1-4615-5399-1_23. [DOI] [PubMed] [Google Scholar]
- 47.Soker S, Takashima S, Miao H Q, Neufeld G, Klagsbrun M. Cell. 1998;92:735–745. doi: 10.1016/s0092-8674(00)81402-6. [DOI] [PubMed] [Google Scholar]
- 48.Yang X J, Cepko C L. J Neurosci. 1996;16:6089–6099. doi: 10.1523/JNEUROSCI.16-19-06089.1996. [DOI] [PMC free article] [PubMed] [Google Scholar]
- 49.Rosenstein J M, Mani N, Silverman W F, Krum J M. Proc Natl Acad Sci USA. 1998;95:7086–7091. doi: 10.1073/pnas.95.12.7086. [DOI] [PMC free article] [PubMed] [Google Scholar]
- 50.Ergün S, Kiliç N, Fiedler W, Mukhopadhyay A K. Mol Cell Endocrinol. 1997;131:9–20. doi: 10.1016/s0303-7207(97)00082-8. [DOI] [PubMed] [Google Scholar]
- 51.Namiki A, Brogi E, Kearney M, Kim E A, Wu T, Couffinhal T, Varticovski L, Isner J M. J Biol Chem. 1995;270:31189–31195. doi: 10.1074/jbc.270.52.31189. [DOI] [PubMed] [Google Scholar]
- 52.Isner J M, Pieczek A, Schainfeld R, Blair R, Haley L, Asahara T, Rosenfield K, Razvi S, Walsh K, Symes J F. Lancet. 1996;348:370–374. doi: 10.1016/s0140-6736(96)03361-2. [DOI] [PubMed] [Google Scholar]


