

Abstract
Human cytochrome P450 (P450) 4F11 is still considered an “orphan” because its function is not well characterized. A bacterial expression system was developed for human P450 4F11, producing ~230 nmol P450 from a 3-liter culture of Escherichia coli. P450 4F11 was purified and utilized for untargeted substrate searches in human liver extract using a liquid chromatography/mass spectrometry-based metabolomic and isotopic labeling approach (Z. Tang et al., Anal. Chem. 81, 3071–3078, 2009). Four fatty acids—palmitic, oleic, arachidonic, and docosahexaenoic—were identified in human liver and verified as substrates of P450 4F11. The products were characterized as ω-hydroxylated fatty acids by gas chromatography-mass spectrometry analysis of their trimethylsilyl derivatives. Kinetic analysis of the oxidation products confirmed that the fatty acids are substrates oxidized by P450 4F11. P450 4F11 also exhibited low activity for some drug N-demethylation reactions but none for activation of several procarcinogens.
Keywords: Cytochrome P450 4F11, Heterologous expression, Enzyme purification, Liquid chromatography-mass spectrometry, Metabolomics
Introduction
P4501 enzymes are important heme-containing monooxygenases that play roles in the metabolism of a large number of endogenous compounds (including sterols, fatty acids, eicosanoids, and vitamins) as well as xenobiotics [2]. With the successful completion of the human genome project, 57 functional genes and 58 pseudogenes of human P450 have been identified [3], of which ~13 members are termed “orphans” because of their unknown function [3, 4].
Human P450 4F11 is one of the orphan P450s, with limited information regarding heterologous expression and functional characterization [4, 5]. P450 4F11 has been reported to be located in a cluster with the other five members of the P450 4F subfamily on chromosome 19p13.1-2, and its mRNA is found mainly in human liver [6]. The P450 4F gene subfamily is known to be involved in the metabolism of endogenous eicosanoids as well as some clinically active drugs, at least in animal models [7–9]. The catalytic activity of P450 4F11 expressed in Saccharomyces cerevisiae has been investigated, with low rates of oxidation of some endogenous eicosanoids (e.g., leukotriene B4) and somewhat higher rates for some drugs (e.g., erythromycin) [10]. The ω-oxidation of two β-hydroxy fatty acids has been demonstrated with human P450 4F11 expressed in Spodoptera frugiperda insect cells [11]. In order to elucidate the function of human P450 4F11, an untargeted metabolomic strategy as well as a more robust expression system is required and was the focus of our study.
MS, performed either directly or coupled with chromatographic methods, is one of the most widely used analytical tools for metabolomic analysis [12–14]. In recent years, LC-MS—in combination with bioinformatic tools for data analysis—has proven to be a powerful approach for assigning enzyme function, with the advantages of high sensitivity and selectivity, wide dynamic range, and direct analysis of complex biological samples with minimal ion suppression [15–17]. Recently we developed a general strategy for identification of endogenous substrates of human P450s in tissue extracts using LC-MS assays and the program DoGEX [18, 19]. In vitro incubation of a P450 enzyme system and tissue extract is done under a mixture of 18O2/16O2 gas (1:1, v/v). LC-MS assay of an organic extract of the reaction mixture is performed, and the isotopic labeling products appearing as M/M+2 doublets are directly identified using DoGEX [18, 19]. The strategy has been validated using both targeted and untargeted searches to identify candidate substrates and products in human liver for some hepatic human P450s (1A2, 2C8, 2C9) previously characterized for their oxidations of xenobiotics [19]. Thus, this strategy has been demonstrated to be potentially useful in identifying reactions in tissue extracts with orphan human P450s.
The aim of the present work was to establish a bacterial system for human P450 4F11 expression and purification and to characterize its catalytic function using the strategy we developed [19]. The purified enzyme was utilized for untargeted substrate searches in human liver samples using the LC-MS metabolomic and isotopic labeling approach. Four fatty acids were identified in liver and subsequently verified as substrates of P450 4F11. The products were characterized as ω-hydroxylated fatty acids, and steady-state kinetic measurements of the P450 reactions were done.
Materials and Methods
Chemicals
Human liver samples (from organ donors) were obtained from Tennessee Donor Services and stored at −70 °C. Rat NADPH-P450 reductase [20] and cytochrome b5 [21] were expressed in Escherichia coli and purified as previously reported. L-α-1,2-Dilauroyl-sn-glycero-3-phosphocholine, C16:0, 3-OH C16:0, 16-OH C16:0, C18:1, C20:4, C22:6, PDAM, benzphetamine, erythromycin, ethylmorphine, and dansylhydrazine were purchased from Sigma-Aldrich (St. Louis, MO). [1-14C] C16:0 (specific activity 56 mCi mmol−1), [1-14C] C18:1 (specific activity 55 mCi mmol−1), [1-14C] C20:4 (specific activity 55 mCi mmol−1), and [1-14C] C22:6 (specific activity 55 mCi mmol−1) were purchased from American Radiolabeled Chemicals (St. Louis, MO). N,O-bis-(Trimethylsilyl)-trifluoroacetamide:trimethylchlorosilane:trimethylsilylimidazole:pyridine (3:2:3:10, v/v/v/v) was purchased from Regis Technologies (Morton Grove, IL). All other reagents and solvents were obtained from general commercial suppliers.
Construction of P450 4F11 expression plasmids
In order to find an appropriate N-terminal sequence for heterologous expression of human P450 4F11 in E. coli, several N-terminal mutations were introduced into the native construct (pCR®2.1 4F11, gift from H. W. Strobel, Univ. Texas, Houston) by PCR-based mutagenesis (Supplemental Table S1). A C-terminal (His)6 tag was introduced into the P450 4F11 cDNA at the same time, using a 3′-primer containing sequence encoding histidine residues and an XbaI site. PfuUltra™ High-Fidelity DNA polymerase (Stratagene, La Jolla, CA) was used for the PCR amplification, at an annealing temperature of 55 °C. The products were purified, double-digested, and ligated into the monocistronic pCW vector [22] (not coding for NADPH-P450 reductase). The modifications were confirmed by sequencing the open reading frame regions of the new constructs. A bicistronic plasmid of 4F11 construct #11 (Table 1) was also constructed by ligating the corresponding cDNA with a bicistronic pCW vector (containing the cDNA for NADPH-P450 reductase [23]) using the NdeI and XbaI restriction sites.
Table 1.
Selection of N-terminal sequences of human P450 4F11 for heterologous expression. Amino acid changes are underlined.
| Constructs (and basis) | N-Terminal amino acid sequences |
|---|---|
| 4F11 native | MPQLSLSWLGLGPVAASPWLLLLLVGGSWLLARVLAWTYTFYDNCRRLQCFPQPP |
| #1 2C3 rabbit | MAKKTSSKGKLPQPP |
| #2 2C3 rabbit | MAKKTSSKGKLQCFPQPP |
| #3 2E1 human | MARQVHSSWNLQCFPQPP |
| #4 17A1 bovine | MALLLAVFLAWTYTFYDNCRRLQCFPQPP |
| #5 2E1 human | MARQVHSSWNLYDNCRRLQCFPQPP |
| #8 full length | MAQLSLSWLGLGPVAASPWLLLLLVGGSWLLARVLAWTYTFYDNCRRLQCFPQPP |
| #11 17A1 bovine | MALLLAVFLGPVAASPWLLLLLVGGSWLLARVLAWTYTFYDNCRRLQCFPQPP |
Expression of P450 4F11 in E. coli BL21
Expression trials of all P450 4F11 constructs were performed at 28 °C in E. coli BL21 competent cells using methods described elsewhere [24, 25]. Large-scale expressions for the bicistronic plasmid of P450 4F11 construct #11 were performed in 2.8-l Fernbach flasks, with 500 ml TB media supplemented with 100 μg ml−1 ampicillin, 340 μg ml−1 thiamine, and 0.025% (v/v) of a mixture of trace elements [26] and incubated for 4 h at 37 °C with gyrorotary shaking at 220 rpm. After the addition of 1.0 mM isopropyl-β-D-1-thiogalactoside and 1.0 mM 5-aminolevulinic acid, cultures were further incubated at 27 °C for 40 h with gyrorotary shaking at 190 rpm in a New Brunswick Innova 4300 shaker (New Brunswick Scientific, Edison, NJ).
Purification of recombinant P450 4F11
All purification steps were performed at 4 °C. E. coli membranes (with the bicistronic plasmid of P450 4F11 construct #11) were prepared as described previously [24, 27]. The P450 4F11 membrane fractions from 3 l of culture were diluted in buffer A (20 mM potassium phosphate (pH 7.4) buffer conatining 20% glycerol (v/v), 0.5% sodium cholate (w/v), 0.5% Tergitol NP-10 (w/v), and 10 mM 2-mecaptoethanol). The mixture was stirred for 2 h and centrifuged at 105 × g for 30 min. The resulting supernatant, with NaCl added to a final concentration of 0.5 M, was loaded onto a Ni2+-NTA agarose column (Qiagen, Valencia, CA; 5 ml packed-bed volume, equilibrated with 10 column volumes of buffer A plus 0.5 M NaCl and 5 mM imidazole (buffer B)). The column was washed with 10 column volumes of buffer B, two column volumes of buffer B containing 25 mM imidazole, and one column volume of buffer B containing 50 mM imidazole, and P450 4F11 was then eluted (at a flow rate of 0.5 ml min−1) with buffer B containing 200 mM imidazole.
In order to remove the detergents, the eluted reddish fractions were applied to a Biogel HTP hydroxylapatite column (10 ml packed-bed volume, BioRad, Richmond, CA) using methods described previously [25, 28]. The column was equilibrated with 5 column volumes of 20 mM potassium phosphate buffer (pH 7.7) containing 20% glycerol (buffer C) and, after loading the P450, subsequently washed with buffer C until the A280 of the effluent was < 0.02. P450 4F11 was then eluted by increasing the potassium phosphate concentration to 0.7 M, with the addition of sodium cholate to a final concentration of 0.2% (w/v). The eluted P450 4F11 fractions were pooled and dialyzed overnight against 100 volumes of 100 mM potassium phosphate (pH 7.4) containing 20% glycerol (v/v) and 0.1 mM EDTA to remove cholate.
Other methods
UV-visible spectra were recorded using an Aminco DW-2a/OLIS spectrophotometer (On-Line Instrument Systems, Bogart, GA). P450 concentrations were estimated spectrally as described previously [29].
Sodium dodecyl sulfate-polyacrylamide gel electrophoresis was done using Ready Gel Tris-HCl gels (10%, w/v; Bio-Rad, Hercules, CA) and Laemmli buffer (Bio-Rad) [30]), and stained with Bio-Safe Coomassie stain (Bio-Rad) following the instructions provided by the manufacturer.
Separation of human liver extract using SPE columns
A CHCl3/CH3OH (2:1, v/v) extract of human liver homogenate was prepared, based on a procedure described in our previous work [19, 31]. Fractions of total human liver extract were separated using an aminopropyl SPE column (Thermo Scientific, Bellefonte, PA) based on a procedure previously described, with some modifications [32]. The aminopropyl column (0.5 g) was washed twice (gravity pressure) with 2 ml of hexane. The entire dry human liver extract (pooled from 0.6 g of each human liver sample from four different individuals, dissolved in 0.5 ml of CHCl3) was applied to the column. The column was then eluted (in order) with 4 ml of CHCl3/(CH3)2CHOH (2:1, v/v), 4 ml of 2% C2H5CO2H in (C2H5)2O, and 4 ml of CH3OH. The eluates recovered with each solvent mixture were collected and labeled as liver extract fractions 1 (neutral lipids), 2 (fatty acids), and 3 (phospholipids), respectively. All fractions were dried under a stream of N2, stored at −70 °C, and dissolved in 1.0 ml of DMSO as stock solutions prior to incubations with P450 4F11.
In vitro P450 incubations and steady-state kinetic analysis of P450 4F11 reactions
In vitro P450 incubations were done in 1.0 ml of 100 mM phosphate buffer (pH 7.4) containing purified human P450 4F11 (1.0 μM), NADPH-P450 reductase (2.0 μM), L-α-1,2-dilauroyl-sn-glycero-3-phosphocholine (75 μM), and an aliquot of the DMSO solution of human liver extract fraction (2%, v/v). For 16O2/18O2 isotopic labeling experiments, reactions were performed using the method described previously [18, 19]. The enzyme reaction was initiated by the addition of an NADPH-generating system including 100 μl of 100 mM glucose 6-phosphate, 50 μl of 10 mM NADP+, and 2 μl of a 1 mg ml−1 solution of yeast glucose 6-phosphate dehydrogenase [33]. All reaction mixtures were incubated at 37 °C for 20 min and quenched by adding 2 ml of a mixture of CHCl3/CH3OH (2:1, v/v). After centrifugation at 2 × 10³ × g for 40 min, the (lower) organic phase was carefully separated, dried under an N2 stream, and redissolved in 100 μl of CH3CN/H2O (2:1, v/v) mixture for LC-MS analysis (vide infra).
14C-Radiolabeled substrates were used for analysis of rates of oxidation of fatty acids, as previously described [19]. For steady-state kinetic studies, the concentration of the substrate containing radioactive fatty acid varied, ranging from 0 to 200 μM. The dried organic extract of the P450 reaction mixture was dissolved in 100 μl of CH3OH for HPLC analysis. HPLC separation was performed using a 4.6 mm × 150 mm Prodigy octadecylsilane (C18) column (5 μm; Phenomenex, Torrance, CA) with an isocratic mixture of 90% CH3OH/10% H2O (v/v) at a flow rate of 1.0 ml min−1. Radioactivity was determined in line with a β-RAM flow counter (IN/US Systems, Tampa, FL), with the scintillation cocktail pumped at a rate of 3.0 ml min−1.
In the incubations of P450 4F11 with 3-OH C16:0, the reaction mixtures were prepared in 1.0 ml of 100 mM phosphate buffer (pH 7.4) containing purified human P450 4F11 (0.1 μM), NADPH-P450 reductase (0.2 μM), L-α-1,2-dilauroyl-sn-glycero-3-phosphocholine (35 μM), cytochrome b5 (0.2 μM), and 3-OH C16:0 (100 μM). For kinetic analysis, the concentration range of the substrate was from 0 to 150 μM. Reactions were initiated with the NADPH-generating system described above, incubated at 37 °C for 10 min, and terminated by addition of 2 ml of ethyl acetate. After centrifugation (2 × 10³ × g for 10 min), the (upper) organic phase was carefully collected and dried under an N2 stream. The residues were dissolved in 80 μl of CH3CN, mixed with 20 μl of a 1 mg ml−1 PDAM solution (freshly prepared in ethyl acetate), and kept at room temperature for 90 min. The PDAM derivative of 3-OH C16:0 and its product were directly detected using an HPLC-UV method [11] with some modifications. The PDAM derivative of the product was separated using a 4.6 mm × 250 mm YMC ODS-AQ octadecylsilane (C18) column (5 μm; Waters, Milford, MA) with a linear gradient increasing from 95% to 100% CH3CN in H2O (v/v) over 12 min and held at 100% CH3CN for 5 min at a flow rate of 1.0 ml min−1. The UV absorbance (275 nm) was monitored using an Agilent 1200 series diode-array detector (Agilent Technologies, Palo Alto, CA). 16-OH C16:0 was used for a standard curve, as previously described [11].
For incubations of P450 4F11 and drugs (benzphetamine, erythromycin, and ethylmorphine), the mixture of purified human P450 4F11 and NADPH-P450 reductase was first dialyzed for 3 h against 100 volumes of 100 mM phosphate buffer (pH 7.4) containing 0.1 mM EDTA to remove glycerol, which contains trace amounts of interfering formaldehyde. The incubation was done in 200 μl of 100 mM phosphate buffer (pH 7.4) containing purified human P450 4F11 (1.0 μM), NADPH-P450 reductase (2.0 μM), L-α-1,2-dilauroyl-sn-glycero-3-phosphocholine (75 μM), and the drug substrate (1.0 mM). Reactions were initiated with the NADPH-generating system described above and terminated by the addition of 200 μl of CH3CN after incubation at 37 °C for 20 min. Each mixture was then reacted with 600 μl of a 0.5 mg ml−1 solution of dansylhydrazine (freshly prepared in CH3CN containing 0.3 %(v/v) CH3CO2H), incubated at room temperature for 15 min, and dried under an N2 stream. For measuring drug metabolism activity (N-demethylation) of P450 4F11, the residue of the reaction mixture (after dansylhydrazine derivatization) was redissolved in 100 μl of CH3CN and (an aliquot was) separated using the same HPLC column as described for 3-OH C16:0, with a linear gradient increasing from 50% to 100% CH3CN in H2O (v/v) over 12 min and held at 100% CH3CN for 5 min, at a flow rate of 1.0 ml min−1. Fluorimetric measurement of the formaldehyde adduct product was performed using a FL-750 Spectrofluorescence detector (McPherson Instruments, Acton, MA), with λexcitation 340 nm and λemission > 418 nm (filter).
LC-MS/MS metabolomics and data analysis
The procedures for LC-MS/MS assays and data analysis using the program DoGEX were as described in our previous work [19]. Briefly, the approach involves incubating a reconstituted P450 system with an extract of the tissue where it is normally expressed and a 1:1 ratio of 18O2/16O2. The 18O2/16O2 oxidation products appear as M and M+2 doublets and are identified using the program DoGEX, which searches for the doublets. IN pricnicple all such doublets (above the noise level) are products derived from oxidation of endogenous substrates. Further experiments are used to validate the positive hits.
LC separation was done using a Waters Acquity UPLC system (Waters, Milford, MA) with an Acquity UPLC BEH octadecylsilane (C18) column (1.7 μm; 1.0 mm × 100 mm) at 50 °C. The sample (10 μl) was subjected to the UPLC column and separated with a linear gradient from 95% mobile phase A, 10 mM NH4CH3CO2 in a 5:95 (v/v) CH3CN/H2O mixture, to 100% mobile phase B, 10 mM NH4CH3CO2 in a 95:5 (v/v) CH3CN/H2O mixture, over 20 min and held at 100% mobile phase B for 5 min at a flow rate of 0.1 ml min−1. MS/MS analysis was performed on a ThermoFinnigan LTQ ion trap mass spectrometer (ThermoFisher, Watham, MA) equipped with an electrospray ionization source, using the same instrument parameters as previously defined [19]. Data were acquired using a Finnigan Xcalibur software package. Analysis of the resulting LC-MS data was done with the Matlab-based computer program DoGEX, generating a matrix of integration areas versus retention time and molecular mass of all the detected chromatographic peaks [18]. The 18O2/16O2 oxidation products appearing as M and M+2 doublets were identified using the program DoGEX, with an isotopic ratio range of 0.95–1.9 via spectral filtering [18].
Spectral binding titrations
Binding assays of fatty acids and human P450 4F11 were done [19, 34] using an OLIS/DW-2a spectrophotometer. Varying concentrations of fatty acids (dissolved in C2H5OH) were added to a solution of purified P450 (2 μM) in 1.0 ml of 100 mM phosphate buffer (pH 7.4). The reference cuvette, containing the same concentration of enzyme in buffer, was titrated with an equal volume of the vehicle solvent (C2H5OH). The final concentration of C2H5OH was < 2% (v/v) in all cases. Visible spectra (350–500 nm) were recorded after each addition of fatty acid.
Characterization of oxidation products
Characterization of the oxidation products was performed by GC-MS as previously described [19] after preparing the corresponding TMS ethers. Each fatty acid (50 nmol generally, or 100 nmol of 3-OH C16:0) was used in each 1.0 ml reaction mixture for in vitro P450 incubations. Because only one product was formed from each fatty acid (as judged by initial LC-MS analysis), silylation was done directly on the in vitro incubation residue. For the unsaturated fatty acids, hydrogenation was performed prior to silylation [19]. The resulting TMS derivatives were analyzed by GC-MS in the electron impact mode.
Metabolic activation of procarcinogens by P450 4F11
The umu assay was carried out using a modification of the procedure described by Oda et al. [35, 36] in a 96-well microplate version (Supplemental Fig. S3). Salmonella typhimurium NM2009 (TA1535/pSK1002/pNM12) [37] was used as the bacterial test strain. The incubation mixture included the bacteria, a recombinant P450 system, procarcinogen, and an NADPH-generating system. As a positive control E. coli Top10 bicistronic membrane fractions containing P450 1B1 (0.01 μM) and NADPH-P450 reductase were used.
The induction of the umuC gene expression (as a response to DNA damage) was determined by measuring cellular β-galactosidase activity (absorbance at 405 and 490 nm) using following equation:
where t is the time of the assay and V is the volume of the culture used in the assay (in ml).
Results
Expression and purification of recombinant P450 4F11
Expression trials with seven P450 4F11 constructs (with different N-terminal sequences, Table 1) were done in different E. coli strains (DH5α, DH5α plus the chaperon groEL/ES, TOP10, XL10-gold, XL-Blue, and BL21) (data not shown). The longer version of P450 4F11, construct #11 (with the hydrophobic sequence preserved), yielded the highest expression level, ~ 230 nmol of correctly folded P450 from a 3-l E. coli BL21 culture (Table 2).
Table 2.
Purification of human P450 4F11 from E. coli membrane fractions.
| Purification step | P450 (nmol) | Yield (%) |
|---|---|---|
| Membranes | 227 | 100 |
| Solubilized fractiona | 214 | 94 |
| Ni2+-NTA column fractionb | 106 | 47 |
| Hydroxylapatite column fractionc | 73 | 32 |
Solubilization using a mixture of sodium cholate plus Tergitol NP-10, followed by centrifugation to remove insoluble material.
P450 eluted with 200 mM imidazole.
Eluted with 0.7 M potassium phosphate buffer (pH 7.7) containing 0.2% sodium cholate (w/v).
Purification of human P450 4F11 (containing a C-terminal (His)6 tag) is summarized in Table 2. The detergents sodium cholate and Tergitol NP-10 were selected for solubilization. The recovery of spectrally-measured P450 was 94% after solubilization and separation from the unsolubilized membranes by ultracentrifugation. Following purification using a Ni2+-NTA column, the detergent Tergitol NP-10 and some other residual proteins were removed using chromatography on hydroxylapatite [25, 28]. Purified P450 4F11, showing a single band at ~50 kDa (Fig. 1), was obtained with an overall recovery of 32% (Table 2).
Fig. 1.
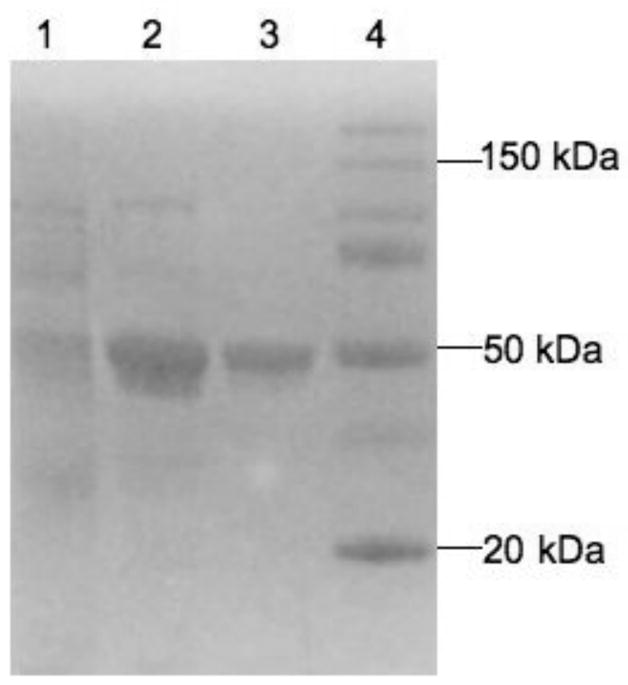
Sodium dodecyl sulfate-polyacrylamide gel electrophoresis of recombinant P450 4F11. See Table 2. Lane 1, solubilized membrane fraction (10 pmol P450); lane 2, Ni2+-NTA agarose-purified fraction (66 pmol P450); lane 3, hydroxylapatite-purified fraction (23 pmol P450); lane 4, protein Mr markers.
Purified P450 4F11 exhibited typical spectra for P450 enzymes (Fig. 2A). Second-derivative analysis of the ferric enzyme indicated that ~98% of the ferric iron was in the low-spin state (judged by the relative intensities of the bands at 390 and 418 nm in the spectrum [38, 39]) (Fig. 2B). The Fe2+•CO vs. Fe2+ difference spectrum showed a ⌊max at 451 nm, with a small amount of (inactive) cytochrome P420 (Fig. 2C).
Fig. 2.

Spectra of purified P450 4F11. (A) Absorbance spectra of P450 4F11 (ferric and ferrous spectra). The P450 concentration was 2.0 μM, and the ferrous spectrum was recorded following reduction with Na2S2O4. (B) Second derivative of absorbance spectrum (ferric state). (C) Fe2+•CO vs. Fe2+ difference spectrum. The P450 concentration was 2.2 μM (⌊max 451 nm).
Searches for P450 4F11 substrates in human liver extract
Substrate searches were done using an LC-MS metabolomic and isotopic labeling approach (developed in our previous work [19]) with purified P450 4F11 and human liver extract fractions 1, 2, and 3. Each reaction mixture was analyzed using UPLC-MS in both the negative and positive ion modes in order to profile as many metabolites as possible. However, no peaks with the characteristic 16O/18O isotopic signatures (derived from O2) were detected for the incubations of P450 4F11 with liver extract fraction 1 (neutral lipids) or 3 (phospholipids). The DoGEX program results for the analysis of liver extract fraction 2 (fatty acids) incubated with P450 4F11 showed several potential products in the negative ion mode (Fig. 3). Four different doublets (m/z 273/271, 299/297, 321/319, and 345/343) were identified and verified by comparisons of the P450 4F11/liver extract fraction 2 samples from experiments with and without NADPH using Xcalibur (Waters UPLC-MS software package) (Fig. 4, i.e. a set of LC-MS data showing typical peaks and control data, not directly related to the kinetic analysis, vide infra). All of the peaks (Fig. 4, marked with ovals) were found in the sample incubated with NADPH but not in the sample without NADPH. The results were further confirmed by comparison with the incubation with no addition of the P450 (results not shown). All four m/z doublets identified by the DoGEX program were finally judged to be oxidation products (formed from the reaction of liver extract fraction 2 with human P450 4F11), on the basis of their tR and m/z values being identical in Xcalibur and the DoGEX program.
Fig. 3.
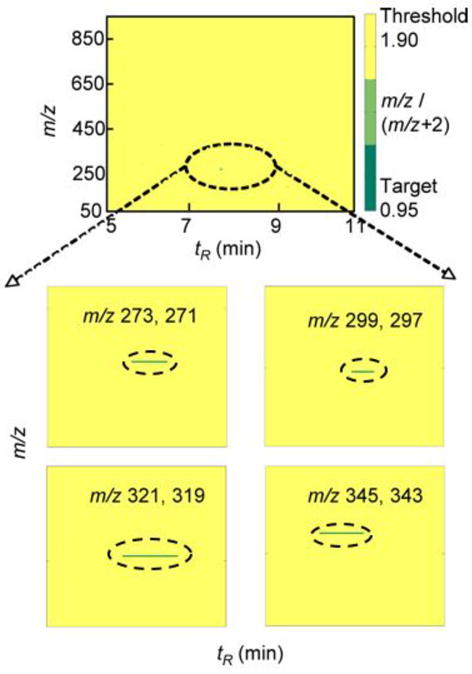
DoGEX results of substrate search with liver extract fraction 2 and human P450 4F11. The green regions indicate that the ratio of chromatographic peaks (m/z and m/z+2) is close to 0.95 (the lower limit of the target ratio) and the yellow area shows all the values beyond the threshold value. Positive values (approaching the target of 0.95, and circled with broken ovals) were found for four different pairs of peaks, subsequently identified, in the tR 7–9 min region and are shown in the expanded sections.
Fig. 4.

Comparison of LC-MS analysis for incubation of P450 4F11 and liver extract fraction 2 with (A) and without (B) the NADPH-generating system. The y-axis shows the trace at each indicated m/z value, and the sensitivity is indicated on each trace. The tR values (in ovals) indicate the (ω−) hydroxylated fatty acid products.
The molecular masses of the potential substrates corresponding to the identified doublets were deduced as 256, 282, 304, and 328, based on the method described previously [19]. Moreover, MS fragmentation analysis (Supplemental Table S2), knowledge of the nature of the components of each liver extract fraction obtained from SPE columns (as described elsewhere [32]), and the LIPIDMAPS database (http://www.lipidmaps.org) suggested that the fatty acids C16:0, C18:1, C20:4, and C22:6 were the most likely substrates in the P450 4F11 reactions. All four fatty acids were confirmed as substrates in human liver for P450 4F11 by incubations of authentic fatty acids with purified P450 4F11 (vide infra).
Spectral binding titrations
3-OH C16:0 has been reported to be catalyzed by P450 4F11 to form the ω-hydroxylation product [11]. Therefore, interactions of the fatty acids C16:0, C18:1, C20:4, C22:6, and also 3-OH C16:0 with P450 4F11 were investigated. The spectral changes induced by binding of the fatty acids to P450 4F11 are shown in Supplemental Fig. S1. Kd values were estimated from the titration curves of ΔAmax versus the concentrations of fatty acids (Table 3). C16:0 and C18:1 exhibited typical “Type I” and “Type II” difference spectra2 [34] with P450 4F11, respectively, with micromolar affinity. Titration of P450 4F11 with C20:4 or C22:6 yielded no real spectral changes (ΔA390 < 0.005 at a substrate concentration of 50 μM, only a decrease at 418 nm). 3-OH C16:0 seemed to exhibit an unusual but reproducible mix of Type I and II binding to P450 4F11, with apparent Kd values of 69 ± 14 and 98 ± 16 μM, respectively.
Table 3.
Spectral titration of human P450 4F11 with fatty acids.
| Fatty acid | ΔAmax | Ksa (μM) |
|---|---|---|
| C16:0 | 0.047 ± 0.006 b | 40 ± 11 |
| C18:1 | 0.037 ± 0.003 c | 71 ± 14 |
| C20:4 | -d | - |
| C22:6 | - | - |
| 3-OH C16:0 | 0.062 ± 0.006 b | 69 ± 14 |
| 0.065 ± 0.006 c | 98 ± 16 |
See Supplemental Data, Fig. S1. Estimated from the hyperbolic fitting plot of ΔAmax versus the fatty acid concentration using a hyperbolic equation in GraphPad Prism software (GraphPad Software, San Diego, CA).
Difference in absorbance between the absorbance maximum at 388 nm and minimum at 418 nm, ΔA388 − A418.
Difference in absorbance between the absorbance maximum at 438 nm and minimum at 418 nm, ΔA438 − A418.
–, no detectable binding (ΔA388 < 0.005 at 50 μM).
Characterization of oxidation products
GC-MS assays of TMS derivatives were used to identify the oxidation products of P450 4F11 reactions. All products were characterized as ω-hydroxylated fatty acids (Table 4) based on a prominent ion fragment at m/z 103 (CH2-O-SiMe3+) considered specific to ω-hydroxylation of fatty acids [11, 40]. The GC-mass spectrum of the hydroxylation product of the incubation of C16:0 with P450 4F11 is shown as an example (Supplemental Fig. S2). These results are consistent with previous literature on P450 4F11 and 3-hydroxy C16:0, which was also analyzed as the TMS derivative [11].
Table 4.
EI GC-MS analysis of TMS derivatives of the oxidation products of fatty acids produced by human P450 4F11.
| Substrate | [M+] | Major fragment ions | Product |
|---|---|---|---|
| C16:0 | 416 | 103/311/385/401 a | ω-OH |
| C18:1 | 444 | 103/339/413/429 | ω-OH |
| C20:4 | 472 | 103/367/441/457 | ω-OH |
| C22:6 | 500 | 103/395/469/485 | ω-OH |
| 3-OH C16:0 | 504 | 103/399/489 | ω-OH |
A GC-mass spectrum of the hydroxylation product is shown in Supplemental Data Fig. S2.
Steady-state kinetic analysis of P450 4F11 reactions
Analyses for all the products (Fig. 4, plus 3,16-diOH C16:0) were done as described in Materials and Methods, and the kinetic parameters kcat and Km are summarized (Table 5). The catalytic efficiency (kcat/Km) measured for the oxidation of C16:0 catalyzed by P450 4F11 was ~3 fold higher than that measured for the reaction of P450 4F11 with C18:1. With the reactions of P450 4F11 with the longer carbon chains and more unsaturation (C20:4 and C22:6), the kcat/Km values were lower than for C16:0 and C18:1. The ω-hydroxylation reaction with 3-OH C16:0 yielded kcat/Km = 0.37 ± 0.14 min−1 M−1 (10-fold higher than for C16:0), comparable with a previous result [11].
Table 5.
Steady-state kinetics analysis of oxidations of fatty acids by human P450 4F11.
| Fatty acid | kcat (min−1) | Km (μM) | kcat/Km (min−1 μM−1) |
|---|---|---|---|
| C16:0 | 1.8 ± 0.1 | 47 ± 4 | 0.038 ± 0.004 |
| C18:1 | 1.0 ± 0.1 | 85 ± 10 | 0.012 ± 0.002 |
| C20:4 | 0.54 ± 0.06 | 80 ± 21 | 0.007 ± 0.002 |
| C22:6 | 0.35 ± 0.04 | 48 ± 14 | 0.007 ± 0.002 |
| 3-OH C16:0 | 27.5 ± 4.5 | 74 ± 26 | 0.37 ± 0.14 |
P450 4F11 was previously reported [10] to be a catalyst for some drug N-demethylation reactions. N-Demethylation rates with benzphetamine, erythromycin, and ethylmorphine were 0.83, 0.91, and 0.87 min−1, respectively, which are higher than reported previously (0.25, 0.81, and 0.18 min−1, respectively) [10].
Lack of metabolic activation of procarcinogens by P450 4F11
In order to investigate a potential role of P450 4F11 in the metabolic activation of procarcinogens, genotoxicity was evaluated by measuring β-galactosidase activity in S. typhimurium tester strain NM2009, using compounds previously reported to be pro-carcinogens bioactivated by other P450s, e.g. 1B1, 1A1, 3A4 [37, 41]. Following general screening of the umuC gene induction (Supplemental Fig. S3A), some of the compounds that showed an apparent induction of β-galactosidase activity were evaluated at different concentrations (benzo[a]pyrene and aflatoxin B1) (Supplemental Fig. S3B). P450 4F11 did not bioactivate any of these procarcinogens. Responses with P450 1B1 (positive control [41]) were observed under these experimental conditions.
Discussion
An expression system has been developed for human P450 4F11 in E. coli BL21, with a reasonable expression level (Table 2). The P450 was purified and showed typical spectral properties, with a ⌊max at 451 nm for the reduced P450-CO complex (Fig. 2). Untargeted substrate searches for P450 4F11 were done using an LC-MS metabolomic and isotopic labeling approach [19] in different human liver extract fractions (Figs. 3 and 4). The fatty acids C16:0, C18:1, C20:4, and C22:6 were identified as substrates in human liver for P450 4F11. Binding assays were done for human P450 4F11 with the four identified fatty acids, as well as the previously identified substrate 3-OH C16:0 [11]. We presently have no explanation for the unusual behavior of the spectral binding for some of the fatty acids with P450 4F11 (Table 3 and Supplemental Fig. S1), especially in the cases of C18:1 and 3-OH C16:0, which show repeatable Type II binding2 to P450 4F11. The oxidation products of the fatty acids formed by P450 4F11 were all characterized as ω-hydroxylated fatty acids (Table 4), and the steady-state kinetic analysis was done (Table 5). The catalytic efficiencies for the P450 4F11 reactions are comparable with those measured for some other hepatic P450s, e.g. 1A2, 2C8, and 2C9 [19]. The studies on other P450 4F11 reactions (including drug N-demethylation and procarcinogen activation) indicated that P450 4F11 shows low activity for the drugs benzphetamine, erythromycin, and ethylmorphine (compared with many common P450 drug oxidations [3, 42]) and no detectable activity for activating procarcinogens (Supplemental Fig. S3).
Previously the heterologous expression and catalytic function analysis of P450 4F11 have received very limited attention. Recombinant P450 4F11 was expressed in a yeast system and the isolated microsomes were used directly in assays (without P450 purification or addition of mammalian NADPH-P450 reductase) for the evaluation of P450 4F11 catalytic properties with some endogenous eicosanoids and drugs [10]. In addition, baculovirus constructs of P450 4F11 were expressed in insect cells but no details were provided regarding expression or purification, although the P450 was used for the investigation of ω-hydroxylation of two β-hydroxy fatty acids [11].
Our present work appears to be the first report of heterologous expression of human P450 4F11 in bacteria (E. coli BL21) and purification. The recombinant P450 system containing purified P450 4F11 and mammalian NADPH-P450 reductase (for in vitro incubations) exhibited higher catalytic activity towards the fatty acids and the drugs than the microsomes prepared from the yeast system [10]. Furthermore, the present study provides an example of successful application of the LC-MS metabolomics and the program DoGEX approach [19] to identify endogenous substrates in tissue extracts for orphan human P450s, e.g. P450 4F11. Four fatty acids were efficiently identified as potential substrates for human P450 4F11, illustrating not only the power of an untargeted metabolomic approach but also the metabolism of fatty acids by P450 4F11, although the physiological relevance of these reactions remains to be established.
Based on our previous work [19], fatty acids are major components in human liver but they may affect the detection of other trace but interesting compounds during searches for substrates. An aminopropyl SPE column [32] was used to isolate the fatty acid fraction from other classes of lipids in human liver extract prior to in vitro P450 incubation. However, the results of untargeted searches in each liver extract fraction indicate that only the fatty acids were detected as substrates for human P450 4F11. It is unclear if fatty acids are actually the main substrates for human P450 4F11 or whether they are just more readily detected than other compounds during LC-MS assays and metabolomics. Chemical derivatization methods are being developed to improve the sensitivity of MS detection of small molecules in biological samples.
Supplementary Material
Acknowledgments
This work was supported in part by Grants R37 CA090426 and P30 ES00267 from the United States Public Health Service. We thank D. L. Hachey and M. W. Calcutt for mass spectrometry assistance and discussions and A. R. Brash for use of a hydrogenation system.
Footnotes
Abbreviations used: C16:0, palmitic acid; 3-OH C16:0, 3-hydroxypalmitic acid; 16-OH C16:0, 16-hydroxypalmitic acid; 3,16-diOH C16:0, 3,16-dihydroxypalmitic acid; C18:1, oleic acid; C20:4, arachidonic acid; C22:6 docosahexaenoic acid; DMSO, dimethylsulfoxide; GC-MS, gas chromatography-mass spectrometry; LC-MS, liquid chromatography-mass spectrometry; MS, mass spectrometry; NTA, nitrilotriacetate; P450, cytochrome P450 (also termed heme-thiolate P450 [1]; PDAM, 1-pyrenyldiazomethane; SPE, solid phase extraction; TB, terrific broth (medium); TMS, trimethylsilyl.
Ligands displacing a distal water molecule from the heme iron of P450 enzymes change the state of the heme iron from low-spin to high-spin, which gives rise to a “Type I” change in the spectral properties of the enzyme, with an increase in absorbance at ~390 nm and a decrease at ~420 nm. “Type II” binding (ligands that bind directly to the heme iron of P450 enzymes) give rise to a difference spectrum with a maximum at ~430 nm and a minimum at ~418 nm [34].
Supplementary data associated with this article can be found in the online version.
Publisher's Disclaimer: This is a PDF file of an unedited manuscript that has been accepted for publication. As a service to our customers we are providing this early version of the manuscript. The manuscript will undergo copyediting, typesetting, and review of the resulting proof before it is published in its final citable form. Please note that during the production process errors may be discovered which could affect the content, and all legal disclaimers that apply to the journal pertain.
References
- 1.Palmer G, Reedijk J. J Biol Chem. 1992;267:665–677. [Google Scholar]
- 2.Ortiz de Montellano PR, editor. Cytochrome P450: Structure, Mechanism, and Biochemistry. 3. KluwerAcademic/Plenum Publishers; New York: 2005. [Google Scholar]
- 3.Guengerich FP. In: Cytochrome P450: Structure, Mechanism, and Biochemistry. 3. Ortiz de Montellano PR, editor. KluwerAcademic/Plenum Publishers; New York: 2005. pp. 377–530. [Google Scholar]
- 4.Guengerich FP, Wu ZL, Bartleson CJ. Biochem Biophys Res Commun. 2005;338:465–469. doi: 10.1016/j.bbrc.2005.08.079. [DOI] [PubMed] [Google Scholar]
- 5.Stark K, Guengerich FP. Drug Metab Rev. 2007;39:627–637. doi: 10.1080/03602530701467708. [DOI] [PubMed] [Google Scholar]
- 6.Cui X, Nelson DR, Strobel HW. Genomics. 2000;68:161–166. doi: 10.1006/geno.2000.6276. [DOI] [PubMed] [Google Scholar]
- 7.Kikuta Y, Kusunose E, Kusunose M. Prostaglandins Other Lipid Mediat. 2002;68–69:345–362. doi: 10.1016/s0090-6980(02)00039-4. [DOI] [PubMed] [Google Scholar]
- 8.Kalsotra A, Strobel HW. Pharmacol Ther. 2006;112:589–611. doi: 10.1016/j.pharmthera.2006.03.008. [DOI] [PubMed] [Google Scholar]
- 9.Hsu MH, Savas U, Griffin KJ, Johnson EF. Drug Metab Rev. 2007;39:515–538. doi: 10.1080/03602530701468573. [DOI] [PubMed] [Google Scholar]
- 10.Kalsotra A, Turman CM, Kikuta Y, Strobel HW. Toxicol Appl Pharmacol. 2004;199:295–304. doi: 10.1016/j.taap.2003.12.033. [DOI] [PubMed] [Google Scholar]
- 11.Dhar M, Sepkovic DW, Hirani V, Magnusson RP, Lasker JM. J Lipid Res. 2008;49:612–624. doi: 10.1194/jlr.M700450-JLR200. [DOI] [PubMed] [Google Scholar]
- 12.Saghatelian A, Cravatt BF. Curr Opin Chem Biol. 2005;9:62–68. doi: 10.1016/j.cbpa.2004.12.004. [DOI] [PubMed] [Google Scholar]
- 13.Schlotterbeck G, Ross A, Dieterle F, Senn H. Pharmacogenomics. 2006;7:1055–1075. doi: 10.2217/14622416.7.7.1055. [DOI] [PubMed] [Google Scholar]
- 14.Pan Z, Raftery D. Anal Bioanal Chem. 2007;387:525–527. doi: 10.1007/s00216-006-0687-8. [DOI] [PubMed] [Google Scholar]
- 15.Want EJ, Cravatt BF, Siuzdak G. Chembiochem. 2005;6:1941–1951. doi: 10.1002/cbic.200500151. [DOI] [PubMed] [Google Scholar]
- 16.Chen C, Gonzalez FJ, Idle JR. Drug Metab Rev. 2007;39:581–597. doi: 10.1080/03602530701497804. [DOI] [PMC free article] [PubMed] [Google Scholar]
- 17.Dettmer K, Aronov PA, Hammock BD. Mass Spectrom Rev. 2007;26:51–78. doi: 10.1002/mas.20108. [DOI] [PMC free article] [PubMed] [Google Scholar]
- 18.Sanchez-Ponce R, Guengerich FP. Anal Chem. 2007;79:3355–3362. doi: 10.1021/ac0622781. [DOI] [PMC free article] [PubMed] [Google Scholar]
- 19.Tang Z, Martin MV, Guengerich FP. Anal Chem. 2009;81:3071–3078. doi: 10.1021/ac900021a. [DOI] [PMC free article] [PubMed] [Google Scholar]
- 20.Hanna IH, Teiber JF, Kokones KL, Hollenberg PF. Arch Biochem Biophys. 1998;350:324–332. doi: 10.1006/abbi.1997.0534. [DOI] [PubMed] [Google Scholar]
- 21.Yun CH, Kim KH, Calcutt MW, Guengerich FP. J Biol Chem. 2005;280:12279–12291. doi: 10.1074/jbc.M411019200. [DOI] [PubMed] [Google Scholar]
- 22.Barnes HJ, Arlotto MP, Waterman MR. Proc Natl Acad Sci U S A. 1991;88:5597–5601. doi: 10.1073/pnas.88.13.5597. [DOI] [PMC free article] [PubMed] [Google Scholar]
- 23.Parikh A, Gillam EMJ, Guengerich FP. Nat Biotechnol. 1997;15:784–788. doi: 10.1038/nbt0897-784. [DOI] [PubMed] [Google Scholar]
- 24.Gillam EMJ, Baba T, Kim BR, Ohmori S, Guengerich FP. Arch Biochem Biophys. 1993;305:123–131. doi: 10.1006/abbi.1993.1401. [DOI] [PubMed] [Google Scholar]
- 25.Wu ZL, Bartleson CJ, Ham AJL, Guengerich FP. Arch Biochem Biophys. 2006;445:138–146. doi: 10.1016/j.abb.2005.11.002. [DOI] [PubMed] [Google Scholar]
- 26.Sandhu P, Baba T, Guengerich FP. Arch Biochem Biophys. 1993;306:443–450. doi: 10.1006/abbi.1993.1536. [DOI] [PubMed] [Google Scholar]
- 27.Guengerich FP, Martin MV. Methods in Molecular Genetics. In: Phillips IR, Shephard E, editors. Cytochrome P450 Protocols. Academic Press; Orlando, FL: 2006. pp. 31–37. [Google Scholar]
- 28.Haugen DA, van der Hoeven TA, Coon MJ. J Biol Chem. 1975;250:3567–3570. [PubMed] [Google Scholar]
- 29.Omura T, Sato R. J Biol Chem. 1964;239:2370–2378. [PubMed] [Google Scholar]
- 30.Laemmli UK. Nature. 1970;227:680–685. doi: 10.1038/227680a0. [DOI] [PubMed] [Google Scholar]
- 31.Folch J, Lees M, Stanley GHS. J Biol Chem. 1957;226:497–509. [PubMed] [Google Scholar]
- 32.Kaluzny MA, Duncan LA, Merritt MV, Epps DE. J Lipid Res. 1985;26:135–140. [PubMed] [Google Scholar]
- 33.Guengerich FP, Bartleson CJ. In: Principles and Methods of Toxicology. 5. Hayes AW, editor. CRC Press; Boca Raton, FL: 2007. pp. 1981–2048. [Google Scholar]
- 34.Schenkman JB, Remmer H, Estabrook RW. Mol Pharmacol. 1967;3:113–123. [PubMed] [Google Scholar]
- 35.Oda Y, Watanabe T, Terao Y, Nukaya H, Wakabayashi K. Mut Res. 2008;654:52–57. doi: 10.1016/j.mrgentox.2008.04.013. [DOI] [PubMed] [Google Scholar]
- 36.Oda Y, Funasaka K, Kitano M, Nakama A, Yoshikura T. Environ Mol Mut. 2004;43:10–19. doi: 10.1002/em.10209. [DOI] [PubMed] [Google Scholar]
- 37.Shimada T, Oda Y, Yamazaki H, Mimura M, Guengerich FP. Methods in Molecular Genetics. In: Adolph KW, editor. Gene and Chromosome Analysis. 5. Academic Press; Orlando, FL: 1994. pp. 342–355. [Google Scholar]
- 38.O’Haver TC, Green GL. Anal Chem. 1976;48:312–318. [Google Scholar]
- 39.Guengerich FP. Biochemistry. 1983;22:2811–2820. doi: 10.1021/bi00281a007. [DOI] [PubMed] [Google Scholar]
- 40.Holmes VE, Bruce M, Shaw PN, Bell DR, Qi FM, Barrett DA. Anal Biochem. 2004;325:354–363. doi: 10.1016/j.ab.2003.10.046. [DOI] [PubMed] [Google Scholar]
- 41.Shimada T, Hayes CL, Yamazaki H, Amin S, Hecht SS, Guengerich FP, Sutter TR. Cancer Res. 1996;56:2979–2984. [PubMed] [Google Scholar]
- 42.Guengerich FP, Dannan GA, Wright ST, Martin MV, Kaminsky LS. Biochemistry. 1982;21:6019–6030. doi: 10.1021/bi00266a045. [DOI] [PubMed] [Google Scholar]
Associated Data
This section collects any data citations, data availability statements, or supplementary materials included in this article.