

Summary
Though challenging, solution NMR spectroscopy allows fundamental interrogation of the structure and dynamics of membrane proteins. One major technical hurdle in studies of helical membrane proteins by NMR is the difficulty of obtaining sufficient long range NOEs to determine tertiary structure. For this reason, long range distance information is sometimes sought through measurement of paramagnetic relaxation enhancements (PRE) of NMR nuclei as a function of distance from an introduced paramagnetic probe. Current PRE interpretation is based on the assumption of Lorentzian resonance lineshapes. However, in order to optimize spectral resolution, modern multidimensional NMR spectra are almost always subjected to resolution-enhanment, leading to distortions in the Lorentizian peak shape. Here it is shown that when PREs are derived using peak intensities (i.e., peak height) and linewidths from both real and simulated spectra that were produced using a wide range of apodization/window functions, that there is little variation in the distances determined (<1 angstrom at the extremes). This indicates that the high degree of resolution enhancement required to obtain well-resolved spectra from helical membrane proteins is compatible with the use of PRE data as a source of distance restraints. While these conclusions are particularly important for helical membrane proteins, they are generally applicable to all PRE measurements made using resolution-enhanced data.
Keywords: Membrane Protein, paramagnetic relaxation enhancement, PRE, NMR, apodization, diacylglycerol kinase, KCNE1, amyloid, spin-labeling, structure
Introduction
Integral membrane proteins (IMPs) reside in lipid bilayers and play important roles in a variety of biological processes such as signal transduction, cellular recognition and communication, enzyme catalysis, and transmembrane ion transport. Membrane proteins constitute an important category of drug targets; G protein-coupled receptors alone are thought to be targeted by over 50% of commercial therapeutics[1-8]. Moreover, membrane protein misfolding is integrally involved in several human disease states (e.g., cystic fibrosis, Charcot-Marie-Tooth disease), providing additional rationale for investigation[9-11].
Membrane protein structural biology is hampered by technical challenges associated with protein expression, folding, and purification. Solution NMR faces additional hurdles because of the inverse relationship between particle size and both spectral sensitivity and resolution. This spectroscopic limitation is particularly problematic for membrane proteins because the requirement for a membrane mimetic (e.g., detergent micelle) usually results in a large increase in the effective mass of the protein under study. Compounding this problem is the inherently narrow 1H spectral dispersion of α-helical membrane proteins. These issues help to account for the comparatively limited number of multi-span helical membrane protein structures elucidated to date by NMR.
Long-range distance restraints are critical for successful solution NMR structure determination. The traditional source of such restraints is nuclear Overhauser effect (NOE) measurements, which reveal pairs of atoms that are close in space (< 5 Å). However, difficulties in completing side chain resonance assignments for α-helical membrane proteins typically limit the number of long range NOEs that can be measured for this class of proteins.
In situations where NOE data have proven limited, the use of distances derived from paramagnetic relaxation enhancement (PRE) have provided supplemental restraints to permit characterization of the global folds of some proteins[12, 13]. PRE data, which provide distance restraints between atomic nuclei and paramagnetic centers, have been shown to improve the NMR structural ensemble (i.e., reduced RMSD) and to robustly correlate with the distances measured from crystal structures[12-18]. PREs have also found use in qualitatively measuring hydrophilic and hydrophobic accessibility of protein sites to non-covalently linked paramagnetic probes. This qualitative technique can be used to determine membrane protein orientation and topological properties[19-21].
The present work explores the use of quantitative PREs in α-helical membrane protein structural studies, especially as it relates to proper practical implementation. Specifically, we evaluate the window functions commonly used in NMR data signal processing and the resulting effects on the calculated distances used as structural constraints.
As a basis for evaluation, we compare PRE measurements from three different α-helical membrane proteins: C99, DAGK, and KCNE1 (Figure 1). A brief description of these proteins follows.
Figure 1.
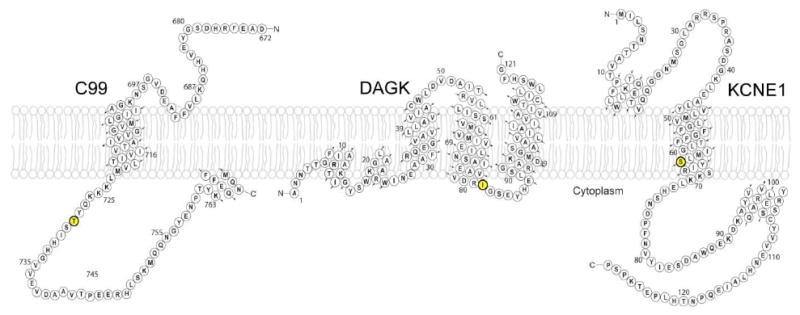
Topology plots of the three α-helical membrane proteins used in the study to probe the practical relationship between the application of window functions and PRE-derived distances. C99 (left) is 99 residues in length and has been spin-labeled at T729C. DAGK (middle) is 121 residues in length and was spin-labeled at I82C, and KCNE1 (right) is 129 residues in length and spin-labeled at S64C. The spin-labeled sites are highlighted in yellow.
Diacylglycerol kinase (DAGK) is an integral membrane protein with enzymatic activity vital to the membrane-derived oligosaccharide cycle[22, 23] and has been implicated as a virulence factor in tooth decay[24]. DAGK is a 40 kDa homotrimer with each subunit comprising 121 residues and three transmembrane helices[25, 26].
The amyloid precursor protein (APP) is an integral membrane protein that undergoes proteolytic processing by β-secretase to yield a 99 residue transmembrane C-terminus, C99 and the soluble APP ectodomain (sAPPβ)[27]. C99 is subsequently cleaved intramembranously by γ-secretase, thereby releasing the β-amyloid (Aβ) peptide, which is implicated causatively in the pathogenesis of Alzheimer's disease[28]. The secondary structure and membrane topology of C99 have been described by NMR[20].
KCNE1, also known as minK, is a 129-residue protein containing a single transmembrane domain that is involved in regulation of voltage-gated potassium channels[29, 30]. KCNE1 interacts with the KCNQ1 channel in heart muscle cells to generate the slowly activating cardiac potassium current (IKs), an important determinant of myocardial repolarization. Mutations in KCNE1 are responsible for human disease such as Long QT syndrome[6]. The structure of KCNE1 has been determined using solution NMR, with this structure being used as the basis for a comprehensive model describing how it modulates the channel function of KCNQ1[29].
Materials, Methods, and Background Theory
Protein Overexpression and Purification
C99[20], DAGK[26, 31], and KCNE1[30] were overexpressed and purified as previously described.
Spin-labeling Procedure
KCNE1
Ser64Cys KCNE1 was subjected to spin-labeling at the single cysteine present in each mutant by reaction with the thiol-activated nitroxide spin-label 1-oxyl-2,2,5,5-tetramethyl-3-pyrroline-3-methyl)-methanethiosulfonate (MTSL, Toronto Research Chemicals, Toronto). The NMR sample contained ∼2% LMPG (Sodium 1-myristoyl-2-hydroxy-sn-glycero-3-phospho-(1′-rac-glycerol)), 250 mM imidazole (pH 6.0), and 10% D2O. Detailed methods of sample purification and site directed spin labeling are found in previous work[29].
DAGK
15N-labeled single-cysteine DAGK mutants used in PRE measurements were spin-labeled with MTSL as described elsewhere[26]. The DAGK NMR sample conditions were ∼2% DPC (1,2-Dihexanoyl-sn-Glycero-3-Phosphocholine), 100 mM imidazole, 0.5% EDTA, 10% D2O, at pH 6.5. The single cysteine Ile82Cys DAGK mutant was spin-labeled and subjected to PRE measurements (Figure 1).
C99 (The C-terminal transmembrane domain of APP)
A single-cysteine mutant form of C99 (Thr729Cys) was purified in 250 mM imidazole (pH 6.5) and 0.1% LMPG, spin-labeled at its lone cysteine via reaction with MTSL, and subsequently concentrated with an Amicon centrifugal filter device for PRE measurements. The NMR sample contained ca 10 mg/mL C99, 5% LMPG, 250mM imidazole (pH 6.5), 1mM EDTA, 10% D2O.
After collection of paramagnetic NMR data, the nitroxide free radical was reduced with the addition of a six-fold molar excess of ascorbic acid (6:1 MTSL: protein monomer) to the NMR sample which creates diamagnetic conditions.
Paramagnetic Relaxation Enhancement (PRE) NMR Measurements and Analysis
DAGK and C99 PRE experiments were run at 18.8 Tesla on a Bruker Avance 800 spectrometer with a 5 mm triple resonance TCI z-gradient (CPTCI-Z) cryoprobe at 45 °C. KCNE1 PRE experiments were run at 14.1 Tesla on a Bruker Avance 600 spectrometer with a 5 mm triple resonance, triple gradient (TXI-XYZ) room temperature probe at 40 °C.
Matched 1H-15N TROSY HSQC experiments were carried out on the spin-labeled proteins in the paramagnetic and diamagnetic states. 16, 164, and 176 transients were used to ensure high quality data for KCNE1, DAGK, and C99 respectively. The spectra from each pair of paramagnetic and diamagnetic samples were processed with nmrPipe using different window functions (Table 1) and analyzed in Sparky to measure PRE-based differences in peak intensities (height) (I) and also the linewidth at half maximal height of each peak under diamagnetic conditions (ΔνFWHM)[32, 33]. Note that we equate the terms peak intensity and peak height for the context of this work. The linewidth and intensity values were obtained by fitting the resonances to an appropriate lineshape depending on the window function utilized. The data that had either no window function applied or exponential multiplication were fit to a Lorentzian lineshape, while the data processed with a Lorentzian-to-Gaussian or shifted sine-bell window function were fit to a Gaussian lineshape.
Table 1.
| Window Functions Evaluated | |
|---|---|
| No function | Sine π/2 |
| EM 1 Hz | Sine π/3 |
| EM 5 Hz | Sine π/4 |
| EM 10 Hz | Sine π/6 |
| GM 5 Hz* | Sine2 π/2 |
| GM 15 Hz* | Sine2 π/3 |
| GM 20 Hz* | Sine2 π/4 |
| Sine2 π/6 | |
The values listed in the table are for the exponentials applied in the Lorentzian-to-Gaussian function; the line broadening was held constant at 20 Hz.
Conversion of PRE Measurements to Distances
In order to extract distance restraints for the PRE data, intensity ratios of correlated peaks from the oxidized and reduced spectra were converted into paramagnetic relaxation rate enhancements (Γ2) by estimating the additional transverse relaxation needed to reduce the intensity of the diamagnetic sample by the calculated intensity ratio using a form of the Solomon-Bloembergen equation (see below and [12, 16, 34]).
The PRE-unperturbed intrinsic transverse relaxation rate (R2) associated with each peak was estimated based on 1H linewidth at half maximal height (ΔνFWHM) from diamagnetic samples. Tau (τ) was the duration of the INEPT delays in the 1H-15N TROSY HSQC pulse sequence (8.8, 9.6, and 9.6 msec for KCNE1, DAGK, and C99 respectively). The Γ2 values (see below) were then calculated using a non-linear fitting method in Mathcad. The Γ2 for amide resonances were then converted to distances[12, 13, 35]. More practical details of the conversion from PRE measurements to distances are found in below. The overall molecular rotational correlation times (τr) were calculated based on the measured backbone amide 15N T1 and T2 relaxation values (21, 35, and 26 ns for KCNE1, DAGK, and C99 respectively) [20, 30, 31, 36].
Simulation of PRE Data
PRE data was simulated in Mathcad. Simulated free induction decays (FID) were created to model oxidized and reduced data according to the following equation:
where A is a scalar, ω is a frequency term, t is time, and T2 is the inverse of the total relaxation rate (e.g. 1/T2* = R2* = R2 + Γ2) of the nuclear spin. The resulting FIDs were either directly Fourier transformed or multiplied by one of three window functions. The window functions used were mimics of those employed to process the experimental data; that is, exponential multiplication (EM), Lorentzian to Gaussian transformation (GM), or a shifted sine bell (SSB). The windowed FIDs were then Fourier transformed with a fast Fourier transform algorithm to yield simulated PRE NMR spectra. These simulated PRE spectra were used to determine the maximum intensity (Iox or Ired) and the linewidth at high maximal height (ΔνFWHM) for the reduced spectrum. These values were used to evaluate the PRE (Γ2) and then converted to a corresponding distance.
The simulated data were modeled to approximate the type of data that is generated from helical membrane proteins. Many different iterations of values were used to evaluate trends noticed in the experimental data. The general limits of the conclusions were also probed.
Background Theory: NMR Data Processing with Window Functions
Modern NMR spectrometers record a time domain signal (free induction decay, FID) and convert this to a frequency domain representation via application of the Fourier transform (FT). The information content of these two representations are precisely equal (by Parseval's theorem), though the latter is more accessible to human interpretation[37]. Various data manipulations may be applied to the time domain data (FID) to produce some desired effect in the frequency domain such as enhancement of sensitivity or resolution. Collectively, these manipulations may be referred to as digital signal processing and are an integral aspect of optimizing biomolecular NMR spectra[38].
A common manipulation is the multiplication of the time domain signal by some window function, which results in a convolution in the frequency domain[39]. Such multiplication is often employed to eliminate spectral distortions or shortcomings such as truncation artifacts, low resolution, or poor signal-to-noise. Truncation in the time domain can cause sinc wiggles in the frequency domain which are apparent at the base of resonances and can interfere with quantitative resonance characterization. These distortions arise because a truncated FID is equivalent to the product of a FID and an appropriately-scaled rectangle function Π(x). Furthermore, since ℑ(Π(x)) = sinc(x), the Fourier transform of a truncated FID is the convolution of a Lorentzian line with a sinc function, which produces sinc wiggles at the base of peaks. The use of window functions for the elimination of such sinc wiggles is referred to as apodization, and is a particularly common transformation invoked in NMR data processing[40]. Among NMR spectroscopists the terms “apodization” and “windowing” (the application of window functions) are used interchangeably, but for the sake of clarity we will refer exclusively to window functions.
Window functions can also be invoked to enhance the sensitivity or resolution of a spectrum. Generally, these outcomes are mutually exclusive and the augmentation of one spectral characteristic is tantamount to the diminution of the other[41]. This is the consequence of the relative information content of the earlier and later regions of the FID. The level of signal decays exponentially while the level of noise remains constant. By application of window functions, one can adjust the relative contribution of various segments of the FID and thereby alter the balance between resolution and sensitivity[40]. For example, the application of an exponential window (e−at, Figure 2a, brown line) de-emphasizes later time points in the FID, which contribute a lower signal-to-noise ratio than earlier time points. The result of such a window is an improvement in the apparent sensitivity, but at the expense of broadened Lorentzian linewidths. This follows from the similarity theorem of the Fourier transform, which states that a contraction of coordinates in one domain leads to a commensurate expansion in the alternative domain. An exponential window function, which produces an accelerated decay in the time domain, naturally causes a broadening effect in the frequency domain. A sharper exponential (Figure 2a, orange line) intensifies this effect, leading to further enhancement of sensitivity and deterioration of resolution.
Figure 2.
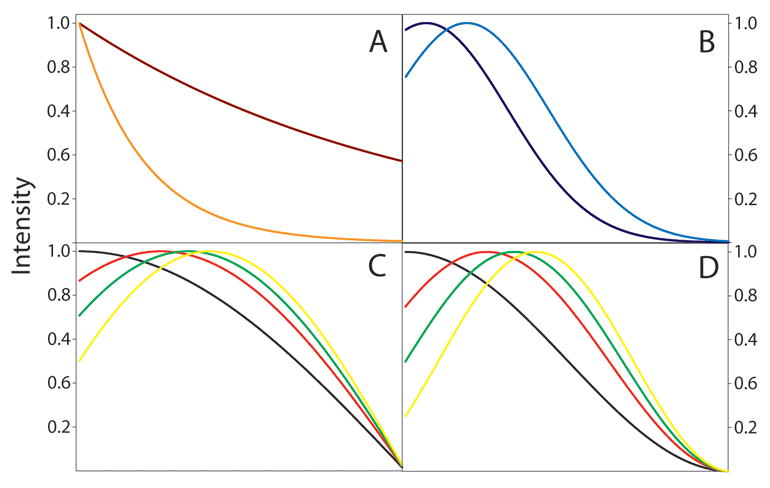
Panel A shows exponential window functions with 1 Hz (brown line) and 5 Hz (orange line) broadening constants. Panel B details Lorentzian-to-Gaussian window functions with constant Gaussian broadening constants (20 Hz) but varying exponential narrowing constants of 5 Hz (black line) and 15 Hz (royal blue line). Note that the Lorentzian-to-Gaussian function (royal blue line) has been reduced in scaled by a factor of ∼0.75 for display purposes. Panels C and D show sine-bell window functions with various phase shifts. Panel C illustrates sine-bell window functions while D shows squared sine-bell functions. For both panels (C and D), the black, red, green, and yellow lines correspond to different phase offsets of π/2 (90°), π/3 (60°), π/4 (45°), and π/6 (30°), respectively.
The spectroscopic study of integral membrane proteins generally requires detergent micelles, with the high mass of the protein-detergent complex often resulting in long rotational correlation times, and hence poor spectral resolution. For the case of α-helical integral membrane proteins, this problem is compounded by inherently poor spectral dispersion. The spectroscopic study of such proteins is facilitated by the use of resolution-enhancing window functions, such as the Lorentz-to-Gauss transformation (GM). The GM window function (eat e−bt2, Figure 2b, black line) combines an increasing exponential (eat) with a Gaussian (e−bt2), such that spectral lineshape is converted from Lorentzian to the considerably narrower Gaussian, resulting in dramatic gains in resolution[37]. The GM window (Figure 2b, blue line) invokes a stronger exponential and/or a weaker Gaussian, such that the window grants greater weight to later time points, resulting in further gains in digital resolution. Trigonometric functions comprise a third common class of windows. These are typically invoked as shifted sinusoids (Figure 2c) or shifted sinusoids raised to some exponent, commonly 2 (Figure 2d). The use of an exponent greater than 1 causes a sharper decline in the sinusoid and thereby results in a smoother approach to zero at the end of the window. The shift and exponent are varied empirically to determine the trigonometric window that produces an optimal balance of sensitivity and resolution. Functions with small phase shifts (e.g., π/6 or π/4) have similar morphology to GM window functions and consequently are used in resolution enhancement. Larger phase shifts are used to produce cosine-like functions, which result in sensitivity enhancement. Exponentials, Lorentzian-to-Gaussian transformations, and sinusoids are the most commonly employed window functions for NMR data manipulation, though others such as trapezoidal[42], Hamming[43], Hanning[44], and Kaiser[45], windows are occasionally used.
Brief Introduction to Paramagnetic Relaxation Enhancement
Commonly used PRE reagents (ie. nitroxide spin labels and Mn2+ chelating tags) make interpretation of paramagnetic relaxation enhancements straightforward. This is due to the fact that these reagents have an isotropic electron magnetic moment which eliminates the chemical shift perturbation of pseudo contact shifts. Similarly the cross correlation between electron and nuclear spins is insignificant because of negligible Curie spin relaxation[46].
Proximity of a nuclear spin to an unpaired electron will enhance the transverse relaxation rate by some given amount (Γ2) such that the effective transverse relaxation rate (R2*) will be composed of the components of the transverse relaxation rate in the diamagnetic state (R2) and the paramagnetic enhancement (e.g. R2* = R2 + Γ2).
The enhanced relaxation rates of nuclear spins due to an unpaired electron occur in a distance dependant manner, which allows for conversion from relaxation rates to structural distance constraints. The relaxation enhancement is inversely proportional to the sixth root of the distance (r-1/6) between the nuclear spin and unpaired electron. Impressively the framework for PRE was understood relatively early in the development of NMR theory and a modified Solomon and Bloembergen equation eloquently describes the relationship between the PRE rate and the distance between the nuclear and electronic spins[12, 16, 34].
| (1) |
where r is the distance between the nucleus and the electron, K is a constant comprising the nuclear spin gyromagnetic ratio, the electronic g factor, and the Bohr magneton[12, 16], Γ2 is the transverse paramagnetic relaxation rate enhancement, ωh is the proton Larmor nuclear precessional frequency, and τc is the correlation time between the nuclear spin and unpaired electron. K, for a nitroxide spin-label enhancing the relaxation of a proton, has a value of 1.23×10⁻³² cm6/s2.
τc is dependent on the electron spin relaxation time (τs) and the protein rotational correlation time (τr) as shown in Equation 2.
| (2) |
Protein rotational correlation times (τr) usually lie in the nanoseconds regime, whereas the electron spin relaxation time (τs) varies significantly depending on the paramagnet. Nitroxide spin-labels tend to be the most commonly used paramagnet because the τs of a nitroxide is usually long (>10-7 s) relative to the protein rotational correlation time. Practically, this means that the correlation time between the nuclear spin and unpaired electron (τc) for a nitroxide can be accurately estimated from the global protein rotational correlation time. For other paramagnetic centers this may not be the case; Mn2+, for example, has electron relaxation times of magnitude comparable to τr, which therefore cannot be neglected when determining τc[46]. The electron spin relaxation time (τs) is also dependent on the strength of the magnetic field; this is only a concern if τs contributes significantly to τc. In practice, the field dependence of τs is only a concern for paramagnetic centers with relatively short electron spin relaxation times used in conjunction with slowly tumbling large proteins like membrane protein–detergent micelle complexes.
The method for PRE acquisition and extraction of distance restraints described by the Wagner lab and has become standard in the field of solution NMR[12]. This method makes use of a matched pair of 1H,15N HSQC (or TROSY) experiments with PREs originating from the nitroxide spin-label MTSL[12, 13, 18]. A more rigorous approach has also been outlined, but both methods give sufficiently accurate distance information when properly used[15, 46, 47]. The more prevalent method utilizes resonance intensity ratios from matched oxidized (paramagnetic) and reduced (diamagnetic) spectra in conjunction with the diamagnetic transverse relaxation rate (R2) that can be used to fit for the transverse paramagnetic relaxation rate enhancement (Γ2)[12].
| (3) |
where Iox is the intensity of a resonance under paramagnetic conditions, Ired is the intensity of the resonance in diamagnetic conditions, and τ is the total evolution time during the INEPT (usually around 10 ms for 1H,15N HSQC experiments). The linewidth (ΔνFWHM) of the diamagnetic state can be used to estimate R2, where R2 ≈ πΔνFWHM for a Lorentzian lineshape. Finally, Γ2 can be used to calculate the distance between the paramagnetic center and the nuclear spin as given in Equation 1. The following discussion and results deal with the Wagner method mentioned above. It should also be noted that while traditional 15N HSQC based experiments have most commonly been used in PRE experiments [12, 15], TROSY based experiments are equally well suited[13, 48]. In the case of membrane proteins it is clear that TROSY based experiments offer the significant advantage of usually yielding more highly resolved spectra than the conventional HSQC experiment.
Practical Caveats of Paramagnetic Relaxation Enhancement Measurements
In order to obtain long-range distance constraints from 1H transverse paramagnetic relaxation enhancements (PRE), a paramagnetic probe must be incorporated into the protein of interest. Among the most facile methods used to place a paramagnet in a protein is the use of site-directed spin-labeling (SDSL). Nitroxide spin-labeling reagents, like MTSL, are predominantly used because of the robustness of the chemistry used to covalently attach the probe to the protein at specific locations and because of the favorable electron-proton correlation time (τs). In order to make use of residue-specific spin-labeling, a cysteine-less form of the protein must be constructed and subsequently single-cysteine mutants engineered for each of the sites that are to be probed by site-directed spin-labeling. Meaningful PRE measurements require that the functional state (and hence structure) of the protein be unperturbed by the removal of native cysteine residues, the introduction of single cysteine point mutations, and the addition of a paramagnetic spin-label.
The interpretation of PRE data and implementation as structural restraints also have potential practical caveats. Because the paramagnetic relaxation enhancement is spatially dependent in a sixth-root manner (r-1/6), motions of the spin-label and/or portions of the proteins do not result in a true average distance between electron and nuclear spin, but instead are biased to reflect the nearest proximity sampled between the electron and nuclear spin. Thus for reliable application of PRE data in structural studies, protein motions must be taken into account. Other things can affect the quality of distance restraints; for example, a lack of uniformity in site-directed spin-labeling will result in apparently elongated distances. PRE based distances can be underestimated by artifactual “solvent PREs” if either the protein concentration is too high or there is free spin-label in solution[15]. Lastly, the inherent error associated with PRE measurements should be taken into account when derived distances are used as restraints in structure calculations, otherwise over interpretation of the PRE data could potentially lead to perturbations in the resulting structure.
Results and Discussion
The Need for Resolution Enhancement in NMR Spectra of Helical Membrane Proteins
The regular nature of the alpha helix and the relatively large size of the helical membrane protein-detergent complex generally results in poor NMR sensitivity, resolution, and dispersion relative to other classes of proteins (Figure 3), thereby complicating most facets of NMR data interpretation. Spectral resolution enhancement via the application of a window function to the FID is often necessary to fully utilize the content of the data. However, the theory underlying PRE measurements assumes a Lorentzian lineshape. The spectral quality of representative membrane proteins (Figure 3) is considerably improved with the use of a resolution enhancing window function (Figure 4A). Figure 4 shows the wide variety of effects that can result from tailoring window functions to enhance resolution (Figure 4A) or sensitivity (Figure 4C).
Figure 3.
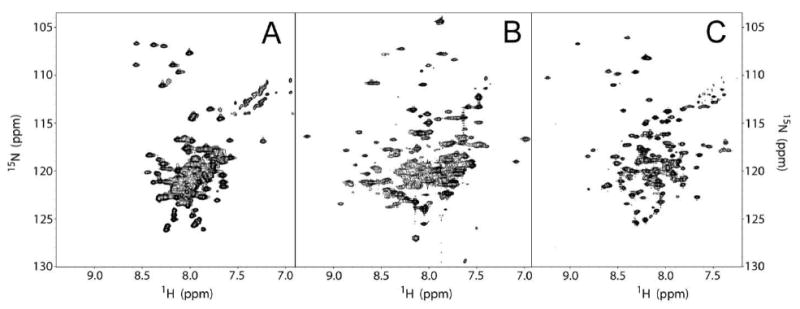
Panels A, B, and C are 1H-15N TROSY-HSQC spectra of wild type C99, DAGK, and KCNE1, respectively. Each spectrum was processed without a window function. Note that in each spectrum there is significant resonance overlap that would hinder PRE measurements. The C99, DAGK, and KCNE1 spectra were recorded at 800, 800, and 600 MHz (1H), respectively.
Figure 4.
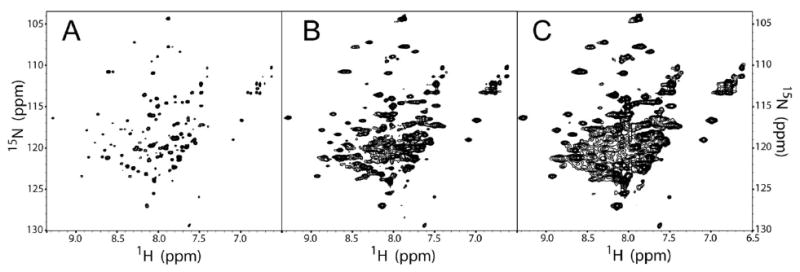
1H-15N TROSY HSQC DAGK data illustrating the wide range of spectral effects that can be achieved by the application of window functions. Panel A shows a DAGK spectrum processed using a strong resolution enhancing Lorentzian-to-Gaussian transformation (GM). Panel B shows the same data but processed with slight resolution enhancement by a π/3 shifted sine bell function. Panel C shows data that was processed with no resolution enhancement by a squared sine bell shifted by π/2, a function equivalent to a squared cosine bell.
Here, we sought to assess whether reliable distances can be derived from PRE data when resolution-enhanced spectra are used to measure peak intensities and the diamagnetic linewidths. In an effort to determine the effects of window functions on the calculated PRE-derived distances, we subjected C99, DAGK, and KCNE1 PRE data sets to a series of window functions (Table 1) and then used the resonance intensities and linewidths to determine the paramagnetic relaxation enhancements (Γ2), which were further converted to distance constraints.
The Effects of Window Functions on PRE Based Distance Constraints
Representative PRE data sets after resolution enhancement from the membrane proteins C99, DAGK, and KCNE1 are shown in Figure 5. Cursory inspection of the data reveals that resolution enhancement dramatically increases the ease with which peak intensities and linewidths can be measured. To evaluate the effects of window functions on calculated distances, we report data from sites that were spin-labeled in different protein settings: the spin-label attached to cysteine in T729C C99 is in an aqueous environment; the spin-label in I82C DAGK is located at the membrane–aqueous interface; and the spin-label in S64C KCNE1 is located in a membrane environment (i.e., interior of a micelle). Similarly, the proton resonances used as distance probes were chosen from various environments and with differing amounts of transverse paramagnetic relaxation enhancement, and thus different distance relationships (cf. Table 2). The data from these helical membrane proteins were then processed to achieve varying degrees of resolution enhancement or sensitivity enhancement (Table 1).
Figure 5.
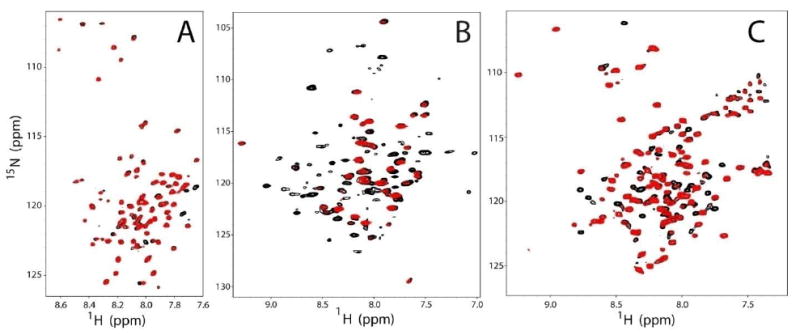
Representative PRE data. Panels A, B, and C are representative PRE data sets from MTSL-labeled T729C C99, MTSL-labeled I82C DAGK, and MTSL-labeled S64C KCNE1, respectively. The spectra are overlaid with the reduced (diamagnetic) spectrum in black and the oxidized (paramagnetic) spectrum in red. Each data set was modified with a Lorentzian-to-Gaussian window function in both dimensions in order to demonstrate the utility of resolution enhancement.
Table 2.
| Amide Proton | Average Distance | Standard Deviation | |
|---|---|---|---|
|
C99 (T729C)a |
F690a | 15.59 Å | 0.1 Å |
| Y762b | 18.71 Å | 0.2 Å | |
| S750b | 23.88 Å | 0.6 Å | |
|
DAGK (I82C)b |
G15b | 15.62 Å | 0.06 Å |
| S60c | 20.52 Å | 0.3 Å | |
| K94c | 21.93 Å | 0.3 Å | |
|
KCNE1 (S64C)c |
D85b | 15.74 Å | 0.3 Å |
| A114a | 18.23 Å | 0.4 Å | |
| T14a | 20.55 Å | 0.3 Å | |
Located in aqueous environment
Located in amphipathic environment
Located in membrane environment
The results from PRE-based distance calculations have conventionally been considered inaccurate for data processed in a manner where resonance lineshapes deviate from Lorentzian[46]. Data processed either without the use of window functions or the use of modest sensitivity enhancement (e.g. gentle exponential multiplication) were thought to be obligatory for the integrity of PRE-derived distance restraints. Surprisingly, we found that window functions have little effect on distance calculations (Figure 6). The experimental data show that only modest variations in PRE and derived distances arise from variations in signal processing. The largest standard deviation that arises from the window functions was 0.6 Å and corresponds to the 23.7 Å distance in C99 between the electron in the spin-label of T729C and the amide proton of residue S750 (Table 2). The average standard deviation for the data was 0.28 Å. The experimental data show that the use of window functions has little impact on the derived distance; however, it does impact the values of the intensity ratios and transverse relaxation rates and thus Γ2. Apparently these effects are favorably compensatory such that resulting distance errors are minimal.
Figure 6.
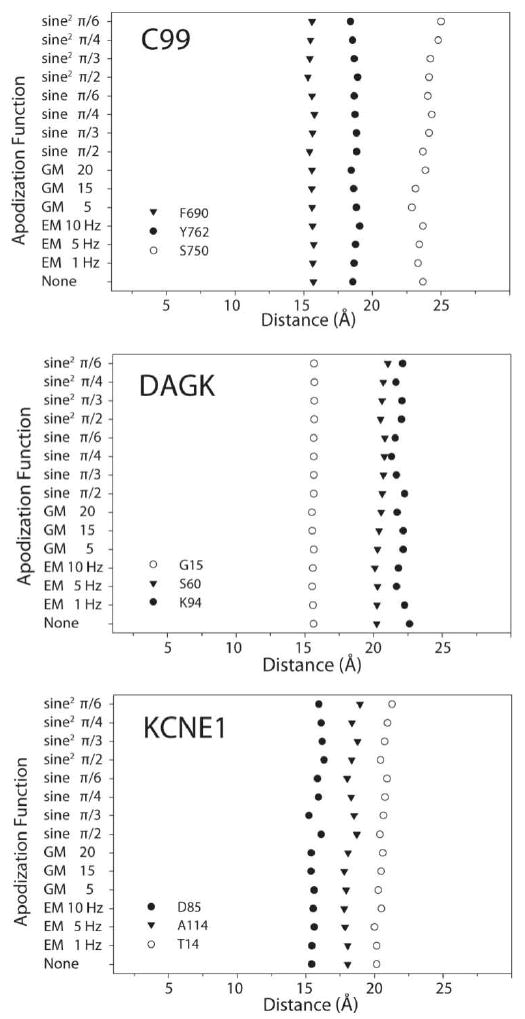
The effects of window functions on the calculated distance between a spin-label and a given amide proton. (Top) C99 spin-labeled at T729C and the effects on F690, Y762, and S750. (Middle) Probing the effects of DAGK labeled at I82C on G15, S60, and K94. (Bottom) KCNE1 labeled at S64C and the effects on D85, A114, and T14. Note that there are only small variations in the calculated distances. Table 2 lists the residue environments and standard deviations.
In an effort to better understand the relationship between window functions, intensity ratios, R2, PRE (Γ2), and the corresponding distance (r), simulated data were used. Matched pairs of simulated free induction decays (FIDs) were created to represent oxidized and reduced data and were multiplied by window functions and Fourier transformed to yield PRE spectra. These simulated PRE spectra were then evaluated to determine the maximum intensity (Iox or Ired) and the linewidth of the reduced spectrum (ΔνFWHM). These values were used to evaluate Γ2 and the corresponding distances (Equations 3 and 1).
The simulated data corroborate the experimental results that calculated distances are independent of the window function used to process the data. The results generated by the simulated data also indicate that errors in distances measured using window functions remain minimal even beyond the norms in the parameters typically used in signal processing of helical membrane proteins. Another trend that appears from the simulated data (and is difficult to glean from the experimental data) is that resolution enhancement slightly underestimates the calculated distances while sensitivity enhancement (EM) slightly overestimates them. This effect arises because resolution enhancement decreases the intensity ratios and the resonance linewidth, while sensitivity enhancement does the opposite. In a qualitative sense, a decrease in the linewidth (and hence R2) dictates an increased the distance (Figure 7 top panel), which is partially offset by a decrease in the resonance intensity ratio that effectively decreases the distance (Figure 7 bottom panel). As illustrated by the simulated data in Figure 7, both the intensity ratio (Iox/Ired) and diamagnetic transverse relaxation rate (R2) values affect the PRE (Γ2) which in turn dictates the calculated distance. Depending on the particular window function employed, the intensity ratios and linewidths can be changed quite significantly, leading to changes in the estimated PRE errors that can surpass 10%. However, the conversion from PRE to distance significantly compresses this error to generally less than 1 Å. The dominant effect in maintaining fairly accurate distance values arises from the sixth root dependence (r-1/6) between the PRE and the distance. It should be noted that the variations in the calculated distance that arise from differing window functions are generally very small relative to calculated distances.
Figure 7.
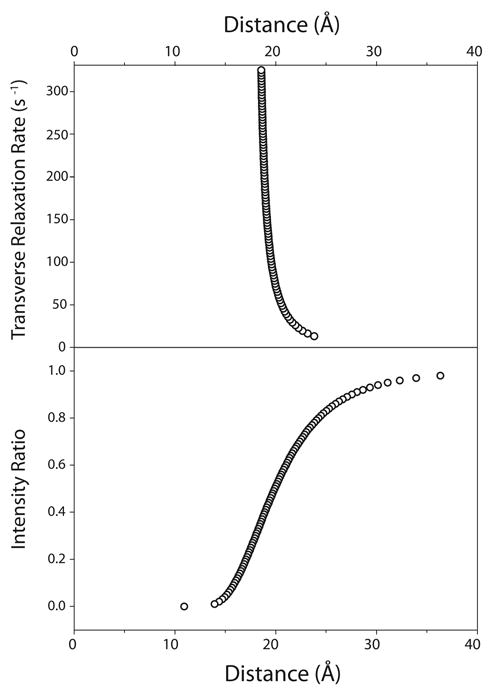
Simulated dependencies of diamagnetic relaxation rates (R2) and intensity ratios (Iox/Ired) on distance. These panels show how a given experimental R2 or Iox/Ired value affects the corresponding distance assuming all other parameters are held constant. The top panel shows the relationship between transverse relaxation (R2) and distance. The bottom panel relates the resonance intensity ratio (Iox/Ired) to distance. The parameters used to generate these plots mimics typical parameters used for DAGK PRE measurements (e.g. a τc of 35 ns and τINEPT of 9.6 ms). The top panel assumed a constant intensity ratio of 0.5, while the bottom panel assumed an R2 value of 74 s-1.
While distances calculated from paramagnetic relaxation enhancement are quite robust, some window functions do tend to preserve accuracy slightly better. Resolution enhancing shifted sine bell (SSB) functions generally produced the greatest disparities from the unmodified data. Both exponential (EM) and Lorentzian-to-Gaussian window functions (GM) preserve the calculated distances to a greater extent than the shifted sine bell functions. While the results presented here are broad and generally applicable to a wide range of biomolecules (from a few kDa to hundreds of kDa), we recommend that data should be windowed prudently. Our PRE data simulations indicate that the methods described will break down if extreme resolution or sensitivity enhancement is applied. Regardless, the calculation of distances from PRE measurements is robust and surprisingly independent of signal processing with window functions.
Implementing PRE Distance Constraints in Structure Calculations
PRE conversion from relaxation rates to distance is robust, but one must exercise caution in the practical application in structure calculations. The intensity ratio is the major determinant of the distance in PRE calculations (Figure 7). Distances will be most reliable when they are derived from the near-linear portion of the curve (see Figure 7, bottom panel). Outside of this range it will typically be difficult to ascertain accurate distance measurements; however, one can readily establish that the distance is near (i.e. <15 angstroms) or far (>25 angstroms). Also, because there are many potential sources of error in PRE data analysis all distances used in structure calculations should be applied with relatively loose tolerances. Based on the published literature, one should expect the error to be at least ±2 Å, though most studies that use explicit distances incorporate errors of ±4 Å[13, 14, 16, 18, 29].
Developing Directions: PREs as a Probe of Membrane Protein Dynamics
PRE data enable determination of long-range quantitative distance information, which provides useful restraints for the elucidation of macromolecular structure by solution NMR. Another common application of PREs to the field of membrane protein structural biology is to use non-covalently bound paramagnetic probes such as Gd(III)-diethylenetriaminepentaacetic acid, 16-Doxylstearic acid, and molecular oxygen, to qualitatively to probe the membrane protein topology and orientation.[19-21] In addition to their utility in the structural characterization of membrane solubilized biomolecules, PREs have been to used to aid in resonance assignment, and probe protein binding and interaction events of other classes of biomolecules like metalloproteins and nucleic acids[49-53]. Of particular interest is the recent use of PRE datasets to illuminate dynamic processes involving lowly populated structural states. Pioneering work by the Clore group has extended the applicability of paramagnetic NMR to analysis of the dynamics of macromolecular recognition and intramolecular domain dynamics[54-58]. PREs have been used to probe rare transient intermediates in macromolecular recognition and protein dynamics processes despite a background of a highly populated equilibrium bound state. The PRE is distinctly sensitive to low population intermediates; however, this sensitivity is limited to cases in which the exchange rate is large with respect to the difference in transverse PRE between the alternative states[55]. For a comprehensive summary of theoretical and practical aspects of this technique, readers are referred to a recent review[59].
This frontier has yet to be exploited for the study of membrane protein dynamics, though it could be conceivably used to probe such intriguing areas of membrane biology as protein folding, virus-host recognition, receptor pharmacology, and intramembrane proteolysis.
Conclusions
Helical membrane proteins pose many challenges for structural and dynamical studies. For some helical membrane proteins, PRE-based distances may be the only way to obtain long-range distance constraints vital to successful structure calculations. Fortunately, the r-6 dependence of the PRE on distance means that small variations caused by the application of window functions are minimized in the distance calculations. In sum, many window functions were found to be compatible with acquisition of paramagnetic distance restraints, and expected errors were negligible in relation to the magnitude of the measured distances. PRE-based distances can therefore be applied to membrane protein structural studies without compromising the integrity of the resulting structural ensemble. Indeed, the conclusions of this paper regarding PREs and window functions can be applied to non-membrane proteins and other biomolecules as well. Future application of PREs in membrane protein studies will undoubtedly also include studies of membrane protein dynamics.
Acknowledgments
This work was supported by funding from the NIH R01GM47485, R01 DC007416, and P01 GM80513 and by training grant support of W.V.H. by T32 NS007491.
References
- 1.Kim RB. Transporters and drug discovery: why, when, and how. Mol Pharm. 2006;3:26–32. doi: 10.1021/mp050084o. [DOI] [PubMed] [Google Scholar]
- 2.Filmore D. It's a GPCR world. Modern Drug Discovery. 2004;7:24–28. [Google Scholar]
- 3.Lacapere JJ, et al. Determining membrane protein structures: still a challenge! Trends Biochem Sci. 2007;32(6):259–70. doi: 10.1016/j.tibs.2007.04.001. [DOI] [PubMed] [Google Scholar]
- 4.Kaczorowski GJ, et al. Ion Channels as Drug Targets: The Next GPCRs. J Gen Physiol. 2008;131:399–405. doi: 10.1085/jgp.200709946. [DOI] [PMC free article] [PubMed] [Google Scholar]
- 5.Jimonet P, Jager R. Strategies for designing GPCR-focused libraries and screening sets. Curr Opin Drug Discov Develop. 2004;7:325–33. [PubMed] [Google Scholar]
- 6.McCrossan ZA, Abbott GW. The MinK-related peptides. Neuropharmacology. 2004;47(6):787–821. doi: 10.1016/j.neuropharm.2004.06.018. [DOI] [PubMed] [Google Scholar]
- 7.Hopkins AL, Groom CR. The druggable genome. Nat Rev Drug Discov. 2002;1(9):727–30. doi: 10.1038/nrd892. [DOI] [PubMed] [Google Scholar]
- 8.Sgourakis NG, et al. A method for the prediction of GPCRs coupling specificity to G-proteins using refined profile Hidden Markov Models. BMC Bioinformatics. 2005;6:104. doi: 10.1186/1471-2105-6-104. [DOI] [PMC free article] [PubMed] [Google Scholar]
- 9.Selkoe DJ. Cell biology of protein misfolding: The examples of Alzheimer's and Parkinson's diseases. Nat Cell Biol. 2004;6:1054–1061. doi: 10.1038/ncb1104-1054. [DOI] [PubMed] [Google Scholar]
- 10.Sanders CR, Meyers JK. Disease-related misassembly of membrane protiens. Annu Rev Biophys Biomol Struct. 2004;33:25–51. doi: 10.1146/annurev.biophys.33.110502.140348. [DOI] [PubMed] [Google Scholar]
- 11.Myers JK, Mobley CK, Sanders CR. The Peripheral Neuropathy-Linked Trembler and Trembler-J Mutant Forms of Peripheral Myelin Protein 22 are Folding-Destabilized. Biochemistry. 2008;47:10620–10629. doi: 10.1021/bi801157p. [DOI] [PMC free article] [PubMed] [Google Scholar]
- 12.Battiste JL, Wagner G. Utilization of site-directed spin labeling and high-resolution heteronuclear nuclear magnetic resonance for global fold determination of large proteins with limited nuclear overhauser effect data. Biochemistry. 2000;39(18):5355–65. doi: 10.1021/bi000060h. [DOI] [PubMed] [Google Scholar]
- 13.Liang B, Bushweller JH, Tamm LK. Site-Directed Parallel Spin-Labeling and Paramagnetic Relaxation Enhancement in Structure Determination of Membrane Proteins by Solution NMR Spectroscopy. J Am Chem Soc. 2006;128:4389–4397. doi: 10.1021/ja0574825. [DOI] [PMC free article] [PubMed] [Google Scholar]
- 14.Schmidt PG, Kuntz ID. Distance measurements in spin-labeled lysozyme. Biochemistry. 1984;23:4261–4266. doi: 10.1021/bi00313a038. [DOI] [PubMed] [Google Scholar]
- 15.Donaldson LW, et al. Structural Characterization of Proteins with an Attached ATCUN Motif by Paramagnetic Relaxation Enhancement NMR Spectroscopy. J Am Chem Soc. 2001;123:9843–9847. doi: 10.1021/ja011241p. [DOI] [PubMed] [Google Scholar]
- 16.Kosen PA. Spin Labeling of Proteins. Methods Enzymol. 1989;177:86–121. doi: 10.1016/0076-6879(89)77007-5. [DOI] [PubMed] [Google Scholar]
- 17.Girvin ME, Fillingame RH. Hairpin Folding of Subunit c of F1Fo ATP Synthase: 1H Distance Measurements to Nitroxide-Derivatized Aspartyl-61. Biochemistry. 1994;33:665–674. doi: 10.1021/bi00169a006. [DOI] [PubMed] [Google Scholar]
- 18.Zhou Y, et al. NMR Solution Structure of the Integral Membrane Enzyme DsbB: Functional Insights into DsbB-Catalyzed Disulfide Bond Formation. Molec Cell. 2008;31:896–908. doi: 10.1016/j.molcel.2008.08.028. [DOI] [PMC free article] [PubMed] [Google Scholar]
- 19.Al-Abdul-Wahid MS, et al. A Solution NMR Approach to the Measurement of Amphiphile Immersion Depth and Orientation in Membrane Model Systems. J Am Chem Soc. 2009;131:6452–6459. doi: 10.1021/ja808964e. [DOI] [PubMed] [Google Scholar]
- 20.Beel AJ, et al. Structural Studies of the Transmembrane C-Terminal Domain of the Amyloid Precursor Protein (APP): Does APP Function as a Cholesterol Sensor? Biochemistry. 2008;47:9428–9446. doi: 10.1021/bi800993c. [DOI] [PMC free article] [PubMed] [Google Scholar]
- 21.Hilty C, et al. Membrane Protein - Lipid Interactionsin Mixed MicellesStudied by NMR Spectroscopy with the Use of Paramagnetic Reagents. Chembiochem. 2004;5:467–473. doi: 10.1002/cbic.200300815. [DOI] [PubMed] [Google Scholar]
- 22.Kennedy EP. Osmotic regulation and the biosynthesis of membrane-derived oligosaccharides in Escherichia coli. Proc Natl Acad Sci U S A. 1982;79:1092–1095. doi: 10.1073/pnas.79.4.1092. [DOI] [PMC free article] [PubMed] [Google Scholar]
- 23.Badola P, Sanders CR. Escherichia coli diacylglycerol kinase is an evolutionarily optimized membrane enzyme and catalyzes direct phosphoryl transfer. J Biol Chem. 1997;272:24176–24182. doi: 10.1074/jbc.272.39.24176. [DOI] [PubMed] [Google Scholar]
- 24.Yukie Shibata, et al. Kinase activity of the dgk gene product is involved in the virulence of Streptococcus mutans. Microbiology. 2009;155:557–565. doi: 10.1099/mic.0.023812-0. [DOI] [PubMed] [Google Scholar]
- 25.Lau FW, Chen X, Bowie JU. Active sites of diacylglycerol kinase from Escherichia coli are shared between subunits. Biochemistry. 1999;38:5521–5527. doi: 10.1021/bi982763t. [DOI] [PubMed] [Google Scholar]
- 26.Van Horn WD, et al. Solution Nuclear Magnetic Resonance Structure of Membrane-Integral Diacylglycerol Kinase. Science. 2009;324:1726–1729. doi: 10.1126/science.1171716. [DOI] [PMC free article] [PubMed] [Google Scholar]
- 27.Vassar R, et al. Beta -Secretase Cleavage of Alzheimer's Amyloid Precursor Protein by the Transmembrane Aspartic Protease BACE. Science. 1999;286:735–741. doi: 10.1126/science.286.5440.735. [DOI] [PubMed] [Google Scholar]
- 28.Beel AJ, Sanders CR. Substrate specificity of gamma-secretase and other intramembrane proteases. Cell Mol Life Sci. 2008;65:1311–1334. doi: 10.1007/s00018-008-7462-2. [DOI] [PMC free article] [PubMed] [Google Scholar]
- 29.Kang C, et al. Structure of KCNE1 and implications for how it modulates the KCNQ1 potassium channel. Biochemistry. 2008;47(31):7999–8006. doi: 10.1021/bi800875q. [DOI] [PMC free article] [PubMed] [Google Scholar]
- 30.Tian C, et al. Preparation, Functional Characterization, and NMR Studies of Human KCNE1, a Voltage-Gated Potassium Channel Accessory Subunit Associated with Deafness and Long QT Syndrome. Biochemistry. 2007 doi: 10.1021/bi700705j. [DOI] [PMC free article] [PubMed] [Google Scholar]
- 31.Oxenoid K, et al. NMR Assignments for a Helical 40 kDa Membrane Protein. J Am Chem Soc. 2004;126:5048–5049. doi: 10.1021/ja049916m. [DOI] [PubMed] [Google Scholar]
- 32.Delaglio F, et al. NMRPipe: a multidimensional spectral processing system based on UNIX pipes. J Biomol NMR. 1995;6(3):277–93. doi: 10.1007/BF00197809. [DOI] [PubMed] [Google Scholar]
- 33.Goddard TD, Kneller DG. SPARKY 3. University of California; San Francisco: [Google Scholar]
- 34.Solomon I, Bloembergen N. Nuclear Magnetic Interactions in the HF Molecule. Journal of Chemical Physics. 1956;25(2):261–266. [Google Scholar]
- 35.Gillespie JR, Shortle D. Characterization of long-range structure in the denatured state of staphylococcal nuclease. I. Paramagnetic relaxation enhancement by nitroxide spin labels. J Mol Biol. 1997;268(1):158–69. doi: 10.1006/jmbi.1997.0954. [DOI] [PubMed] [Google Scholar]
- 36.Farrow NA, et al. Backbone dynamics of a free and phosphopeptide-complexed Src homology 2 domain studied by 15N NMR relaxation. Biochemistry. 1994;33(19):5984–6003. doi: 10.1021/bi00185a040. [DOI] [PubMed] [Google Scholar]
- 37.Cavanagh J, et al. Protein NMR Spectroscopy: Principles and Practice. Academic Press; San Diego: 1996. pp. 100–131. [Google Scholar]
- 38.Hoch JC, Stern A. In: NMR Data Processing. Wiley-Liss, editor. New York: 1996. p. 196. [Google Scholar]
- 39.Naylor DA, Tahic MK. Apodizing functions for fourier transform spectroscopy. J Opt Soc Am. 2007;24:3644–3648. doi: 10.1364/josaa.24.003644. [DOI] [PubMed] [Google Scholar]
- 40.Derome AE. Modern NMR Techniques for Chemistry Research. Pergamon Press; Oxford: 1987. pp. 20–26. [Google Scholar]
- 41.Teng Q. Structural Biology: Practical NMR Applications. Springer; New York: 2005. pp. 129–135. [Google Scholar]
- 42.Okon M, Bray P, Vucelic D. 1H NMR Assignments and Secondary Structure of Human Beta2-Microglobulin in Solution. Biochemistry. 1992;31:8906–8915. doi: 10.1021/bi00152a030. [DOI] [PubMed] [Google Scholar]
- 43.Cross KJ, et al. NMR studies of a novel calcium, phosphate and fluoride delivery vehicle-αS1-casein(59–79) by stabilized amorphous calcium fluoride phosphate nanocomplexes. Biomaterials. 2004;25:5061–5069. doi: 10.1016/j.biomaterials.2004.01.045. [DOI] [PubMed] [Google Scholar]
- 44.Dijk AAV, et al. Characterization of the protonation and hydrogen bonding state of the histidine residues in IIAmtl, a domain of the phosphoenolpyruvate-dependent mannitol-specific transport protein. Biochemistry. 1992;31:9063–9072. doi: 10.1021/bi00152a050. [DOI] [PubMed] [Google Scholar]
- 45.Ghose R, Geiger O, Prestegard JH. NMR investigations of the structural properties of the nodulation protein, NodF, from Rhizobium leguminosarum and its homology with Escherichia coli acyl carrier protein. FEBS Lett. 1996;388:66–72. doi: 10.1016/0014-5793(96)00512-1. [DOI] [PubMed] [Google Scholar]
- 46.Iwahara J, Tang C, Clore GM. Practical aspects of 1H transverse paramagnetic relaxation enhancement measurements on macromolecules. J Magn Reson. 2007;184:185–195. doi: 10.1016/j.jmr.2006.10.003. [DOI] [PMC free article] [PubMed] [Google Scholar]
- 47.Iwahara J, Schwieters CD, Clore GM. Ensemble Approach for NMR Structure Refinement against 1H Paramagnetic Relaxation Enhancement Data Arising from a Flexible Paramagnetic Group Attached to a Macromolecule. J Am Chem Soc. 2004;126:5879–5896. doi: 10.1021/ja031580d. [DOI] [PubMed] [Google Scholar]
- 48.Hu K, Doucleff M, Clore GM. Using multiple quantum coherence to increase the 15N resolution in a three-dimensional TROSY HNCO experiment for accurate PRE and RDC measurements. J Magn Reson. 2009 doi: 10.1016/j.jmr.2009.06.019. [DOI] [PMC free article] [PubMed] [Google Scholar]
- 49.Jahnke W. Spin labels as a tool to identify and characterize protein-ligand interactions by NMR spectroscopy. Chembiochem. 2002;3(23):167–173. doi: 10.1002/1439-7633(20020301)3:2/3<167::AID-CBIC167>3.0.CO;2-S. [DOI] [PubMed] [Google Scholar]
- 50.Cutting B, et al. NMR resonance assignment of selectively labeled proteins by the use of paramagnetic ligands. Journal of Biomolecular Nmr. 2004;30(2):205–210. doi: 10.1023/b:jnmr.0000048947.28598.ea. [DOI] [PubMed] [Google Scholar]
- 51.Bertini I, et al. Paramagnetic relaxation as a tool for solution structure determination: Clostridium pasteurianum ferredoxin as an example. Proteins-Structure Function and Genetics. 1997;29(3):348–358. [PubMed] [Google Scholar]
- 52.Mackereth CD, Simon B, Sattler M. Extending the size of protein-RNA complexes studied by nuclear magnetic resonance spectroscopy. Chembiochem. 2005;6(9):1578–1584. doi: 10.1002/cbic.200500106. [DOI] [PubMed] [Google Scholar]
- 53.Ubbink M, et al. Paramagnetic resonance of biological metal centers. Annual Review of Biophysics and Biomolecular Structure. 2002;31:393–422. doi: 10.1146/annurev.biophys.31.091701.171000. [DOI] [PubMed] [Google Scholar]
- 54.Iwahara J, Clore GM. Detecting transient intermediates in macromolecular binding by paramagnetic NMR. Nature. 2006;440:1227–1230. doi: 10.1038/nature04673. [DOI] [PubMed] [Google Scholar]
- 55.Tang C, Iwahara J, Clore GM. Visualization of transient encounter complexes in protein-protein association. Nature. 2006;444:383–386. doi: 10.1038/nature05201. [DOI] [PubMed] [Google Scholar]
- 56.Tang C, Schwieters CD, Clore GM. Open-to-closed transition in apo maltose-binding protein observed by paramagnetic NMR. Nature. 2007;449:1078–1082. doi: 10.1038/nature06232. [DOI] [PubMed] [Google Scholar]
- 57.Tang C, Ghirlando R, Clore GM. Visualization of transient ultra-weak protein self-association in solution using paramagnetic relaxation enhancement. J Am Chem Soc. 2008;130:4048–4056. doi: 10.1021/ja710493m. [DOI] [PubMed] [Google Scholar]
- 58.Volkov AN, et al. Solution structure and dynamics of the complex between cytochrome c and cytochrome c peroxidase determined by paramagnetic NMR. Proc Natl Acad Sci U S A. 2006;103:18945–18950. doi: 10.1073/pnas.0603551103. [DOI] [PMC free article] [PubMed] [Google Scholar]
- 59.Clore GM, Tang C, Iwahara J. Elucidating transient macromolecular interactions using paramagnetic relaxation enhancement. Curr Opin Struct Biol. 2007;17:603–616. doi: 10.1016/j.sbi.2007.08.013. [DOI] [PMC free article] [PubMed] [Google Scholar]