Abstract
A customized laser combiner was designed and constructed for dual channel single molecule imaging. The feasibility of a combiner-incorporated imaging system was demonstrated in studies of single molecule FRET. Distance rulers made of dual-labeled dsDNA were used to evaluate the system by determining the distance between one FRET pair. The results showed that the system is sensitive enough to distinguish between distances differing by two base pair and the distances calculated from FRET efficiencies are close to those documented in the literature. The single molecule FRET with the dual-color imaging system was also applied to reconstructed phi29 motor pRNA monomers. Finally, techniques for dual laser alignment and tuning of laser power for dual-color excitation are discussed.
Keywords: Nanomotor, Single-molecule imaging, RNA nanotechnology, Nanotechnology, Nanobiotechnology
Introduction
The development of optical devices and mechanical probes that are sensitive enough to measure single molecules with nanometer resolution has initiated a new era in biomechanical research. Single molecule approaches allow for direct observation and make it possible to elucidate the properties of a variety of biological molecules. This knowledge has the potential to aid in the design of new nanodevices and in the imitation of natural ones.
Many single molecule techniques have been applied to investigate the functions of nanomotors in an effort to understand their mechanical and physical behaviors as well as those of their individual motor components. Motion of biomotors including phi29 DNA-packaging motor (Smith et al. 2001; Shu et al. 2007; Chang et al. 2008), myosin (Finer et al. 1994; Yildiz et al. 2003; Romberg and Vale 1993), kinesin (Hess et al. 2002; Svoboda and Block 1994; Schnitzer and Block 1997), F-1 ATPase (Yasuda et al. 2001; Adachi et al. 2000; Noji et al. 1997), DNA-helicase (Johnson et al. 2007; Myong et al. 2007) and RNA polymerase (Wang et al. 1998), have been directly observed. The detailed information provided at single molecule level coupled with the parallel development of single fluorophore detection and single pair FRET have allowed for mechanical measurements to be combined with observations of relative distance, speed, substrate binding, and conformational changes.
In conventional optical microscopy, spatial resolution is limited by diffraction and is approximately a few hundred nanometers. Methods such as single molecule fluorescence resonance energy transfer (FRET) (Ha 2001; Rueda et al. 2004; Zhuang et al. 2000; Deniz et al. 1999), nanometer-localization based on fitting the fluorescence signal with a point spread function (PSF) (Gordon et al. 2004; Yildiz et al. 2003; Yildiz et al. 2004; Churchman et al. 2005; Qu et al. 2004), stimulated emission depletion (STED) (Willig et al. 2007; Harke et al. 2008), stochastic optical reconstruction microscopy (STORM) (Huang et al. 2008; Rust et al. 2006), have been developed to overcome the diffraction limit in optical imaging and resolution currently approach to a few nanometers with these techniques. For example, single-molecule FRET has been used to determine the size and to reveal structural changes within nanometer-size bio-complexes that cannot be resolved by conventional optical microscopy (Rueda et al. 2004; Zhuang et al. 2000; McKinney et al. 2003; Liu et al. 2007). The distance resolved by this technique ranges from approximately 1 to 7.5 nm (Ha 2001), depending on the FRET donor/acceptor pair used.
A single-molecule dual-viewing total internal reflection fluorescence imaging system (SMDV-TIRF) was assembled with the ability of simultaneous multi-color excitation and multi-color detection (Shu et al. 2007; Zhang et al. 2007, 2009), and was applied in single molecule fluorescence imaging. The system was based on use of the prism-type total internal reflection to reduce background noise from the bulk solution. It also contained a laser combiner that combined multiple lasers, which allows the excitation of multiple fluorophores at the same time. The simultaneous dual-color imaging has been applied to confirm the assemble of both Cy3- and Cy5-RNA onto the same phi29 motor molecule (Shu et al. 2007; Zhang et al. 2007, 2009). In this report, we focus on the construction of a dual laser combiner to enable the simultaneous excitation of dual-labeled single molecules and the measurement of the distances between a single FRET pair in a phi29 packaging-RNA molecule.
Materials and methods
Constructs of dual-labeled pRNA dimer for simultaneous dual-color excitation and imaging
Single Cy3 labeling of the pRNA at its 5′ end was achieved by transcription with ADOTM F550/570 AMP (AdeGenix, Inc.) as described previously (Shu et al. 2007; Zhang et al. 2007; Li et al. 2005). The Cy5-pRNA was labeled by annealing the 3′ end extended pRNA with a biotin/Cy5 labeled DNA oligo (IDT). The pRNA dimer was formed by mixing equal amount of the two pRNA monomer in the presence of Mg2+.
Isolation of procapsid/dual-labeled pRNA complexes or dual-labeled packaging intermediate for simultaneous dual-color excitation and imaging
The dual-labeled pRNA dimer was mixed with procapsid of phi29 motor and isolated as described before using 5–20% sucrose gradient (Shu et al. 2007; Zhang et al. 2007). Dual-labeled packaging intermediate was made by packaging of Cy5-DNA using a motor containing Cy3-pRNA as reported previously (Shu et al. 2007). The complex was isolated by 5–20% sucrose gradient (Shu et al. 2007).
Preparation of the dual-labeled dsDNA oligos
Double-stranded DNA oligos were prepared by the annealing of a 26nt 3′ Cy5 labeled DNA oligo containing a biotin at its 5′ end, with 3′Cy3 labeled DNA oligos of different length (10nt, 12nt, 15nt and 17nt). The labeled DNA oligos were purchased from Integrated DNA Technology (IDT).
Constructs of pRNA monomers in FRET studies
The pRNA molecules were transcribed in vitro with their 3′ ends extended by 26-nucleotide for pRNA 1 and 2, and by 18-nucleotide for pRNA 3. All three pRNAs were labeled at their 5′ ends by transcription as described above. Different biotin/Cy5 labeled DNA oligos (IDT) were annealed to the Cy3-pRNAs to generate the three different pRNA constructs with dual-color labels.
Single molecular imaging for simultaneous dual-color detection and FRET detection
The dual-labeled pRNA dimer, the dsDNA distance rulers and differently constructed pRNA molecules were fixed to a TIRF chamber through biotin-streptavidin interaction. The procapsid/dual-labeled pRNA complexes or dual-labeled packaging intermediate was immobilized to the chamber by antibody-antigen interaction. A 532 nm green laser was used for excitation of Cy3 and a 635 nm laser was used for excitation of Cy5. Both lasers were turned on for simultaneous excitation of Cy3 and Cy5, in order to confirm the co-existence of the two fluorophores in the same complex. When detecting FRET, only the 532 nm laser was turned on. The signals were recorded using Andor iXon 887 V back-illuminated electron-multiplying CCD (EMCCD) camera (Andor Technology), with a 512 × 512-pixel chip and a pixel size of 16 µm. A Dual-View™ imager (Photometrics) was inserted between the microscope and the camera for simultaneous dual-color fluorescence imaging. A 60x objective (NA = 1.4, oil immersion) with additional 1.6x magnification was used for collecting the fluorescence signals. To prevent fast photobleaching, the flow cell was infused, before fluorescence imaging, with an oxygen scavenger system (0.5% β-D-glucose, 10 mM β-mercaptoethanol, and 1% GODCAT solution, a mixture of Glucose Oxidase and Catalase). The concentration of the samples was adjusted to show discrete fluorescent spots in the images. Sequential images were taken continuously with an exposure time of 200 to 500 msec. The recorded movie was analyzed by Andor iQ software (Andor Technology) to obtain the time trajectories of fluorescence intensities for both the Cy3 and Cy5 signals.
Results
Construction and laser alignment of a dual laser combiner
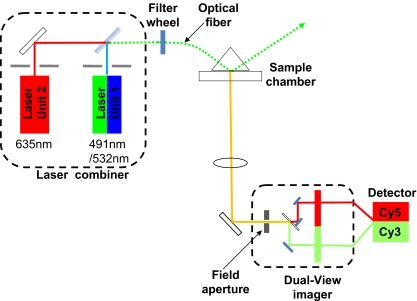
For the single molecule fluorescence imaging, lasers of different wavelengths were used as the excitation light source. For easier and safer manipulation of the lasers, a laser combiner (Andor Technology) was used in the imaging system (Fig. 1). The laser combiner contains two laser units inside, one of 491 nm/532 nm (50 mW) (Cobolt Dual Calypso CW 491+532 nm DPSS laser, wavelength selected by bandpass filters) and the other of 635 nm (25 mW) (Coherent CUBE laser). Each laser package is mounted on a mechanical adapter module to ensure similar beam height, while each laser beam is directed through a BK7 glass prism (ThorLabs, USA) for final and precise height adjustment. The lasers are mounted at 90 degrees to the final emission path and mirrors supported at 45 degrees on kinematic adjusters are used for lateral alignment. A first surface mirror is used for 635 nm steering, while the 491 nm/532 nm laser, mounted closest to the optical fiber launch, is steered with a long pass (LP) edge dichroic mirror (Chroma, USA). The edge is at 550 nm, allowing high efficiency transmission (>90%) of the 635 nm line, and simultaneous reflection (~90%) of the 491 nm/532 nm line. Only minor adjustment of the optical fiber launcher is necessary after laser alignment. The system stability ensures reliable operation without further adjustment.
Fig. 1.
Schematic diagram of the customized single molecule dual-color imaging system, containing a laser combiner and a Dual-View™ imager
The co-aligned beams are delivered into a single mode optical fiber (Oz Optics, Canada) outside the combiner box. The laser combiner construction creates a highly stable opto-mechanical system to minimize optical noise and drift in the output beam. This is essential for efficient coupling into the optical fiber whose core diameter is only 3.5 µm. The laser beams can be turned on separately for single-color, or simultaneously for dual-color by individual shutters. The laser combiner includes a safety interlock feature to ensure safe operation of the Class 3B lasers. The use of the combiner with the fiber makes it easy to align the beam and switch between beams. It also saves spaces in alignment of the beam. The use of the fiber to replace the multiple reflecting mirrors greatly facilitates the laser beam alignment. For beam processing before illuminating the TIRF prism, the optical fiber output is coupled to a beam collimator mounted with height and angular adjustment. The collimated laser beam intensity is controlled via an external ND filter wheel.
Tuning of lasers
The wavelength output of the fiber is controlled by an electronic shutter inside the combiner. As the laser of 491 nm and the laser 532 nm are lasing out of the same laser unit 1 (Fig. 1), the two beams are separated by two bandpass filters with ranges of 488–505 nm and 519–700 nm (Semrock), respectively, when used alone. As the laser unit 1 and 2 can be controlled separately by the shutters inside the cominber, multiple lasers can be used simultaneously. For example, by turning on laser unit 1 and 2 and using the bandpass filter 519–700 nm, both the 532 nm and the 635 nm lasers can concurrently excite Cy3 and Cy5. The beam was directed to the prism by a series of mirrors and lens. The laser power was adjusted by the addition of neutral densities in the light pathway. The optimized laser power ensures that the fluorophores can be photobleached with reasonable signal to noise ratio. Specific filter cubes were chosen for each fluorophore used in the experiment to ensure optimal emission detection. The incident angle at the side of the prism is about 30 deg. This makes the incident angle at the quartz/water interface about 70 deg, which gives the evanescent TIRF illumination field about 107 nm for the 491 nm laser, 116 nm for the 532 nm laser and 139 nm for the 635 nm laser.
To further control the laser powers for dual-color imaging with simultaneous excitation by two lasers, it is sometime necessary to use a certain density filter to ensure a similar photostability of the two different fluorophores during imaging. For example, when imaging Cy3 and Cy5 at the same time, a short-wave pass filter (Chroma) is used, as Cy5 is usually less stable than Cy3 under continuous illumination. This filter allows 80% intensity of the 532 nm laser to pass through, but only 10% of the 635 nm laser can be transmitted. The resulting combined laser with reduced intensity of the 635 nm laser ensures similar stability of both Cy3 and Cy5 during the same time period.
Collection of the dual-color fluorescence signals simultaneously with high sensitivity
Fluorescence signals were collected using a back-illuminated electron-multiplying CCD (EMCCD) camera (Andor Technology. Back-illuminated CCD sensors provide the highest detector quantum efficiency (QE) (QE > 90% in the range 500–660 nm; QE > 80% from 450 to 750 nm). The sensor is mounted in a permanent vacuum sealed housing, which allows deep cooling and protects the sensor from contaminant degradation and therefore ensures long term performance. Deep cooling has several benefits for EMCCD sensors in particular, including low dark current and enhanced stability. Dark signal is greatly reduced with temperature, thereby reducing signal background, while EM Gain increases exponentially with reducing chip temperature. Therefore lower drive voltages can be used to achieve a desired EM Gain, enhancing thermal stability. The operating temperature of the camera has been set to −70 ˚C in our experiments for imaging. A proprietary baseline clamp and EM gain stabilization scheme is implemented in the camera firmware to further enhance stability.
Well-designed EMCCD cameras amplify EM signals above readout noise, which is the ultimate limitation in conventional CCD detectors. However, the advantage is limited by any spurious charge created on the sensor as this produces more noise. It has been shown that clock-induced charge (CIC) is the primary source of background in deep-cooled EMCCD cameras. CIC is uniquely minimized in iXon cameras by controlling the vertical shift speed in the sensor as the signal charge is shifted from the imaging area to the storage area to the readout register on the chip. This capability ensures that CIC is minimized and helps to ensure that the camera provides single molecule detection performance.
The Dual-View™ imager (Fig. 1), generally known as a field splitter, provides chromatic separation of two emission signals using a dichroic mirror in a specific dual image path optical configuration. A horizontally restricted field aperture (slit), in the field splitter, is located at the microscope C-mount image plane and emission signals in this field are split by the dichroic into two optical paths. Each path contains (optional emission filter and) relay optics to project an image of the aperture onto one half of the EMCCD detector. The separation and location of these chromatically distinct images can be adjusted using the field splitter optical controls to ensure that their alignment is suitable for later separation and registration in the control software. With the appropriate Dual-View™ filter set (OI-06-EM, dichroic mirror 630 nm, Cy3 barrier filter 585 nm/30, Cy5 barrier filter 680 nm/35), the splitter separates the signals of Cy3 and Cy5 with minimal cross-talk. The simultaneous imaging eliminates the problem of time-shift artifacts when co-localize multiple fluorophores.
The instrument control and image acquisition is handled by Andor iQ. It is optimized for the EMCCD camera operation and provides flexible, wizard based configuration of channels and protocols. In a typical protocol for photobleaching, iQ controls the laser switching, acquires the camera data according to user-defined timing and simultaneously displays and stores the data. When the field splitter is included, iQ accesses a file for dual wavelength alignment after acquisition is complete and a two-channel time-series data set results from a single operation. The dual channel image can be viewed in single channel or merged view using Field-Split Function. Intensity analysis of the time series is performed by simply drawing regions of interest onto the image display and selecting the Analysis function. Background regions are drawn to allow background intensity corrected data analysis.
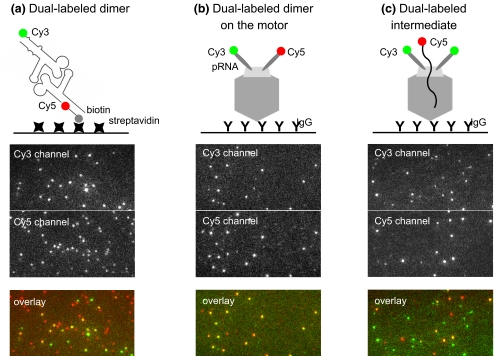
To demonstrate the sensitive dual-color imaging ability with the combiner and the EMCCD camera, a dual-labeled pRNA dimer was constructed based on the loop-loop interactions between pRNA molecules (Chen et al. 2000). One of the subunit in the dimer was labeled by Cy3 and its counterpart was annealed with a Cy5-DNA oligo which contains biotin moiety for immobilization to the streptavidin coated surfaces. The single molecule imaging with simultaneous dual-color excitation of the sample showed that the signals in Cy3 channel overlapped with that in Cy5 channel, indicating the formation of pRNA dimer (Fig. 2(a)). The dual-labeled pRNA dimer was assembled onto the phi29 motor and imaged by dual-color single-molecule TIRF (Fig. 2(b)). The Cy3 signal overlapped well with that from Cy5, which confirmed the co-existence of both Cy3- and Cy5-pRNA on the same motor. Dual-labeled DNA-packaging intermediate made of Cy3-pRNA and DNA was isolated and imaged with single-molecule TIRF (Fig. 2(c)). Simultaneous dual-color excitation of the sample showed the co-existence of Cy3 and Cy5 and thus confirmed that the Cy5 DNA was packaged into the motor which contained Cy3-pRNA (Fig. 2(c)).
Fig. 2.
Fluorescence images of simultaneous excitation of Cy3 and Cy5 fluorophores for (a) dual-labeled dimer; (b) dual-labeled dimer on the motor; and (c) dual-labeled packaging intermediate. The constructs of the samples are illustrated. Images showed fluorescence signals from both channels and the overlaid signals with pseudo color green representing Cy3, red representing Cy5 and yellow representing the overlap of Cy3 and Cy5
Detection and distance determination of single dsDNA molecule with dual labels
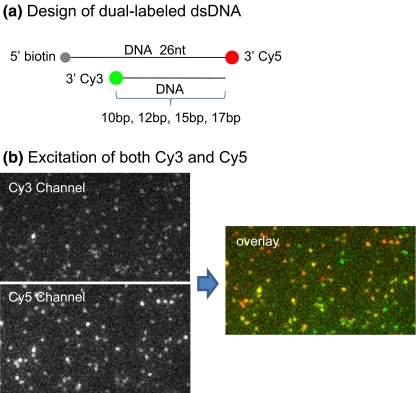
In the FRET studies reported here, one common FRET pair, Cy3 and Cy5, was used. A laser of 532 nm was used to excite the donor fluorophore, Cy3, and the laser of 635 nm was used to check the co-existence of the acceptor fluorophore Cy5 with Cy3. To test the ability of the customized single molecule imaging system, four dual-labeled DNA oligos with a known number of basepairs in between the FRET pair, Cy3 and Cy5, were tested (Fig. 3(a)). For TIRF imaging, the oligos also contain a biotin moiety so that they could be immobilized on a quartz surface through linkage of biotin-streptavidin (Fig. 3(a)). The co-existence of the two fluorophores on the same oligo molecule was confirmed by dual-color excitation as shown in a typical dual-color fluorescence image (Fig. 3(b)). Both the 532 nm laser and the 635 nm laser were turned on to excite Cy3 and Cy5 at the same time. It was found that most of the Cy3 signals overlapped with the Cy5 signals, represented by the yellow spots in Fig. 3(b). The un-overlapped Cy3 is probably due to the fast photobleaching of Cy5, as Cy5 is much less stable than Cy3. The un-overlapped Cy5 may be due to free biotin-Cy5 DNA oligos, or very high FRET efficiency of Cy3.
Fig. 3.
(a) Design of dsDNA with dual labels as distance rulers in single molecule FRET studies. Red spot represents the Cy5 label, green spot represents the Cy3 label, and the gray spot represents biotin for immobilization to a streptavidin coated surface. The distances between the FRET pair Cy3/Cy5 are 10 bp, 12 bp, 15 bp and 17 bp, respectively. (b) Typical fluorescence image of the dual-labeled dsDNA when Cy3 and Cy5 were excited simultaneously, and the computer processed image showing the overlapped Cy3 and Cy5 signal with pseudo colors (Red: Cy5; Green: Cy3; Yellow: co-existence of Cy3 and Cy5)
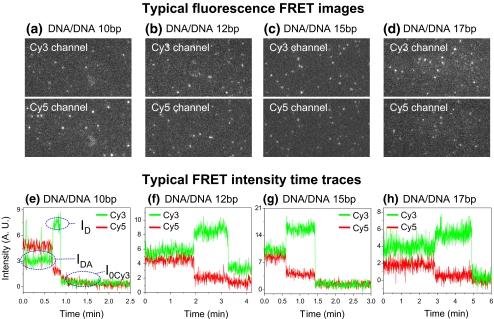
When only the 532 nm laser was used as the excitation light source, Cy5 signals due to FRET occurred as shown in Fig. 4(a–d). It was found that the intensities of Cy3 signals in samples of varying distances between the two fluorophores followed the order of 10 bp < 12 bp < 15 bp < 17 bp, and Cy5 signals followed the opposite order, as expected. The signals in the two channels were overlaid by using the aforementioned Field-Split function in Andor iQ. Each Cy3/Cy5 overlapped fluorescence signal was analyzed to give the time trajectories of fluorescence intensities. Figure 4(e–h) showed typical time trajectories of FRET events for each sample. Due to the light stability, Cy5 is usually photobleached before Cy3 under continuous illumination. When its intensity reached zero, there was a sudden jump in the intensity from Cy3, indicating the FRET is terminated. Such a single FRET event was used to calculate the FRET efficiency and then the distance between Cy3 and Cy5 from the intensity change of Cy3. The calculation is expressed in the following Eq. 1:
 |
1 |
Fig. 4.
(a–d) Typical FRET images with excitation of Cy3 only, for the dsDNA distance rulers 10 bp, 12 bp, 15 bp, and 17 bp, respectively. (e–h) Typical FRET traces for the dsDNA 10 bp, 12 bp, 15 bp, and 17 bp, respectively
In this equation, ID represents the intensity of the donor without the acceptor, IDA represents the intensity of the donor with the acceptor; and I0Cy3 represents the baseline intensity for Cy3 after photobleaching (Fig. 4(e)). The distance between the FRET pair can then be determined using Eq. 2:
 |
2 |
(R0, Foster distance, 5.3 nm for Cy3/Cy5 pair (Ishii et al. 1999; Coban et al. 2006)).
For all four DNA oligos (10, 12, 15, 17 bp), the individual FRET events were analyzed using the aforementioned equations. The results were then summarized for each sample and displayed in histograms (Fig. 5). Each graph shows either the distribution in FRET efficiency or in the deduced distances calculated from FRET efficiency. Both distributions followed Gaussian distribution and were subjected to Gaussian fitting. The peaks of the fitted curves indicate the mean values of the measurements, while the widths of the peaks represent the variation for each individual molecule in one sample (Fig. 5). The data is summarized in Table 1.
Fig. 5.
Histograms summarized from single molecule studies for FRET efficiencies (a–d) and calculated distances (e–h) for the dsDNA 10 bp, 12 bp, 15 bp, and 17 bp, respectively
Table 1.
Summary of data from single molecule FRET studies for the dsDNA distance rulers
| Number of molecules analyzed | FRET efficiency (E) | Distance (nm) | |
|---|---|---|---|
| DNA/DNA 10 bp | 79 | 0.643 ± 0.039 | 4.823 ± 0.116 |
| DNA/DNA 12 bp | 108 | 0.471 ± 0.069 | 5.376 ± 0.245 |
| DNA/DNA 15 bp | 99 | 0.389 ± 0.033 | 5.705 ± 0.166 |
| DNA/DNA 17 bp | 77 | 0.315 ± 0.063 | 6.030 ± 0.269 |
Relating the number of basepairs between the FRET pair with FRET efficiency
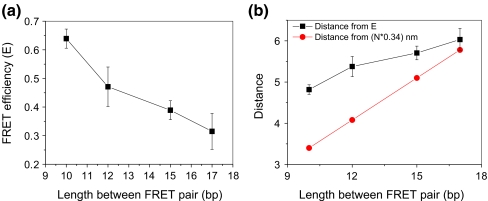
Figure 6(a) shows the relationship of the FRET efficiencies with the number of basepairs between the FRET pair. The FRET efficiency decreases with the number of basepairs between the single FRET pair, as expected. Lower efficiency in energy transfer signifies a greater distance between the two fluorophores. The distances deduced from FRET efficiencies increased with the number of baserpairs as exhibited in Fig. 6(b). However it slightly deviated from the linear relationship indicated by the red line (obtained from multiplying base pair numbers by 0.34 nm) in Fig. 6(b).
Fig. 6.
(a) Relationship of FRET efficiencies with numbers of basepairs between the FRET pair. The error bars were obtained from the variances of the measurements. (b) Relationship of calculated distances with numbers of basepairs between the FRET pair. (Black: distances deduced from FRET efficiency E. Red: Theoretical distances based on 0.34 nm per basepair.)
The orientation and arm sizes of the fluorophores on the dsDNA helix are two important factors that should be considered for distance measurement, especially for short dsDNA. Due to folding and flexibility in molecular arrangement, it is not possible to obtain a fixed value of arm size for each fluorophore. A cylindrical model was suggested to determine the distance between a FRET pair at the two ends of a dsDNA duplex (Norman et al. 2000; Clegg et al. 1993). The lengths and angles of the fluorescent arms sticking out from the axis of the helix were taken into account to obtain the true distance between the two fluorophores. It was found that the distances calculated for the four dual-labled dsDNA samples of 10 bp, 12 bp, 15 bp and 17 bp are close to that in the literature (Norman et al. 2000).
Detection and structure determination of phi29 motor pRNA with dual-label
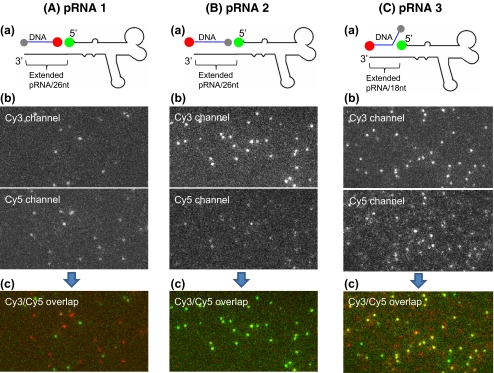
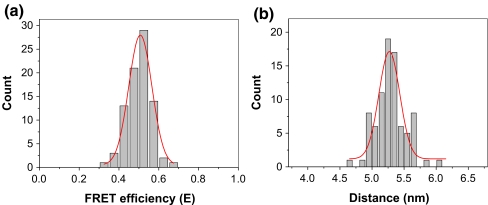
Three different phi29 motor packaging-RNAs (pRNA) were constructed with dual-label as indicated in Fig. 7. A Cy3 fluorophore was added to the 5′ of the pRNA molecules by transcription with a fluorescent-AMP (Shu et al. 2007; Zhang et al. 2007; Li et al. 2005). The 3′ end of the pRNA molecule was extended and annealed with a biotin/Cy5 DNA oligo. Single molecule FRET was applied to test the structural differences among these three pRNA constructs. Typical FRET images with excitation of Cy3 only and Cy3/Cy5 overlapped FRET images are shown in Fig. 7. pRNA 1 showed high energy transfer, as there are un-overlapped Cy5 signals in the overlapped FRET image, while no FRET occurred for the pRNA 2. However, pRNA 3 showed intermediary FRET efficiency. The single molecule FRET signals were studied for pRNA 3 and the data was summarized in Fig. 8. The mean value of E was measured to be 0.507 with a variance of 0.058 in the measurements, and the distance to be 5.270 with a variance of 0.163 nm.
Fig. 7.
FRET studies of different dual-labeled pRNAs (A–C). (A)(a) Design of dual-labeled pRNA 1. The 3′ end of pRNA was extended by 26 nucleotides. (b) Typical FRET image of pRNA 1, with Cy3 excitation only. (c) Overlapped FRET image in (b). (B)(a) Design of dual-labeled pRNA 2. The 3′ end of pRNA was extended by 26 nucleotides. (b) Typical FRET image of pRNA 2, with Cy3 excitation only. (c) Overlapped FRET image in (b). (C)(a) Design of dual-labeled pRNA 3. The 3′ end of pRNA was extended by 18 nucleotides. (b) Typical FRET image of pRNA 3, with Cy3 excitation only. (c) Overlapped FRET image in (b). In Fig. 7(A)(a), (B)(a) and (C)(a), red spot represents Cy5 label, green spot represents Cy3 label, gray spot represents biotin for immobilization to streptavidin coated surface, and blue line represent DNA oligo
Fig. 8.
Histograms of FRET efficiencies (a) and calculated distances (b) for pRNA 3
Discussion
Many donor/acceptor pairs of fluorophores have been successfully used for FRET of protein, RNA and DNA. Ideal fluorophores for single-molecule FRET should be bright, small, photostable, and able to be excited and to emit in the visible region (Ha 2001). The accurate determination of E relies on the stable signal of IA, ID, and IAD. If the fluorescent intensity fluctuates in real time, accurate determination of E would not be possible. The FRET pair Cy3/Cy5 has been commonly used for single molecule FRET studies because of its efficient overlap in donor emission and acceptor absorbance spectra. Additionally the pair exhibits minimal signal crosstalk and it was therefore chosen for our experiments. Compared to other fluorophores such as Alexa Dyes, GFP, Rhodamine, fluorescein, and quantum dots, Cy3 and Cy5 produced more stable signals in real time. Besides the stability, in order to calculate the FRET efficiency from the intensity change of the donor, the acceptor should be readily bleached before the donor under experimental conditions. It was found that Cy5 has a much shorter life time and is bleached more easily.
The customized single-molecule dual-viewing TIRF imaging system (SMDV-TIRF) is capable of detecting single molecules, as well as two different dyes simultaneously. The laser combiner enables easy manipulation of lasers with different wavelengths for dual view analysis. The single molecule FRET studies showed that the imaging system is capable of detecting the length difference of two basepairs. We have also demonstrated that it can be used to study the structure of the phi29 motor pRNA. The pRNA 3 in Fig. 7 has 18 basepairs of DNA/RNA hybrid between Cy3 and Cy5. The distance measured between the two fluorophores is about 5.270 nm, which is shorter than that measured for dsDNA 17 bp. This is due to the different helical structure that the DNA/RNA hybrid adopts.
Acknowledgements
We thank Dr. Anne Vonderheide for comments. This work was mainly supported by National Institutes of Health (R01-EB003730 and R01-GM59944) and by National Institutes of Health Nanomedicine Development Center (NDC) of “Phi29 DNA Packaging Motor for Nanomedicine” (PN2-EY018230) through the NIH Roadmap for Medical Research (PG).
Open Access
This article is distributed under the terms of the Creative Commons Attribution Noncommercial License which permits any noncommercial use, distribution, and reproduction in any medium, provided the original author(s) and source are credited.
Footnotes
Hui Zhang and Dan Shu are co-first author.
References
- Adachi K, Yasuda R, Noji H, Itoh H, Harada Y, Yoshida M, Kinosita K., Jr Proc. Natl. Acad. Sci. U. S. A. 2000;97:7243. doi: 10.1073/pnas.120174297. [DOI] [PMC free article] [PubMed] [Google Scholar]
- Chang CL, Zhang H, Shu D, Guo P, Savran CA. Appl. Phys. Lett. 2008;93:153902-3. doi: 10.1063/1.3000606. [DOI] [PMC free article] [PubMed] [Google Scholar]
- Chen C, Sheng S, Shao Z, Guo P. J. Biol. Chem. 2000;275:17510. doi: 10.1074/jbc.M909662199. [DOI] [PubMed] [Google Scholar]
- Churchman LS, Okten Z, Rock RS, Dawson JF, Spudich JA. Proc. Natl. Acad. Sci. U. S. A. 2005;102:1419. doi: 10.1073/pnas.0409487102. [DOI] [PMC free article] [PubMed] [Google Scholar]
- Clegg RM, Murchie AIH, Zechel A, Lilley DMJ. Proc. Natl. Acad. Sci. U. S. A. 1993;90:2994. doi: 10.1073/pnas.90.7.2994. [DOI] [PMC free article] [PubMed] [Google Scholar]
- Coban O, Lamb DC, Zaychikov E, Heumann H, Nienhaus GU. Biophys. J. 2006;90:4605. doi: 10.1529/biophysj.105.078840. [DOI] [PMC free article] [PubMed] [Google Scholar]
- Deniz AA, Dahan M, Grunwell JR, Ha T, Faulhaber AE, Chemla DS, Weiss S, Schultz PG. Proc. Natl. Acad. Sci. U. S. A. 1999;96:3670. doi: 10.1073/pnas.96.7.3670. [DOI] [PMC free article] [PubMed] [Google Scholar]
- Finer JT, Simmons RM, Spudich JA. Nature. 1994;368:113. doi: 10.1038/368113a0. [DOI] [PubMed] [Google Scholar]
- Gordon MP, Ha T, Selvin PR. Proc. Natl. Acad. Sci. U. S. A. 2004;101:6462. doi: 10.1073/pnas.0401638101. [DOI] [PMC free article] [PubMed] [Google Scholar]
- Ha T. Methods. 2001;25:78. doi: 10.1006/meth.2001.1217. [DOI] [PubMed] [Google Scholar]
- Harke B, Keller J, Ullal CK, Westphal V, Schoenle A, Hell SW. Opt. Express. 2008;16:4154. doi: 10.1364/OE.16.004154. [DOI] [PubMed] [Google Scholar]
- Hess H, Howard J, Vogel V. Nano. Lett. 2002;2:1113. doi: 10.1021/nl025724i. [DOI] [Google Scholar]
- Huang B, Wang WQ, Bates M, Zhuang XW. Science. 2008;319:810. doi: 10.1126/science.1153529. [DOI] [PMC free article] [PubMed] [Google Scholar]
- Ishii Y, Yoshida T, Funatsu T, Wazawa T, Yanagida T. Chem. Phys. 1999;247:163. doi: 10.1016/S0301-0104(99)00174-3. [DOI] [Google Scholar]
- Johnson DS, Bai L, Smith BY, Patel SS, Wang MD. Cell. 2007;129:1299. doi: 10.1016/j.cell.2007.04.038. [DOI] [PMC free article] [PubMed] [Google Scholar]
- Li N, Yu C, Huang F. Nucleic Acids Res. 2005;33:e37. doi: 10.1093/nar/gni036. [DOI] [PMC free article] [PubMed] [Google Scholar]
- Liu SX, Bokinsky G, Walter NG, Zhuang XW. Proc. Natl. Acad. Sci. U. S. A. 2007;104:12634. doi: 10.1073/pnas.0610597104. [DOI] [PMC free article] [PubMed] [Google Scholar]
- McKinney SA, Declais AC, Lilley DMJ, Ha T. Nat. Struct. Biol. 2003;10:93. doi: 10.1038/nsb883. [DOI] [PubMed] [Google Scholar]
- Myong S, Bruno MM, Pyle AM, Ha T. Science. 2007;317:513. doi: 10.1126/science.1144130. [DOI] [PMC free article] [PubMed] [Google Scholar]
- Noji H, Yasuda R, Yoshida M, Kinosita K., Jr Nature. 1997;386:299. doi: 10.1038/386299a0. [DOI] [PubMed] [Google Scholar]
- Norman DG, Grainger RJ, Uhrin D, Lilley DM. Biochemistry. 2000;39:6317. doi: 10.1021/bi992944a. [DOI] [PubMed] [Google Scholar]
- Qu XH, Wu D, Mets L, Scherer NF. Proc. Natl. Acad. Sci. U. S. A. 2004;101:11298. doi: 10.1073/pnas.0402155101. [DOI] [PMC free article] [PubMed] [Google Scholar]
- Romberg L, Vale RD. Nature. 1993;361:168. doi: 10.1038/361168a0. [DOI] [PubMed] [Google Scholar]
- Rueda D, Bokinsky G, Rhodes MM, Rust MJ, Zhuang X, Walter NG. Proc. Natl. Acad. Sci. U. S. A. 2004;101:10066. doi: 10.1073/pnas.0403575101. [DOI] [PMC free article] [PubMed] [Google Scholar]
- Rust MJ, Bates M, Zhuang XW. Nature Methods. 2006;3:793. doi: 10.1038/nmeth929. [DOI] [PMC free article] [PubMed] [Google Scholar]
- Schnitzer MJ, Block SM. Nature. 1997;388:386. doi: 10.1038/41111. [DOI] [PubMed] [Google Scholar]
- Shu D, Zhang H, Jin J, Guo P. EMBO J. 2007;26:527. doi: 10.1038/sj.emboj.7601506. [DOI] [PMC free article] [PubMed] [Google Scholar]
- Smith DE, Tans SJ, Smith SB, Grimes S, Anderson DL, Bustamante C. Nature. 2001;413:748. doi: 10.1038/35099581. [DOI] [PubMed] [Google Scholar]
- Svoboda K, Block SM. Cell. 1994;77:773. doi: 10.1016/0092-8674(94)90060-4. [DOI] [PubMed] [Google Scholar]
- Wang MD, Schnitzer MJ, Yin H, Landick R, Gelles J, Block SM. Science. 1998;282:902. doi: 10.1126/science.282.5390.902. [DOI] [PubMed] [Google Scholar]
- Willig KI, Harke B, Medda R, Hell SW. Nature Methods. 2007;4:915. doi: 10.1038/nmeth1108. [DOI] [PubMed] [Google Scholar]
- Yasuda R, Noji H, Yoshida M, Kinosita K, Jr, Itoh H. Nature. 2001;410:898. doi: 10.1038/35073513. [DOI] [PubMed] [Google Scholar]
- Yildiz A, Forkey JN, McKinney SA, Ha T, Goldman YE, Selvin PR. Science. 2003;300:2061. doi: 10.1126/science.1084398. [DOI] [PubMed] [Google Scholar]
- Yildiz A, Tomishige M, Vale RD, Selvin PR. Science. 2004;303:676. doi: 10.1126/science.1093753. [DOI] [PubMed] [Google Scholar]
- Zhang H, Shu D, Huang F, Guo P. RNA. 2007;13:1793. doi: 10.1261/rna.587607. [DOI] [PMC free article] [PubMed] [Google Scholar]
- H. Zhang, D. Shu, M. Browne, P. Guo, IEEE/NIH Life Science Systems and Applications Workshop 2009, 124 (2009) [DOI] [PMC free article] [PubMed]
- Zhuang X, Bartley LE, Babcock HP, Russell R, Ha T, Herschlag D, Chu S. Science. 2000;288:2048. doi: 10.1126/science.288.5473.2048. [DOI] [PubMed] [Google Scholar]


