Abstract
Diffusion tensor imaging (DTI) has become a standard clinical procedure in assessing the health of white matter in the brain. Tractography, the tracing of individual fibers in the brain using DTI data, has begun to play a more central role in neuroscience research, particularly in understanding the relationships between brain connectivity and behavior. The measuring of features related to bundles of fibers, i.e., tracts or fasciculi, is currently problematic because of the need for manual interaction. This article presents an algorithm for the automatic identification of selected white matter tracts. It extracts fibers using the FACT algorithm and finds cortical gyral labels using a multi-atlas deformable registration scheme. Tracts are identified as the fibers passing between selected cortical labels. The quality of automatic labels are compared both visually and numerically against a well-accepted manual approach. The automatic approach is shown to be more consistent with conventional definitions of tracts and more repeatable on separate scans of the same subject.
Index Terms: Image segmentation, Magnetic resonance imaging
1. INTRODUCTION
Diffusion tensor imaging (DTI) [1] is a recently developed imaging modality that provides insight into the direction of diffusion in tissue. By obtaining at least 6 diffusion-weighted images [2], a tensor that describes this diffusion can be computed. At each voxel, the direction of strongest diffusion is indicated by the principal eigenvector of the tensor. In cortical white matter (WM), it indicates the direction of parallel groups of myelinated axons, or fibers, which give rise to a high fractional anisotropy (FA) [3]. Fiber tracking algorithms [4, 5] have successfully been used to reconstruct white matter fibers in the human brain. In this paper, we are interested in the connective properties of large bundles of such fibers, known as fiber tracts, or fasciculi. It has been shown that fiber tracking methods can reliably reconstruct major fasciculi [6].
A variety of pathologies have been shown to adversely affect these anatomically well known fiber tracts [7]. It is therefore of great interest to identify fibers that are part of these tracts among all those generated by tractography algorithms. Region of interest (ROI) approaches have been the most commonly used methods of identifying such tracts. Regions are typically drawn on color mapped images obtained from the FA and the primary eigenvector, though the cortical surface has also been used as an anatomical reference for the manual placement of ROIs [8, 9]. Tracts are then identified as those fibers passing through the ROIs.
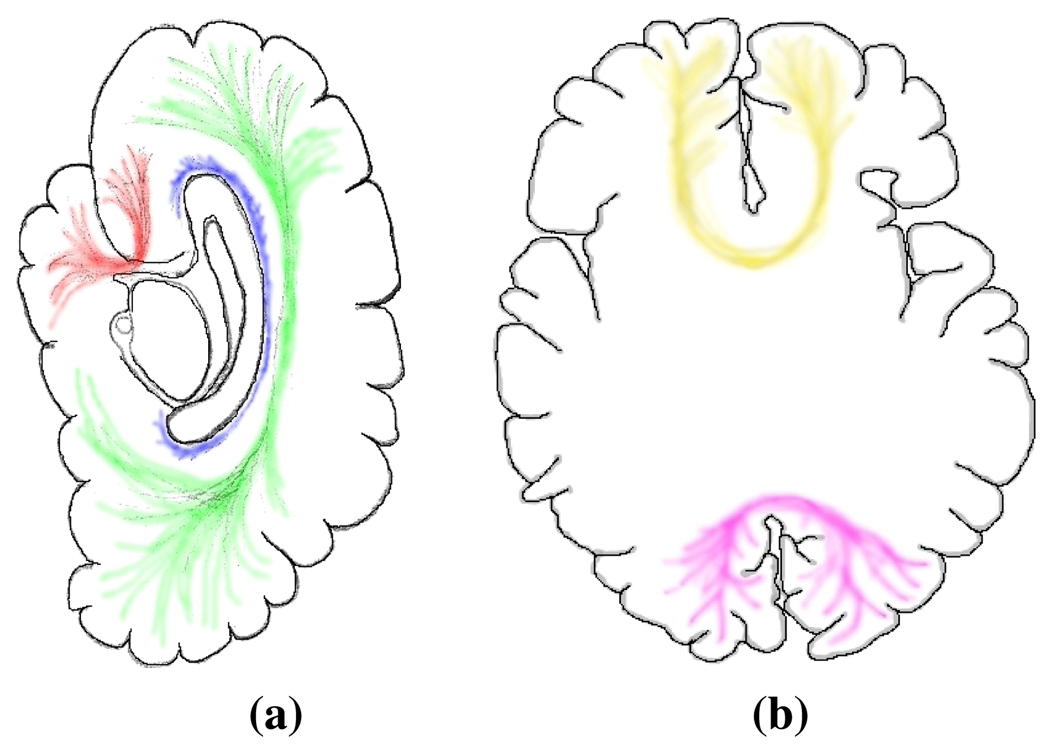
ROI-placement protocols are written so as to capture a tract’s known qualitative, morphological characteristics [10]. For example, ROIs designed to locate the Forceps Major (see Fig. 1) would aim to capture fibers starting in one hemisphere’s occipital lobe, traversing the splenium of the corpus callosum, and terminating in the contralateral occipital lobe. Validation studies have shown agreement between true anatomy and major tracts found using these methods [5].
Fig. 1.
(a) Sagittal illustration of the cerebral cortex and three major fasciculi, (red) Uncinate, (green) Superior longitudinal Fasciculus and (blue) Cingulum. (b) Axial illustration showing (yellow) Forceps Minor and (magenta) Forceps Major.
There exist several difficulties with these ROI schemes. First, it is unreasonable to expect a protocol to fully capture all these qualitative aspects and also be reproducible in a reasonable amount of time for human raters. Furthermore, when considering the gyri connected by these fibers, we observe connectivity that disagrees with reported anatomy. This motivates the development of a tract identification method based on anatomical connectivity.
In this paper we introduce a fully automated method for identifying major white matter tracts that addresses these issues. The details of our methodology are described in Section 2. In Section 3 we use the algorithm on four repeated scans from three subjects to establish reliability and enable comparison against outlines provided by a human rater.
2. METHOD
Our aim is to identify WM fibers of interest using information from structural magnetic resonance images (MRIs), such as spoiled gradient echo (SPGR) or magnetization prepared rapid gradient echo (MP-RAGE). As described below, our algorithm includes geometry correction and an atlas-driven gyral labeling scheme.
2.1. Geometry Correction
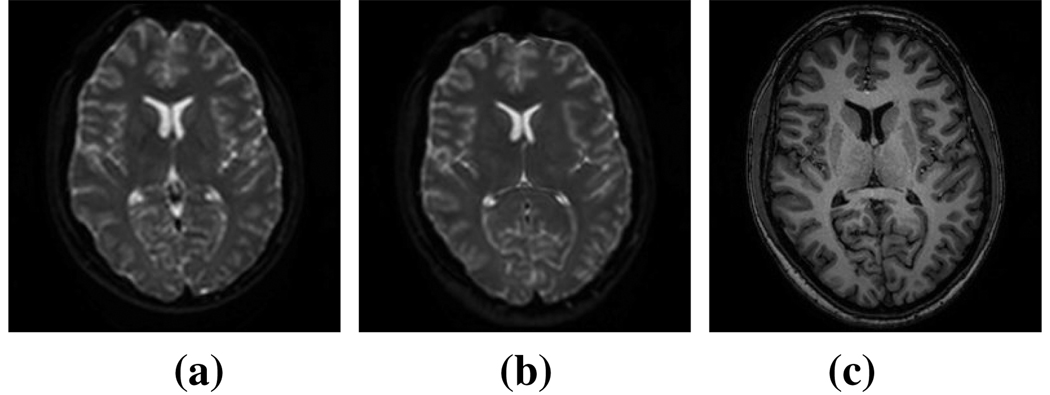
Echo Planar imaging (EPI) is a fast imaging sequence that is typically used in DTI in order to keep scan times as low as possible. EPI acquisitions suffer from geometric distortion due to susceptibility changes in the field of view (FOV). Since a structural MRI better represents a subject’s anatomy, we use it as our reference space. We bring the subject’s DTI data into the MRI space by first making both data sets isotropic in order to more adequately fit the two data sets together. We then use the Adaptive Bases Algorithm (ABA) [11] to deformably register the DTI and MRI acquisitions. We use the B0 image of the DTI data as the subject image for the registration with the structural MRI as the target image. The B0 image is a non-diffusion weighted reference image acquired as a standard part of any DTI protocol. The ABA registration is a normalized mutual information registration algorithm which makes it ideal for handling the different modalities. The registration maximizes mutual information with an underlying deformation field modeled on radially symmetric basis functions. Once we have registered the B0 to the MRI, we apply the deformation field to all directions of the DTI data, thus bringing everything in to the structural MRI space. See Fig. 2 for an example.
Fig. 2.
(a) A slice of the B0 image before distortion correction. (b) The same slice of the B0 image after the correction. (c) The reference image, in this case an MP-RAGE data set.
2.2. Gyral Labeling
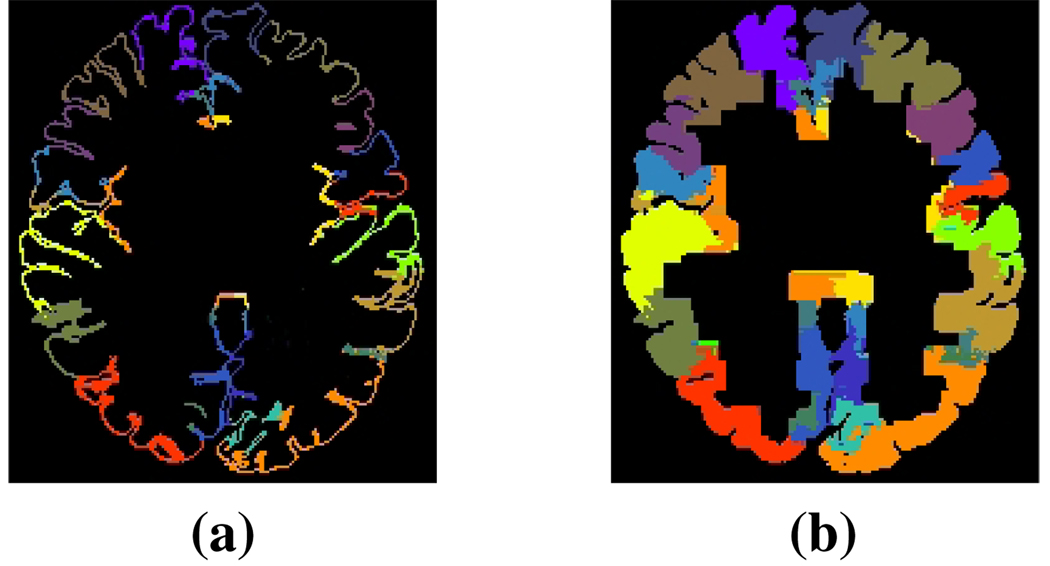
We label the MRI in two steps. First we transform labels from 30 MP-RAGE atlas subjects acquired on a 1.5T Vision System (Siemens, Erlangen Germany) with two sagittal acquisitions that were averaged to increase the contrast-to-noise ratio. A more detailed description of the acquisition and how the subjects were originally labeled is available in [12]. The atlases originally contained 33 labels per hemisphere, but some of these labels were determined to be inconsistently identified. Such labels were merged with an appropriate adjacently labeled region to form a superset of 40 labels, 20 on each hemisphere. The transfer of labels was performed using the ABA registration, after which we used a simple voting scheme to determine the label of a voxel within the subject space. We required that a voxel receive at least 15 votes from the atlases in order to receive a given label. The second stage of labeling the MRI involves propagating the labels from the gyral labels into the subcortical space using a fast marching approach. These labels extend 10 voxels (~8mm) in from the cortical surface. The original and propagated gyral labels are shown in Figure 3. We do this simply because the vast majority of fibers become impossible to track at the gray matter (GM), WM interface.
Fig. 3.
Labels (a) before and (b) after the propagation.
2.3. Fiber Tracking and Tract Identification
Fiber tracts are obtained by using the FACT algorithm [4] with a FA threshold of 0.2 and an angular threshold of 40°. Fibers are associated with the labels of the two voxels containing the end points of the fiber. In this way, fibers that connect gray matter are associated with two cortical labels, which we interpret as part of a tract connecting the two corresponding gyri. Such fibers constitute about 62 percent of the total number of fibers found by FACT.
Finally to locate a given fasciculus, our algorithm takes a set of pairs of gyral regions that should characterize a particular tract. For example, the forceps major was identified as those fibers connecting the right and left occipital lobes which include the cuneus, lingual, and lateraloccipital gyri. The sets of gyral pairings that we use to describe the major white matter tracts come, generally, from the known anatomy of fasciculi. The classical descriptions speak of connections between lobes rather than gyri, so we also consider the gyral connections exhibited by the manually delineated tracts. We describe the gyral pairings we used in more detail in the next section.
3. RESULTS
Scans for three subjects (2 Male, 1 Female, all right handed aged 23, 28 and 31) were obtained using a 3.0T Philips (Philips Medical Systems, Netherlands) Intera scanner. A single-shot EPI protocol with sensitivity encoding (SENSE) was used to obtain four separate 30 direction DTI acquisitions for each subject. The resulting images were 256×256×65 with a resolution of 0.828125×0.828125×2.2 mms. Additionally an MP-RAGE image was also obtained for each subject. The MP-RAGE was 256×256×130 with 0.828125×0.828125×1.1 mms resolution. All data was converted to have an isotropic voxel of length 0.828125mms, the resultant datasets were 256×256×173 in voxel dimension.
For this exploratory study, we focused on identifying four major white matter tracts: the uncinate fasciculus (bilateral) (UNC), the forceps major (F-MAJ), and the forceps minor (F-MIN). We first delineated these fasciculi using a well known and accepted manual protocol [10]. Next, we applied our automatic fiber-gyral labeling method to these fibers to determine the gyri connected by each tract. This information, along with knowledge from anatomy [13], was used to determine gyral connections that best represent a given tract.
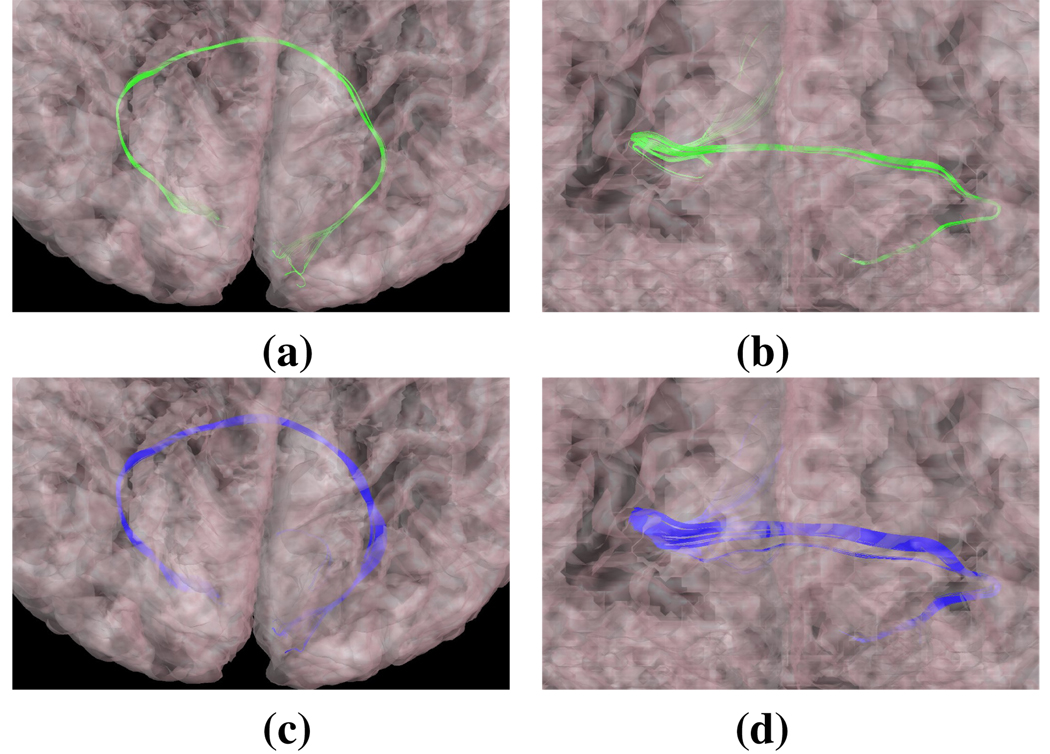
We can show visually that our automatically generated tracts possess the characteristics described histologically. For example, Fig. 4 shows the Forceps Major, generated both automatically and manually. There is clearly a strong cytoarchitectural resemblance between the automatic and manual fasciculi, which is borne out in the results in Table 2.
Fig. 4.
Orthogonal views of the Forceps Major delineated (a–b) manually and with our (c–d) automated processing. The semi-transparent cortical outer surface is also shown.
Table 2.
CI for 4 major tracts over fiber volume for each subject averaged over the four DTI scans.
| Subject | F-MAJ | F-MIN | UNC-R | UNC-L |
|---|---|---|---|---|
| 1 | 0.96 | 0.89 | 0.79 | 0.48 |
| 2 | 0.71 | 0.94 | 0.84 | 0.72 |
| 3 | 0.92 | 0.96 | 0.87 | 0.54 |
When examining the gyral connections for manually delineated tracts, it becomes apparent that the manual fibers sometimes exhibit unexpected behavior that disagree with known anatomy. For example, Table 1 shows gyral connectivity for the manually and automatically identified F-MAJ. Values above the main diagonal of the table represent fiber counts between gyri for the manual approach. Below the main diagonal shows results for the automatic method. Anatomical knowledge tells us that this tract should connect the contralateral occipital lobes, which include the cuneus, lateral occipital, and lingual gyri. However, for the manual tract, we also observe connections to the temporal lobe (Fusiform gyrus). These “mishits” are gone in the automatic result.
Table 1.
An example of anatomically incorrect gyral connectivity for a manually obtained (gray) F-MAJ and an anatomically correct and fuller result from the automatically obtained F-MAJ: Fiber counts for one data set are shown. CN: Cuneus, LO: Lateral Occipital, LI: Lingual and FF: Fusiform.
| Right | Left | |||||||
|---|---|---|---|---|---|---|---|---|
| CN | LO | LI | CN | LO | LI | FF | ||
| CN | - | 0 | 0 | 7 | 0 | 5 | 8 | |
| LO | 0 | - | 0 | 0 | 0 | 66 | 0 | |
| LI | 0 | 0 | - | 222 | 0 | 234 | 106 | |
| CN | 186 | 0 | 234 | - | 0 | 0 | 0 | |
| LO | 13 | 0 | 130 | 0 | - | 0 | 0 | |
| LI | 59 | 0 | 354 | 0 | 0 | - | 0 | |
| FF | 0 | 0 | 0 | 0 | 0 | 0 | - | |
Despite the shortcomings of the human rater, these results give a good idea of the major connections that characterize tracts. As seen above, strong connections between the right and left cuneus and lingual gyri are observed. Not all the fibers that represent this connection are part of the manually delineated tract, which is another failing of human selected ROIs. We therefore expect that our automated method will produce more fibers than an ROI-scheme.
We can see this is the case from the results in Table 1 and by noting that the average number of fibers the automated approach recovered for F-MAJ was 483 compared to 323 fibers with the manual approach, on the same subject. Suppose VM is the set of voxels containing manually generated fibers, and VA are those voxels containing automatically generated fibers. Then |VM ∩ VA|/|VA| is the containment index (CI) of the volume of the manual tracts in the volume of the automatic tracts, the results of which are shown in Table 2. CI is a measure of how much of the manual tracts are recoverable with our automated approach.
Table 2 shows that our automatically obtained tracts contain those that were manually identified. We can attribute the unrecovered portions to fibers in the manual tract that exhibit unexpected behavior as mentioned above. We also compared the reliability of the manual and automated methods. This was done by computing the dice coefficients between the sets of voxels VM obtained from different co-registered scans of the same subject. This metric describes the overlap of voxels containing a particular fasciculus between different scans. We repeated this using the sets VA. The mean and standard deviations of the results are shown in Table 3. With two exceptions, our automatic method yields more reproducible results than the manual method.
Table 3.
Mean (SD) of Dice Coefficients for intra subject methodology comparison.
| Subject | 1 | 2 | 3 | |
|---|---|---|---|---|
| F-MAJ | 0.23 (0.04) | 0.18 (0.11) | 0.38 (0.08) | |
| F-MIN | 0.65 (0.11) | 0.35 (0.12) | 0.27 (0.19) | |
| UNC-R | 0.54 (0.09) | 0.39 (0.10) | 0.28 (0.16) | |
| UNC-L | 0.30 (0.13) | 0.55 (0.08) | 0.31 (0.16) | |
| F-MAJ | 0.46 (0.06) | 0.26 (0.12) | 0.40 (0.07) | |
| F-MIN | 0.67 (0.07) | 0.70 (0.05) | 0.59 (0.07) | |
| UNC-R | 0.46 (0.08) | 0.45 (0.05) | 0.47 (0.09) | |
| UNC-L | 0.44 (0.07) | 0.47 (0.07) | 0.41 (0.08) | |
4. CONCLUSIONS
With this preliminary work on automated fasciculus identification we have shown that there are distinct flaws with using human raters for this task. While our approach is not yet perfect, it shows considerable promise. Our algorithm is currently limited by the resolution of the labeling scheme, which is why we currently recover more tracts then the anatomist expert. In future work, we will apply this method to more major fiber tracts and augment this new work with subcortical labels. We expect this will improve the quality of resulting tracts and facilitate the identification of different fasciculi.
Acknowledgments
This work was supported by the NIH/NINDS under grants R01 NS37747 and R01 NS56307. Data was provided by Dr. Bruce Fischl, Martinos Center for Biomedical Imaging, and supported by the NCRR through grants P41-RR14075 and R01 RR16594-01A1 and by the NIH/NINDS through grant R01 NS052585-01.
Contributor Information
John A. Bogovic, Email: bogovic@jhu.edu.
Aaron Carass, Email: aaron_carass@jhu.edu.
Jing Wan, Email: jingwan@jhu.edu.
Bennett A. Landman, Email: bennett@bme.jhu.edu.
Jerry L. Prince, Email: prince@jhu.edu.
REFERENCES
- 1.Basser PJ, et al. MR diffusion tensor spectroscopy and imaging. Biophys J. 1994;vol. 66:259–267. doi: 10.1016/S0006-3495(94)80775-1. [DOI] [PMC free article] [PubMed] [Google Scholar]
- 2.Jones DK, Horsfield MA, Simmons A. Optimal strategies for measuring diffusion in anisotropic systems by magnetic resonance imaging. Mag. Res. Med. 1999;vol. 42:515–525. [PubMed] [Google Scholar]
- 3.Basser PJ, Pierpaoli C. Microstructural and physiological features of tissues elucidated by quantitative-diffusion-tensor MRI. JMR B. 1996;vol. 111(no 3):209–219. doi: 10.1006/jmrb.1996.0086. [DOI] [PubMed] [Google Scholar]
- 4.Mori S, et al. Three dimensional tracking of axonal projections in the brain by magnetic resonance imaging. Annal. Neurol. 1999;vol. 45:265–269. doi: 10.1002/1531-8249(199902)45:2<265::aid-ana21>3.0.co;2-3. [DOI] [PubMed] [Google Scholar]
- 5.Conturo TE, et al. Tracking neuronal fiber pathways in the living human brain. Proc. Natl. Acad. Sci. 1999;vol. 96:10422–10427. doi: 10.1073/pnas.96.18.10422. [DOI] [PMC free article] [PubMed] [Google Scholar]
- 6.Ciccarelli O, et al. From diffusion tractography to quantitative white matter tract measures: a reproducibility study. NeuroImage. 2003;vol. 18(no 2):348–359. doi: 10.1016/s1053-8119(02)00042-3. [DOI] [PubMed] [Google Scholar]
- 7.Lee SK, et al. Diffusion-tensor mr imaging and fiber tractography: A new method of describing aberrant fiber connections in developmental CNS anomalies. Radiographics. 2005;vol. 25(no 1):53–65. doi: 10.1148/rg.251045085. [DOI] [PubMed] [Google Scholar]
- 8.Sherbondy A, et al. Exploring connectivity of the brain’s white matter with dynamic queries. IEEE Trans. on Visualization and Comp. Graphics. 2005;vol. 11(no 4):419–430. doi: 10.1109/TVCG.2005.59. [DOI] [PubMed] [Google Scholar]
- 9.Huang H, et al. Cortico-cortical connectivity revealed by DTI-based tractography. Proc. Int’l Soc. Mag. Res. Med. 2006 May [Google Scholar]
- 10.Wakana S, et al. Reproducibility of quantitative tractography methods applied to cerebral white matter. NeuroImage. 2007;vol. 36(no 3):630–644. doi: 10.1016/j.neuroimage.2007.02.049. [DOI] [PMC free article] [PubMed] [Google Scholar]
- 11.Rohde GK, Aldroubi A, Dawant BM. The adaptive bases algorithm for intensity based nonrigid image registration. IEEE Trans. Med. Imag. 2003;vol. 22:1470–1479. doi: 10.1109/TMI.2003.819299. [DOI] [PubMed] [Google Scholar]
- 12.Desikan RS, et al. An automated labeling system for sub-dividing the human cerebral cortex on MRI scans into gyral based regions of interest. NeuroImage. 2006;vol. 31(no 3):968–980. doi: 10.1016/j.neuroimage.2006.01.021. [DOI] [PubMed] [Google Scholar]
- 13.Bergman RA, Afifi AK. Functional neuroanatomy: text and atlas. New York: McGraw-Hill; 2005. [Google Scholar]


