Abstract
Previous methods to quantify dyssynchrony could not determine regional 3-dimensional (3-D)strain. We hypothesized that a novel 3-D speckle tracking strain imaging system can quantify left ventricular (LV) dyssynchrony and site of latest mechanical activation. We studied 64 subjects; 54 heart failure patients referred for cardiac resynchronization therapy (CRT) with ejection fraction 25±6% and QRS 165±29ms and 10 normal controls. The 3-D speckle tracking system determined radial strain using a 16-segment model from a pyramidal 3-D data set. Dyssynchrony was quantified as maximal opposing wall delay and standard deviation in time-to-peak strain. 3-D analysis was compared with standard 2-dimensional (2-D) strain data sets and site of 3-D latest mechanical activation, not possible by 2D was quantified. As expected, dyssynchrony in CRT patients was significantly greater than normal controls (maximal opposing wall delay 316±112* ms vs. 59±12 ms and standard deviation 124±48* ms vs. 28±11 ms, *p<0.001 vs. normal). 3-D opposing wall delay was closely correlated with 3-D 16-segment standard deviation (r = 0.95), and 2-D mid-LV strain: r=0.83 and r=0.85 for standard deviation (all p<0.001). The 3-D site of the latest mechanical activation was most commonly mid-posterior (26%), basal-posterior (22%), mid-lateral (20%), and basal-lateral (17%). Eleven patients studied after CRT demonstrated improvements in 3D synchrony (300±124 ms to 94±37 ms*) and EF (24 ± 6% to 31 ± 7%*), *p<0.05. In conclusion, 3-D speckle tracking can successfully quantify 3-D dyssynchrony and site the latest mechanical activation. This approach may play a clinical role in management of CRT patients.
Keywords: echocardiography, heart failure, pacemakers
Cardiac resynchronization therapy (CRT) has had a major impact on improving symptoms and survival in heart failure (HF) patients. A large body of data has demonstrated that abnormalities of left ventricular (LV) mechanical timing, known as dyssynchrony, impairs ejection efficiency and is improved with CRT. 1–3 Existing echocardiographic methods to quantify dyssynchrony, such as tissue Doppler, have been shown to have technical limitations which preclude their routine use for patient selection for CRT.4–7. Accordingly, there is a desire for technological improvements in means to quantify LV dyssynchrony. Speckle tracking echocardiography has emerged as a promising method to assess mechanical dyssynchrony because it may measure strain as active wall thickening, unlike M-mode or tissue Doppler velocity which cannot differentiate from passive movement.8–10 However, speckle tracking has been limited to 2-dimensional (2-D) tomographic imaging planes, which may oversimplify the complexities of LV dyssynchrony in individual patients 9. A newly developed 3-dimensional (3-D) speckle tracking system can quantify LV strain using complete 3-D pyramidal data sets. The objective of the present study was to test the hypothesis that this novel echocardiography system can qualify 3-D dyssynchrony, map the 3-D site of latest activation, which is not possible by 2-D, and determine improvements in 3-D synchrony following CRT.
Methods
The study group consisted of 67 subjects; 57 HF patients referred for CRT and 10 normal control volunteers. This protocol was approved by the Institutional Review Board on Biomedical Research and all subjects gave informed consent consistent with this protocol. The study group consisted of 54 HF patients after 3 (5%) were excluded from analysis because of poor echocardiographic windows. All patients were HF functional class III, with EF ≤ 35% and ≥120 ms. Details of patient demographic data appear in Table 1. Twenty-seven patients (50%) had ischemic cardiomyopathy; none had atrial fibrillation. The normal control group consisted of 10 volunteers aged 35±5 years with no history of cardiovascular disease and completely normal ECGs and 2-D and Doppler echocardiograms (QRS duration 88±6ms and EF 61±4 %).
Table 1.
Patient Characteristics
| Baseline Variable | Heart Failure Patients |
|---|---|
| (n = 54) | |
| Age (years) | 68 ± 11 |
| Male/female | 32/13 |
| QRS duration (ms) | 165 ± 29 |
| Coronary disease (%) | 27 (50) |
| Ejection fraction (%) | 25 ± 6 |
| Radial dyssynchrony by 2-D speckle tracking (ms) | 230 ± 101 |
| Radial dyssynchrony by 3-D speckle tracking (ms) Maximal opposing wall delay) |
316 ± 112 |
| Radial dyssynchrony by 3-D speckle tracking (ms) (Standard deviation) |
124 ± 48 |
2-D = 2-dimensional, 3-D = 3-dimensional
All echocardiographic studies were performed with a commercially available echocardiography system (Aplio Artida, Toshiba Medical Systems Corporation, Tokyo, Japan). Digital routine grayscale 2-D cine loops from 3 consecutive beats were obtained at end-expiratory apnea using a matrix array transducer (PST-25SX) from standard apical and mid-LV short-axis views at depths of 11 to 20 cm (mean 16±2 cm). Frame rates were 44 to 90 Hz (mean 61±14 Hz) for grayscale imaging used for speckle tracking. Sector width was optimized to allow for complete myocardial visualization while maximizing frame rate. Gain settings were adjusted for routine grayscale imaging to optimize endocardial definition. The LV volumes and EF were assessed by biplane Simpson rule using manual tracing of digital images 11.
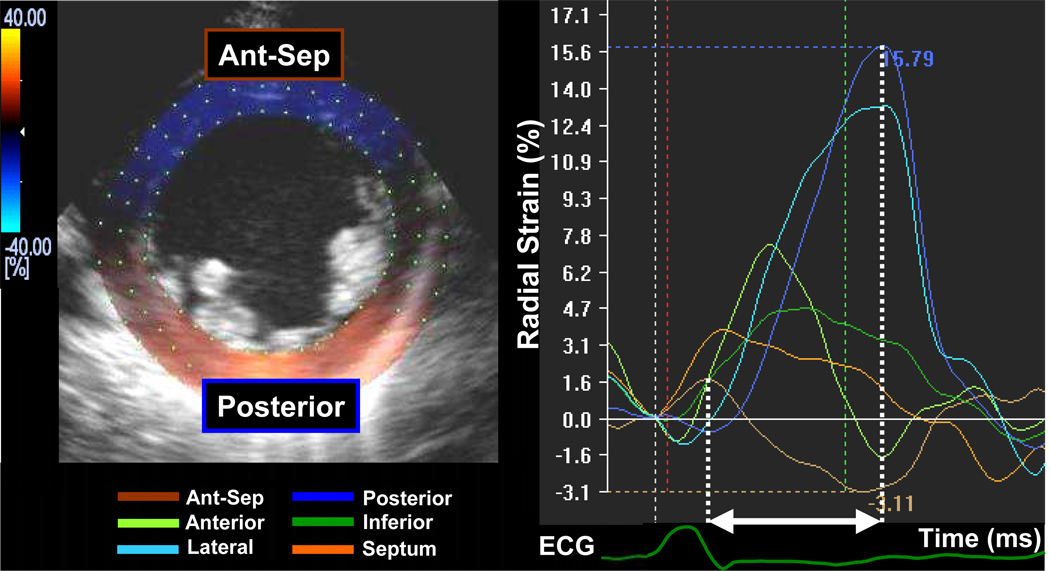
Routine B-mode gray scales images were analyzed for frame-by-frame movement of stable patterns of natural acoustic markers, or speckles, present in ultrasound tissue images over the cardiac cycle, as described previously in detail.10,12 Briefly, the mid-LV short axis plane was used (Figure 1). A circular region of interest was traced counterclockwise on the endocardium starting from the 9 o’clock position at end-systole (minimum cavity area) using a point-and-click approach. A second larger concentric circle was then automatically generated and manually adjusted near the epicardium. The software automatically divided the short axis image into 6 segments and generated corresponding time-strain curves from each segment. The region of interest was fine-tuned by visual assessment during the cineloop play feature to ensure that all segments were tracked throughout the cardiac cycle. Often, the regions of interest were placed slightly wider than the LV wall to obtain the highest quality time-strain curves. 2-D speckle tracking radial dyssynchrony was defined as a time difference between the anteroseptal and posterior wall segmental peak strain.
Figure 1.
An example of a 2-dimensional mid-ventricular short axis image demonstrating radial time-strain curves in a heart failure patient with left bundle-branch block. Dyssynchrony is shown as a time difference (arrow) between time to peak strain in the anterior septum (brown curve) and posterior wall peak strain (blue curve).
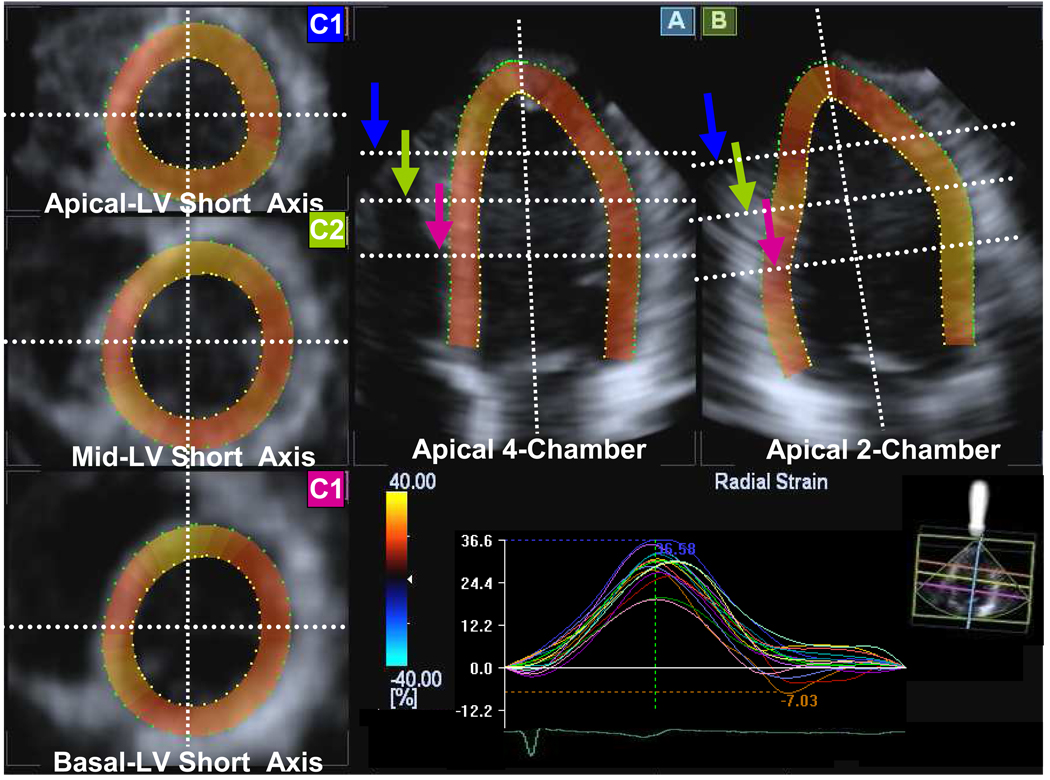
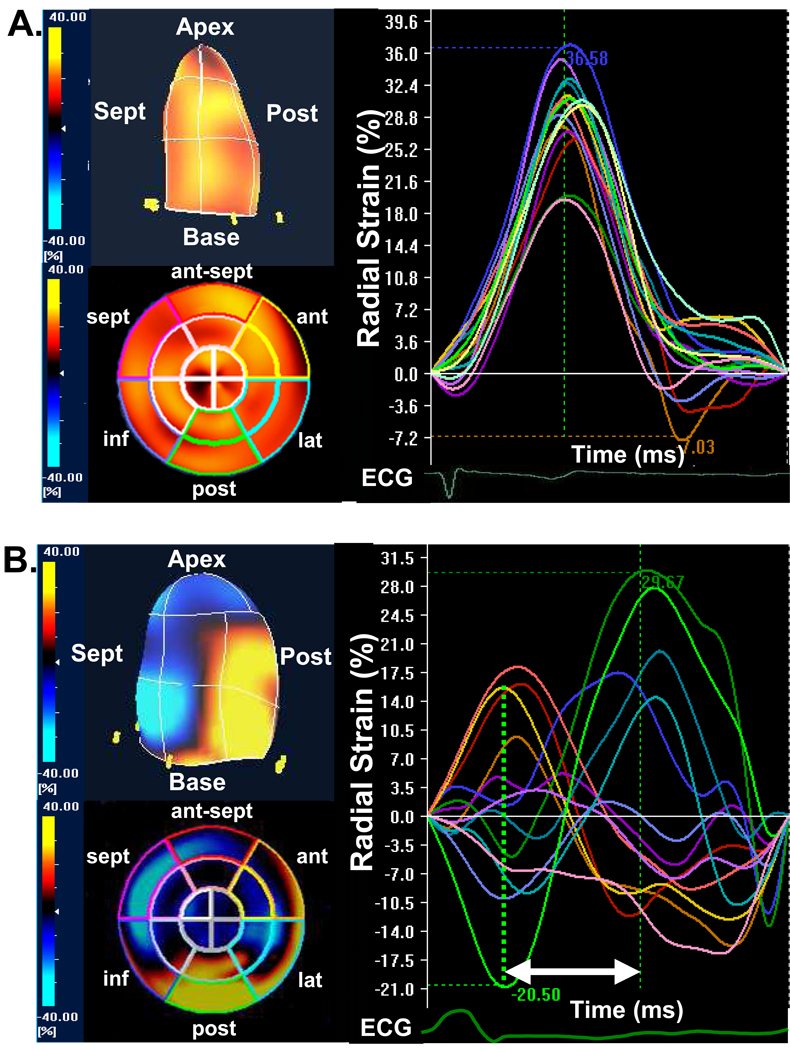
3-D speckle tracking system used a pyramidal volume from the matrix array transducer. Acquisition of a full-volume data set required 4 smaller wedge-shaped subvolumes from 4 consecutive cardiac cycles during a breath hold, that were combined to provide the larger pyramidal volume. Data were acquired from the apical window at depths of 15 to 18 cm during breath hold and a relatively stable R-R interval to minimize translation artifacts between the 4 acquired subvolumes. Gain settings were adjusted to optimize endocardial and epicardial definition. The wide sector width (mean 88±5 × 88±5 degrees) was used to include the entire LV volume. 3-D data sets were displayed in 5 different cross sections that could be modified interactively (Figure 2). Tomographic planes were as follows: apical 4-chamber view displayed in the upper middle panel (A), apical 2-chamber view displayed in the upper right panel (B) and the 3 standard short-axis views displayed in the left panel (C1 apical-level, C2 mid-level, C3 basal-level). Using this convention, the maximal long-axis dimensions were adjusted to get the true apex. First, the orientation of the long-axis of the 4- and 2-chamber views was determined by positioning the main axis line to pass near the center of the LV cavity. Then, the 3 standard short-axis planes were defined by positioning the lines in both apical views at each level perpendicular to the long axis of the LV. A region of interest was traced counterclockwise direction on the endocardium starting from the right hand mitral annulus at end-diastole (maximum cavity area) in both apical views using a point-and-click approach with special care taken to adjust tracking of all endocardial segments. A second larger region of interest was then automatically generated and manually adjusted near the epicardium in both apical views. The software automatically divided the LV into 16 standard segments based on the recommendation of the American Society of Echocardiography 11,13 and generated corresponding time-strain curves from each segment (Figure 3). The region of interest was fine-tuned by visual assessment during the cineloop play feature to ensure that all wall regions were included throughout the cardiac cycle. 3-D speckle tracking radial dyssynchrony was quantified from mechanical activation mapped from all 16 sites as maximal opposing wall delay in time-to-peak strain and standard deviation of time-to-peak strain. 3-D movies of regional strain were generated with color-coding of strain. Thickening or positive radial strain was color-coded as orange-yellow, and thinning or negative radial strain was color coded as blue. 3-D LV displays and polar maps or bull’s eye plots were generated.
Figure 2.
Example of images generated from a pyramidal 3-dimensional data set: apical 4-chamber (A), 2-chamber (B), apical left ventricular (LV) short-axis (C1, blue arrow), mid LV short-axis (C2, green arrow), and basal LV short-axis (C3, purple arrow) views with 16 segmental time-strain curves from a normal subject.
Figure 3.
(A) The color-coded 3-dimentional (3-D) left ventricular display (top left) and bull’s eye plot image (bottom left) and corresponding time-to-strain curves from 16 left ventricular sites (right panel) from a normal control, demonstrating synchronous tome-to-peak strain curves represented by homogeneous coloring at end-systole. (B) The color-coded 3-D left ventricular display (top left) and bull’s eye plot image (bottom left) and corresponding time-to-strain curves from 16 left ventricular sites (right panel) from a heart failure patient with left bundle-branch block, demonstrating dyssynchronous tome-to-peak strain curves represented by heterogeneous coloring at end-systole, with early peak strain in septal segments and delayed peak strain in posterior lateral segments (arrow). ant = anterior, ant-sept = anterior-septum, ECG = electrocardiogram, inf = inferior, lat = lateral, post = posterior, sept = septal.
All group data was presented as mean ± SD and was compared with the 2-tailed Student t-test for paired and unpaired data, respectively. Correlation analysis was performed using linear regression and expressed as a Pearson correlation coefficient. Statistical significance was p<0.05.
Results
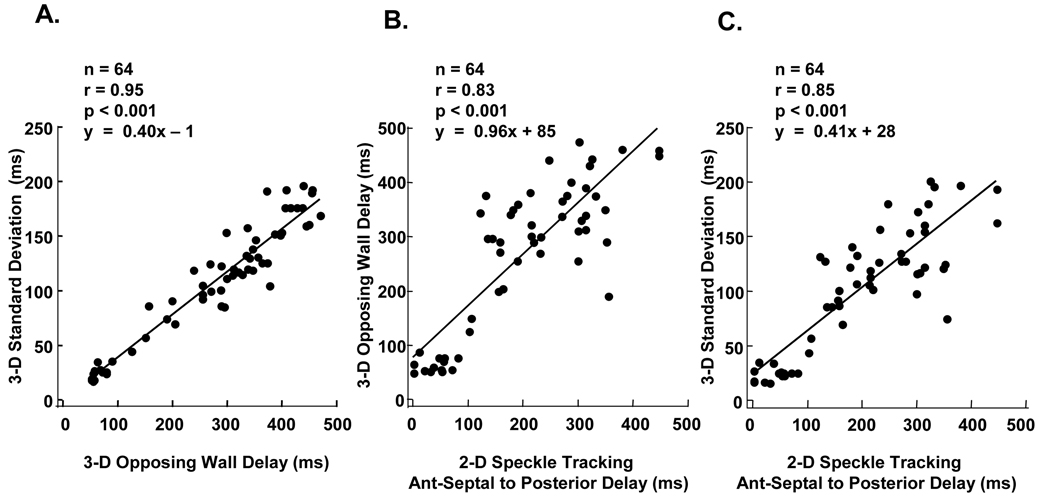
Overall, 3-D speckle tracking radial dyssynchrony analysis was possible in 963 of 1024 attempted segments (94%) from the 64 subjects with overall technically adequate images. The total time for 3-D speckle tracking dyssynchrony analysis was approximately 4 to 7 minutes per patient. As expected, 3-D speckle tracking dyssynchrony in HF patients was significantly greater than that in normal controls (maximal opposing wall delay 316±112* ms vs. 59±12 ms and standard deviation 124±48* ms vs. 28±11 ms, *p<0.001 vs. normal controls). 3-D opposing wall delay was closely correlated with 3-D 16-segment standard deviation (r = 0.95, p<0.001) (Figure 4A). Mid-LV 2-D dyssynchrony was also significantly correlated 3-D derived speckle tracking radial dyssynchrony indices; anteroseptal to posterior wall delay by 2-D speckle tracking radial strain vs. maximal opposing wall delay by 3-D speckle tracking radial strain (r=0.83, p<0.001) (Figure 4B), and anteroseptal to posterior wall delay by 2-D speckle tracking radial strain vs. standard deviation by 3-D speckle tracking radial strain (r=0.85, p<0.001) (Figure 4B). The inter-and intra-observer variabilities of 3-D speckle tracking radial dyssynchrony were 9 ± 8% and 9 ± 7%.
Figure 4.
(A) Dot plots of 3-dimensional (3-D) speckle tracking measures of maximum opposing wall delay to 3D 16-segment standard deviation in 64 subjects demonstrating a linear relationship. (B) Dot plots of 2-dimensional (2-D) speckle tracking dyssynchrony by anteroseptal (Ant-Septal) to posterior wall delay versus 3-D speckle tracking measures of maximum opposing wall delay and (C) 16-segment standard deviation demonstrating overall significant correlations.
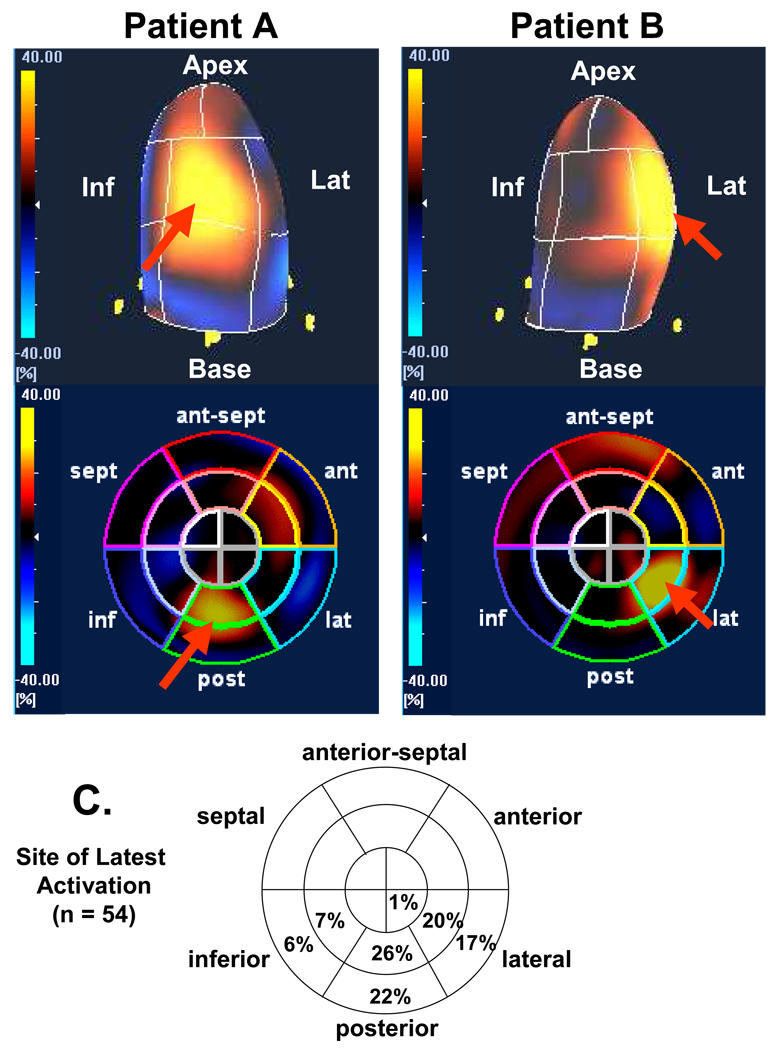
Using time-to peak maximal radial strain, the prevalence of the site of the latest mechanical activation from all 16 sites in all 54 patients was as follows: mid-posterior in 14 (26%), basal-posterior in 12 (22%), mid-lateral in 11 (20%), basal-lateral in 9 (17%), mid-inferior in 4 (7%), basal-inferior in 3 (6%) and apical-lateral in 1 (2%) (Figure 5). Overall, 85% of the site of the latest mechanical activation was located in posterior or lateral regions at the mid or basal levels. In the sample of patients studied, the site of latest mechanical activation did not occur in the septum, was rare at the apical level, and uncommon in the inferior wall. The 3-D speckle tracking system was able to characterize the individual patients with a broad site of latest mechanical activation, from those with a narrow site.
Figure 5.
Examples of color-coded 3-dimensional left ventricular displays (top panels) and bull’s eye plots (bottom panels) from 2 different patients undergoing resynchronization therapy. Patient A on the left has site of latest mechanical activation in the mid-posterior segment (red arrow), and the Patient B on the right has site of latest mechanical activation in the mid-lateral segment (red arrow). Panel C demonstrates prevalence of site of latest mechanical activation from 54 patients using bull’s-eye polar maps.
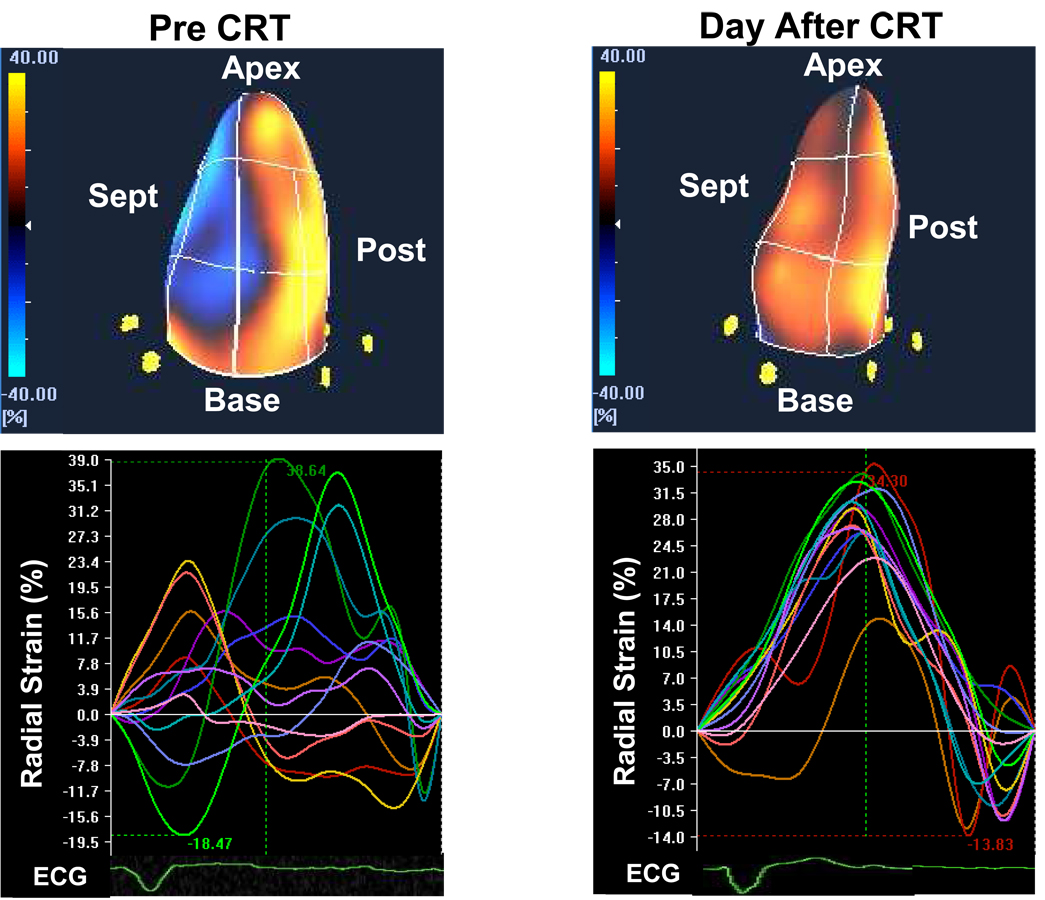
A subset of 11 patients had repeat 3-D speckle tracking studies the day after CRT (Figure 6). Significant improvements in 3-D dyssynchrony were observed: maximal opposing wall delay decreased from 300±124 to 94±37 ms* and standard deviation decreased from 119±56 ms to 49±10 ms* (*p < 0.001 vs. baseline). EF also improved from 24±6 to 31±7%* (*p < 0.05).
Figure 6.
Examples of color-coded 3-dimensional left ventricular displays (top panels) and time strain curves (bottom panels) in the same patient before (left) and the day after (right) cardiac resynchronization therapy (CRT), demonstrating acute improvement in left ventricular synchrony. ECG = electrocardiogram, post = posterior, sept = septal.
Discussion
This is the first study to use a novel 3-D speckle tracking echocardiography system to quantify LV dyssynchrony and site of latest mechanical activation. 3-D speckle tracking radial strain was feasible in the large majoring of consecutive patients studied. It quantified dyssynchrony in CRT patients to be significantly greater than that in normal controls, as expected. There was a close correlation between the 2-D and 3-D derived speckle tracking radial dyssynchrony indices. In addition, the 3-D site of the latest LV active mechanical activation was successfully quantified in a manner not possible previously using 2-D methods, nor by previous 3-D methods that focused on passive endocardial motion alone. 14
This study focused on radial thickening by speckle tracking strain to assess LV dyssynchrony. The largest body of publications on LV dyssynchrony and predicting of response to CRT is represented by LV longitudinal shortening velocities using tissue Doppler imaging from the apical views. 5,7,15–17 Other dyssynchrony investigations in clued radial thickening by M-mode scanning 6,18, tissue Doppler radial strain 19 and 2-D speckle tracking radial strain. 9,10 The more recent approach is speckle tracking echocardiography that may be applied to routine grayscale images and is not limited by Doppler angle of incidence. 8–10 Therefore, speckle tracking radial strain analysis may permit an accurate quantification of regional wall thickening. According to our previous work with radial strain by 2-D speckle tracking 10, baseline 2-D speckle tracking radial dyssynchrony, defined as a time difference in peak septal to posterior wall strain ≥ 130 ms, predicted chronic EF response to CRT (8 ± 5 months after CRT) with 89% sensitivity and 83%. Furthermore, some investigators have demonstrated radial thickening is a major vector of LV contraction, and short-axis dynamics are important markers of dyssynchrony 20,21. Magnetic resonance imaging and 3-D echocardiography studies have demonstrated that radial myocardial dynamics may characterize LV dyssynchrony in a more sensitive manner than longitudinal dyssynchrony 22,23. Other investigators have advocated the used of speckle tracking radial strain to be a robust means to assess dyssynchrony 8. Moreover, a combined approach of using both tissue Doppler longitudinal velocity information and speckle tracking radial strain appears to be additive in value for predicting EF response to CRT 9. Although these 2-D echocardiographic approaches can be useful, they are restricted to the measurement of dyssynchrony in a single plane, while dyssynchrony will be overlooked. In addition, each segment must be evaluated sequentially and, thus, is subject to beat-to-beat variability. Previous work has demonstrated that longitudinal and radial patterns of dyssynchrony may be complex in individual patients, which suggested that a 3-D assessment would be advantageous. 9
Important studies have previously been performed with real-time 3-D echocardiography to provide a simultaneous evaluation of LV dyssynchrony as a volumetric change in endocardial movement and regional blood displacement 14,24,25. Kapetanakis et al 14 calculated a novel systolic dyssynchrony index from the dispersion of time to minimum regional volume using a 16 LV segment model and found this to be predictive of reverse remodeling after CRT in 26 patients. This study provided important new information to quantify dyssynchrony, but focused on segmental volume displacement which was an indirect marker of LV wall motion, which could not differentiate active wall thickening from passive wall motion. Another limitation was the inclusion of apical segments that have a low amplitude of regional blood displacement. This present study extends this work by utilizing a 3-D speckle tracking system to assess myocardial active wall thickening, which has a theoretical advantage to map mechanical activation.
Previous investigators have inferred that LV lead position impacts patient response to CRT 10,26–29. Ansalone et al demonstrated that LV lead placement at the most delayed segment resulted in the greatest immediate improvements from CRT. 26 Our study is in agreement with their observations that the LV segment with the greatest delay in activation was most commonly the posterior or lateral wall. We have previously found the patients who had LV lead tip position concordant with the site of the latest mechanical activation by 2-D speckle tracking radial strain had a greater degree of EF increase after CRT than the patients with discordant LV lead positioning. 10. Murphy et al also demonstrated that CRT patients whose LV lead was concordant with the site of latest activation by color-coded tissue Doppler had greater improvements in LV function and reverse remodeling, than those with discordant positioning. 30 Ypenburg et al recently demonstrated the site of latest mechanical activation was most frequently located in the posterior (36%) and lateral segments (33%) using 2-D speckle tracking radial strain in 244 CRT candidates29. Moreover, they revealed a match between LV lead position and the site of latest mechanical activation resulted in a better echocardiographic response 6-month after CRT, with a superior long-term outcome after CRT. These studies combine to support imaging guided LV lead positioning as being a potential advance for CRT. This present study utilized 3-D speckle tracing radial strain to provide a more compete 3-D mechanical activation map than previous techniques. Moreover, the color-coded 3-D cine loop map to facilitate a rapid visual assessment of the site of the latest mechanical activation from all 16 LV sites. Our results may have important clinical implications for the decision of transvenous or surgical epicardial LV lead positioning.
An acknowledged limitation is that no long term follow-up data on EF or clinical response was included in this initial study. However, we were able to demonstrate the feasibility of determining resynchronization in a small sample of patients after CRT. The PROSPECT study revealed the possibility for high variability in echo dyssynchrony measures, and failed to show conclusively that a single dyssynchrony measure can be strongly predictive of CRT response. (4) Although problems with technical acquisition, confounding variables of different core labs, different vendors echo systems and off-line software approaches interfered with precise interpretation of the PROSPECT results, the new 3D approach in the present study provides hope for improvement. Since this technology was recently developed, future studies will be needed to test the long-term predictive value of 3-D dyssynchrony assessment or guiding LV lead positioning. In addition, speckle tracking echocardiography requires technically adequate image quality to perform well. This study demonstrated a high yield in consecutively attempted echocardiograms, supporting that 3-D speckle tracking has promise as a robust means to quantify LV mechanics non-invasively. Furthermore, 3-D speckle tracking analysis is required at least relatively stable 4 R-R intervals to minimize translation artifacts during breath hold. Therefore it would be difficult to apply for patients with irregular heart rhythm including atrial fibrillation or frequent premature ventricular contraction. Other technical limitations of 2-D and 3-D speckle tracking methods include endocardial border tracing, where care must be taken to manually fine-tune the region of interest to capture the early anterior septal motion in left bundle-branch block and adjust its width for dyssynchrony analysis before generating and measuring regional strain. Speckle tracking echocardiography also requires experience to achieve reproducible results, and requires a training period similar to tissue Doppler dyssynchrony analysis. A limitation of the image acquisition for 3-D speckle tracking in this present study was a relatively slow volume rate of 25–30 volumes/s. However, these frame rates were adequate to produce high quality data that has promise to be clinically meaningful. Further technical advances in computer technology is anticipated for the near future, which will likely result in further improvements in temporal and spatial resolution. Although mechanical dyssynchrony has been associated with response to CRT, there are some limitations regarding to the echocardiographic parameters to predict response to CRT.
Supplementary Material
Acknowledgements
The authors are grateful for the support of the entire staff of the echocardiography and electrophysiology laboratories of the University of Pittsburgh Presbyterian University Hospital.
Footnotes
Publisher's Disclaimer: This is a PDF file of an unedited manuscript that has been accepted for publication. As a service to our customers we are providing this early version of the manuscript. The manuscript will undergo copyediting, typesetting, and review of the resulting proof before it is published in its final citable form. Please note that during the production process errors may be discovered which could affect the content, and all legal disclaimers that apply to the journal pertain.
References
- 1.Abraham WT, Fisher WG, Smith AL, Delurgio DB, Leon AR, Loh E, Kocovic DZ, Packer M, Clavell AL, Hayes DL, Ellestad M, Trupp RJ, Underwood J, Pickering F, Truex C, McAtee P, Messenger J. Cardiac resynchronization in chronic heart failure. N Engl J Med. 2002;346:1845–1853. doi: 10.1056/NEJMoa013168. [DOI] [PubMed] [Google Scholar]
- 2.Bristow MR, Saxon LA, Boehmer J, Krueger S, Kass DA, De Marco T, Carson P, DiCarlo L, DeMets D, White BG, DeVries DW, Feldman AM. Cardiac-resynchronization therapy with or without an implantable defibrillator in advanced chronic heart failure. N Engl J Med. 2004;350:2140–2150. doi: 10.1056/NEJMoa032423. [DOI] [PubMed] [Google Scholar]
- 3.Cleland JG, Daubert JC, Erdmann E, Freemantle N, Gras D, Kappenberger L, Tavazzi L. The effect of cardiac resynchronization on morbidity and mortality in heart failure. N Engl J Med. 2005;352:1539–1549. doi: 10.1056/NEJMoa050496. [DOI] [PubMed] [Google Scholar]
- 4.Chung ES, Leon AR, Tavazzi L, Sun JP, Nihoyannopoulos P, Merlino J, Abraham WT, Ghio S, Leclercq C, Bax JJ, Yu CM, Gorcsan J, 3rd, St John Sutton M, De Sutter J, Murillo J. Results of the Predictors of Response to CRT (PROSPECT) trial. Circulation. 2008;117:2608–2616. doi: 10.1161/CIRCULATIONAHA.107.743120. [DOI] [PubMed] [Google Scholar]
- 5.Bax JJ, Bleeker GB, Marwick TH, Molhoek SG, Boersma E, Steendijk P, van der Wall EE, Schalij MJ. Left ventricular dyssynchrony predicts response and prognosis after cardiac resynchronization therapy. J Am Coll Cardiol. 2004;44:1834–1840. doi: 10.1016/j.jacc.2004.08.016. [DOI] [PubMed] [Google Scholar]
- 6.Pitzalis MV, Iacoviello M, Romito R, Massari F, Rizzon B, Luzzi G, Guida P, Andriani A, Mastropasqua F, Rizzon P. Cardiac resynchronization therapy tailored by echocardiographic evaluation of ventricular asynchrony. J Am Coll Cardiol. 2002;40:1615–1622. doi: 10.1016/s0735-1097(02)02337-9. [DOI] [PubMed] [Google Scholar]
- 7.Yu CM, Chau E, Sanderson JE, Fan K, Tang MO, Fung WH, Lin H, Kong SL, Lam YM, Hill MR, Lau CP. Tissue Doppler echocardiographic evidence of reverse remodeling and improved synchronicity by simultaneously delaying regional contraction after biventricular pacing therapy in heart failure. Circulation. 2002;105:438–445. doi: 10.1161/hc0402.102623. [DOI] [PubMed] [Google Scholar]
- 8.Delgado V, Ypenburg C, van Bommel RJ, Tops LF, Mollema SA, Marsan NA, Bleeker GB, Schalij MJ, Bax JJ. Assessment of left ventricular dyssynchrony by speckle tracking strain imaging comparison between longitudinal, circumferential, and radial strain in cardiac resynchronization therapy. J Am Coll Cardiol. 2008;51:1944–1952. doi: 10.1016/j.jacc.2008.02.040. [DOI] [PubMed] [Google Scholar]
- 9.Gorcsan J, 3rd, Tanabe M, Bleeker GB, Suffoletto MS, Thomas NC, Saba S, Tops LF, Schalij MJ, Bax JJ. Combined longitudinal and radial dyssynchrony predicts ventricular response after resynchronization therapy. J Am Coll Cardiol. 2007;50:1476–1483. doi: 10.1016/j.jacc.2007.06.043. [DOI] [PubMed] [Google Scholar]
- 10.Suffoletto MS, Dohi K, Cannesson M, Saba S, Gorcsan J., 3rd Novel speckle-tracking radial strain from routine black-and-white echocardiographic images to quantify dyssynchrony and predict response to cardiac resynchronization therapy. Circulation. 2006;113:960–968. doi: 10.1161/CIRCULATIONAHA.105.571455. [DOI] [PubMed] [Google Scholar]
- 11.Lang RM, Bierig M, Devereux RB, Flachskampf FA, Foster E, Pellikka PA, Picard MH, Roman MJ, Seward J, Shanewise JS, Solomon SD, Spencer KT, Sutton MS, Stewart WJ. Recommendations for chamber quantification: a report from the American Society of Echocardiography's Guidelines and Standards Committee and the Chamber Quantification Writing Group, developed in conjunction with the European Association of Echocardiography, a branch of the European Society of Cardiology. J Am Soc Echocardiogr. 2005;18:1440–1463. doi: 10.1016/j.echo.2005.10.005. [DOI] [PubMed] [Google Scholar]
- 12.Tanabe M, Lamia B, Tanaka H, Schwartzman D, Pinsky MR, Gorcsan J., 3rd Echocardiographic speckle tracking radial strain imaging to assess ventricular dyssynchrony in a pacing model of resynchronization therapy. J Am Soc Echocardiogr. 2008;21:1382–1388. doi: 10.1016/j.echo.2008.09.012. [DOI] [PMC free article] [PubMed] [Google Scholar]
- 13.Schiller NB, Shah PM, Crawford M, DeMaria A, Devereux R, Feigenbaum H, Gutgesell H, Reichek N, Sahn D, Schnittger I, et al. Recommendations for quantitation of the left ventricle by two-dimensional echocardiography. American Society of Echocardiography Committee on Standards, Subcommittee on Quantitation of Two-Dimensional Echocardiograms. J Am Soc Echocardiogr. 1989;2:358–367. doi: 10.1016/s0894-7317(89)80014-8. [DOI] [PubMed] [Google Scholar]
- 14.Kapetanakis S, Kearney MT, Siva A, Gall N, Cooklin M, Monaghan MJ. Real-time three-dimensional echocardiography: a novel technique to quantify global left ventricular mechanical dyssynchrony. Circulation. 2005;112:992–1000. doi: 10.1161/CIRCULATIONAHA.104.474445. [DOI] [PubMed] [Google Scholar]
- 15.Gorcsan J, 3rd, Kanzaki H, Bazaz R, Dohi K, Schwartzman D. Usefulness of echocardiographic tissue synchronization imaging to predict acute response to cardiac resynchronization therapy. Am J Cardiol. 2004;93:1178–1181. doi: 10.1016/j.amjcard.2004.01.054. [DOI] [PubMed] [Google Scholar]
- 16.Notabartolo D, Merlino JD, Smith AL, DeLurgio DB, Vera FV, Easley KA, Martin RP, Leon AR. Usefulness of the peak velocity difference by tissue Doppler imaging technique as an effective predictor of response to cardiac resynchronization therapy. Am J Cardiol. 2004;94:817–820. doi: 10.1016/j.amjcard.2004.05.072. [DOI] [PubMed] [Google Scholar]
- 17.Sogaard P, Egeblad H, Kim WY, Jensen HK, Pedersen AK, Kristensen BO, Mortensen PT. Tissue Doppler imaging predicts improved systolic performance and reversed left ventricular remodeling during long-term cardiac resynchronization therapy. J Am Coll Cardiol. 2002;40:723–730. doi: 10.1016/s0735-1097(02)02010-7. [DOI] [PubMed] [Google Scholar]
- 18.Pitzalis MV, Iacoviello M, Romito R, Guida P, De Tommasi E, Luzzi G, Anaclerio M, Forleo C, Rizzon P. Ventricular asynchrony predicts a better outcome in patients with chronic heart failure receiving cardiac resynchronization therapy. J Am Coll Cardiol. 2005;45:65–69. doi: 10.1016/j.jacc.2004.09.058. [DOI] [PubMed] [Google Scholar]
- 19.Dohi K, Suffoletto MS, Schwartzman D, Ganz L, Pinsky MR, Gorcsan J., 3rd Utility of echocardiographic radial strain imaging to quantify left ventricular dyssynchrony and predict acute response to cardiac resynchronization therapy. Am J Cardiol. 2005;96:112–116. doi: 10.1016/j.amjcard.2005.03.032. [DOI] [PubMed] [Google Scholar]
- 20.Grines CL, Bashore TM, Boudoulas H, Olson S, Shafer P, Wooley CF. Functional abnormalities in isolated left bundle branch block. The effect of interventricular asynchrony. Circulation. 1989;79:845–853. doi: 10.1161/01.cir.79.4.845. [DOI] [PubMed] [Google Scholar]
- 21.Sade LE, Kanzaki H, Severyn D, Dohi K, Gorcsan J., 3rd Quantification of radial mechanical dyssynchrony in patients with left bundle branch block and idiopathic dilated cardiomyopathy without conduction delay by tissue displacement imaging. Am J Cardiol. 2004;94:514–518. doi: 10.1016/j.amjcard.2004.04.071. [DOI] [PubMed] [Google Scholar]
- 22.Helm RH, Leclercq C, Faris OP, Ozturk C, McVeigh E, Lardo AC, Kass DA. Cardiac dyssynchrony analysis using circumferential versus longitudinal strain: implications for assessing cardiac resynchronization. Circulation. 2005;111:2760–2767. doi: 10.1161/CIRCULATIONAHA.104.508457. [DOI] [PMC free article] [PubMed] [Google Scholar]
- 23.D'Hooge J, Heimdal A, Jamal F, Kukulski T, Bijnens B, Rademakers F, Hatle L, Suetens P, Sutherland GR. Regional strain and strain rate measurements by cardiac ultrasound: principles, implementation and limitations. Eur J Echocardiogr. 2000;1:154–170. doi: 10.1053/euje.2000.0031. [DOI] [PubMed] [Google Scholar]
- 24.van Dijk J, Knaapen P, Russel IK, Hendriks T, Allaart CP, de Cock CC, Kamp O. Mechanical dyssynchrony by 3D echo correlates with acute haemodynamic response to biventricular pacing in heart failure patients. Europace. 2008;10:63–68. doi: 10.1093/europace/eum262. [DOI] [PubMed] [Google Scholar]
- 25.Takeuchi M, Jacobs A, Sugeng L, Nishikage T, Nakai H, Weinert L, Salgo IS, Lang RM. Assessment of left ventricular dyssynchrony with real-time 3-dimensional echocardiography: comparison with Doppler tissue imaging. J Am Soc Echocardiogr. 2007;20:1321–1329. doi: 10.1016/j.echo.2007.05.001. [DOI] [PubMed] [Google Scholar]
- 26.Ansalone G, Giannantoni P, Ricci R, Trambaiolo P, Fedele F, Santini M. Doppler myocardial imaging to evaluate the effectiveness of pacing sites in patients receiving biventricular pacing. J Am Coll Cardiol. 2002;39:489–499. doi: 10.1016/s0735-1097(01)01772-7. [DOI] [PubMed] [Google Scholar]
- 27.Butter C, Auricchio A, Stellbrink C, Fleck E, Ding J, Yu Y, Huvelle E, Spinelli J. Effect of resynchronization therapy stimulation site on the systolic function of heart failure patients. Circulation. 2001;104:3026–3029. doi: 10.1161/hc5001.102229. [DOI] [PubMed] [Google Scholar]
- 28.Saxon LA, Olshansky B, Volosin K, Steinberg JS, Lee BK, Tomassoni G, Guarnieri T, Rao A, Yong P, Galle E, Leigh J, Ecklund F, Bristow MR. Influence of Left Ventricular Lead Location on Outcomes in the COMPANION Study. J Cardiovasc Electrophysiol. 2009 doi: 10.1111/j.1540-8167.2009.01444.x. [DOI] [PubMed] [Google Scholar]
- 29.Ypenburg C, van Bommel RJ, Delgado V, Mollema SA, Bleeker GB, Boersma E, Schalij MJ, Bax JJ. Optimal left ventricular lead position predicts reverse remodeling and survival after cardiac resynchronization therapy. J Am Coll Cardiol. 2008;52:1402–1409. doi: 10.1016/j.jacc.2008.06.046. [DOI] [PubMed] [Google Scholar]
- 30.Murphy RT, Sigurdsson G, Mulamalla S, Agler D, Popovic ZB, Starling RC, Wilkoff BL, Thomas JD, Grimm RA. Tissue synchronization imaging and optimal left ventricular pacing site in cardiac resynchronization therapy. Am J Cardiol. 2006;97:1615–1621. doi: 10.1016/j.amjcard.2005.12.054. [DOI] [PubMed] [Google Scholar]
Associated Data
This section collects any data citations, data availability statements, or supplementary materials included in this article.


