

Abstract
Background
Although 70% (or 2/3) partial hepatectomy (PH) is the most studied model for liver regeneration, the hepatic protein expression profile associated with lower volume liver resection (such as 50% PH) has not yet been reported. Therefore, the aim of this study was to determine the global protein expression profile of the regenerating mouse liver following 50% PH by differential proteomics, and thereby gaining some insights into the hepatic regeneration mechanism(s) under this milder but clinically more relevant condition.
Results
Proteins from sham-operated mouse livers and livers regenerating for 24 h after 50% PH were separated by SDS-PAGE and analyzed by nanoUPLC-Q-Tof mass spectrometry. Compared to sham-operated group, there were totally 87 differentially expressed proteins (with 50 up-regulated and 37 down-regulated ones) identified in the regenerating mouse livers, most of which have not been previously related to liver regeneration. Remarkably, over 25 differentially expressed proteins were located at mitochondria. Several of the mitochondria-resident proteins which play important roles in citric acid cycle, oxidative phosphorylation and ATP production were found to be down-regulated, consistent with the recently-proposed model in which the reduction of ATP content in the remnant liver gives rise to early stress signals that contribute to the onset of liver regeneration. Pathway analysis revealed a central role of c-Myc in the regulation of liver regeneration.
Conclusions
Our study provides novel evidence for mitochondria as a pivotal organelle that is connected to liver regeneration, and lays the foundation for further studies on key factors and pathways involved in liver regeneration following 50% PH, a condition frequently used for partial liver transplantation and conservative liver resection.
Background
Among all organs, the liver is unique in its ability to repair itself after suffering loss of tissue mass from surgical resection or pathogenic and toxic factors [1]. This is mainly attributable to the quick re-entry of highly differentiated quiescent hepatocytes into the cell cycle in response to liver injury [2]. If the liver incurs lethal damage resulting from the resection of 65-70% of the liver, hepatocytes will immediately begin to grow to compensate for the lost cells. The remaining liver will keep regenerating until the original liver mass is restored about 2 weeks later. The liver stops growing when the liver mass reaches within 10% (±) of the original liver mass. Regeneration of liver tissue has a threshold of 30% partial hepatectomy (PH), below which, liver regeneration slows down [2], whereas an 80% PH leads to liver regeneration failure and a high mortality rate [3,4]. Liver regeneration can be observed in living human liver transplantation and split-liver transplantation (SLT) [5] which revealed that the donor's liver size doubled after 7 days, and the recipient's doubled between days 7-14 after surgery and is restored to the original size 60 days later.
Although 70% (or 2/3) PH is the most studied model of liver regeneration [1,6], resection of approximately half volume of the donor liver is more often with partial liver transplantation [7]. Moreover, resection must be more conservative in the presence of underlying liver diseases or in elderly patients (e.g., ≥70 years of age) [7]. Major (>50%) hepatectomy in the presence of cirrhosis or steatosis significantly increased morbidity [8]. With the presence of liver steatosis, 30% or more of the remnant liver should remain in order to maintain viability. Furthermore, studies have revealed an increased benefit of ischemic preconditioning in patients with hepatic steatosis who had lower resected liver volume (<50%) [9], and extensive resections are generally not recommended for patients with cirrhosis [10]. Hemihepatectomy (i.e., resection of the right or left hemiliver) has now been successfully and frequently used for surgical removal of liver-associate tumors and cancers [11-13]. However, the molecular mechanisms of liver regeneration and the protein expression profiles of livers with clinically-relevant lower volume resection have not yet been reported. In this study, 50% PH in mice was conducted to mimic the clinical conditions where approximately half of the liver is surgically removed, and the proteomic changes were analyzed during liver regeneration after PH. This work may lay the foundation for further studies on key factors and cell markers involved in liver regeneration.
Results
Histological examination of the regenerating liver
Staining with hematoxylin & eosin (H&E) revealed normal hepatic architecture within the clear hepatic lobule, radial liver cell cord, and clear hepatic sinusoid in no-surgery control and sham-operated mouse livers. In contrast, pathological symptoms were seen with livers subjected to 50% PH: 1 to 3 days post PH, liver cell acidophilic necrosis appeared and became intensified, and the majority of hepatocyte nuclei were increased in size, with vesicular bodies and prominent nucleoli caryocinesia, and stromal inflammatory cell infiltration; at 25 days, the degeneration of liver cells was lessened, but a substantial proportion of the hepatocytes still had enlarged nuclei indicative of cell division, which were seen even at 36 days (Fig. 1).
Figure 1.
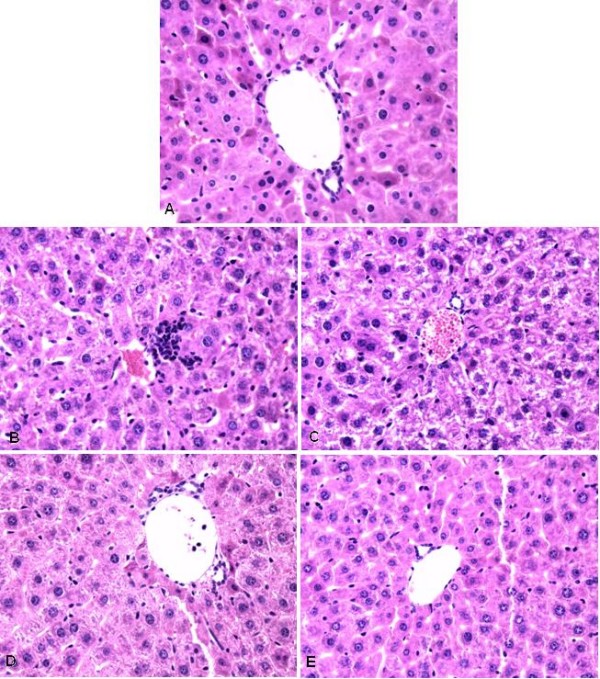
Histological examination of regenerating mouse livers following 50% PH. Fig.1(A) Liver histology slide of sham-operation group (HE staining 400×) showing clear hepatic lobule, radial liver cell cord, and clear hepatic sinusoid; Fig.1(B) Liver histology slide of 50% PH group 1 day after operation (HE staining 400×) showing cloudy swelling of some hepatocytes with focal piecemeal necrosis, and hepatocytes with multiple and enlarged nuclei started to appear. Fig.1(C) Liver histology slide of 50% PH group 3 days after operation (HE staining 400×) showing the majority of hepatocytes with double, multiple nuclei or single enlarged nuclei, prominent nucleoli, and cytoplasmic acidophilic bodies; Fig.1(D) Liver histology slide of 50% PH group 13 days after operation (HE staining 400×) showing double or enlarged nuclei but less prominent acidophilic bodies in most hepatocytes; Fig.1(E) Liver histology slide of 50% PH group 25 days after operation (HE staining 400×) showing double or enlarged nuclei still present in many hepatocytes which contain much reduced acidophilic bodies.
Differentially expressed proteins in regenerating mouse livers following 50% PH
Although we collected regenerating liver samples from day 1 through day 36 post 50% PH, data analysis has been focused on day 1 post PH as this is the time point when DNA and protein synthesis become most active [6,14] (Fig. 2). Among the 435 and 447 proteins identified respectively in the sham-operated and the 50% PH group, 87 proteins were found to be differentially expressed. They were categorized into four groups: group 1 in which 17 proteins were up-regulated with 50% PH (Table 1); group 2 in which 33 proteins were detected only in 50% PH group but not in sham-operated control, and thus are considered to be newly induced (Table 2); group 3 in which 15 proteins were down-regulated with 50% PH (Table 3); and group 4 in which 22 proteins were below detection limit in 50% PH group (i.e., detected only in sham-operated control but not in 50% PH group) (Table 4). In broad sense, proteins in group 1 and 2 (totally 50) can all be viewed as up-regulated proteins, and those in group 3 and 4 (totally 37) as down-regulated proteins in response to 50% PH. These differentially expressed proteins are involved in multiple critical metabolic and signaling pathways as classified in tables 1, 2, 3, 4.
Figure 2.
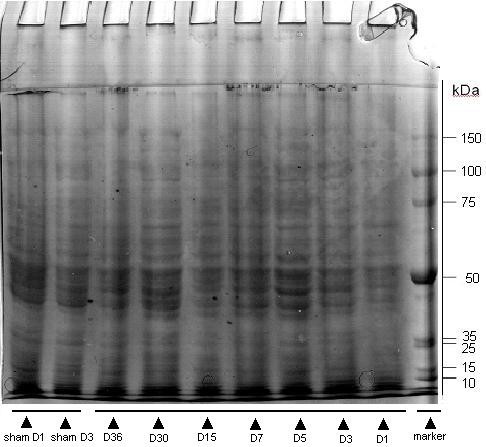
Representative image of an SDS-PAGE gel separating mouse liver protein samples. 60 μg of each sample from either sham-operated or 50% PH group recovered for different time period was separated on 10% SDS polyacrylamide gels. The gel was stained with Colloidal Coomassie Brilliant Blue G for 4 hours, and destained in a destaining solution.
Table 1.
Up-regulated proteins in regenerating mouse livers 24 h post 50% PH (group 1)
| IPI NUMBER | GENE SYMBOL | PROTEIN DISCRIPTION | SCORE | RATIO |
|---|---|---|---|---|
| Carbohydrate, lipid and energy metabolism | ||||
| IPI00111218 | Aldh2 | Aldehyde dehydrogenase, mitochondrial precursor | 966.19 | 14.29 |
| IPI00221890 | Car3 | Carbonic anhydrase 3 | 384.26 | 2.44 |
| IPI00459487 | Suclg2 | Isoform 1 of Succinyl-CoA ligase [GDP-forming] beta-chain, mitochondrial precursor | 446.22 | 1.75 |
| IPI00226430 | Acaa2 | 3-ketoacyl-CoA thiolase, mitochondrial | 750.05 | 2.04 |
| IPI00127558 | Acox1 | Acyl-coenzyme A oxidase 1, peroxisomal | 199.01 | 3.85 |
| Cell regeneration-related proteins | ||||
| IPI00885570 | Actb | Beta-actin (Fragment) | 200.18 | 1.19 |
| Amino acid and nucleic acid metabolism | ||||
| IPI00134961 | Acadm | Medium-chain specific acyl-CoA dehydrogenase, mitochondrial precursor | 156.52 | 3.33 |
| IPI00117914 | Arg1 | Arginase-1 | 399.59 | 5 |
| IPI00134746 | Ass1 | Argininosuccinate synthase | 237.27 | 3.45 |
| IPI00111908 | Cps1 | Carbamoyl-phosphate synthase [ammonia], mitochondrial precursor | 993.62 | 6.67 |
| Signal transmission | ||||
| IPI00626662 | Aldh1a1 | Retinal dehydrogenase 1 | 1156.13 | 1.56 |
| Inflammatory factors and related proteins | ||||
| IPI00165796 | Gstm4 | Glutathione transferase GSTM7-7 | 335.83 | 2.44 |
| IPI00555023 | Gstp1 | Glutathione S-transferase P 1 | 807.98 | 1.64 |
| IPI00283531 | Gstp2 | Glutathione S-transferase P 2 | 339.02 | 2 |
| IPI00133903 | Hspa9 | Stress-70 protein, mitochondrial precursor | 294.54 | 3.57 |
| IPI00133522 | P4hb | Protein disulfide-isomerase precursor | 343.67 | 3.85 |
| IPI00230108 | Pdia3 | Protein disulfide-isomerase A3 precursor | 184.87 | 2 |
Table 2.
Newly-induced proteins in regenerating mouse livers 24 h post 50% PH (group 2)
| IPI NUMBER | GENE SYMBOL | PROTEIN DISCRIPTION | SCORE |
|---|---|---|---|
| Carbohydrate, lipid and energy metabolism | |||
| IPI00466128 | Akr1a4 | Alcohol dehydrogenase | 185.05 |
| IPI00127206 | Aldob | Fructose-bisphosphate aldolase B | 275.21 |
| IPI00469380 | Aox3 | Aldehyde oxidase 1 | 127.7 |
| IPI00108939 | Gapdhs | glyceraldehyde-3-phosphate dehydrogenase, spermatogenic | 194.98 |
| IPI00319994 | Ldha | L-lactate dehydrogenase A chain | 227.86 |
| IPI00121079 | Cyb5r3 | Isoform 1 of NADH-cytochrome b5 reductase 3 | 128.55 |
| IPI00130804 | Ech1 | Delta(3,5)-Delta(2,4)-dienoyl-CoA isomerase, mitochondrial precursor | 333.62 |
| IPI00469195 | Echdc2 | Isoform 1 of Enoyl-CoA hydratase domain-containing protein 2, mitochondrial precursor | 94.22 |
| Cell regeneration-related proteins | |||
| IPI00461514 | Hist1h2be | Hist1h2bc Histone H2B | 122.68 |
| IPI00187543 | Hist2h2be | Histone H2B type 2-E | 122.68 |
| IPI00229539 | Hist3h2bb | histone cluster 3, H2bb | 122.68 |
| IPI00348270 | Hist2h2bb | Histone H2B type 2-B | 122.68 |
| IPI00648991 | Hist1h2bp | Isoform 1 of Histone H2B type 1-P | 122.68 |
| IPI00129526 | Hsp90b1 | Endoplasmin precursor | 305.35 |
| IPI00406377 | Krt7 | Keratin, type II cytoskeletal 7 | 138.69 |
| IPI00221797 | Krt75 | Keratin, type II cytoskeletal 75 | 260.86 |
| IPI00785403 | Krt6b | keratin complex 2, basic, gene 6b | 260.86 |
| IPI00131368 | Krt6a | Keratin, type II cytoskeletal 6A | 260.86 |
| IPI00331459 | Krt85 | Keratin type II cuticular Hb5 | 139.91 |
| IPI00139301 | Krt5 | Keratin, type II cytoskeletal 5 | 260.86 |
| IPI00626239 | Rpl11 | Ribosomal protein L11 | 126 |
| IPI00125521 | Rps5 | 40S ribosomal protein S5 | 132.84 |
| IPI00274407 | Tufm | Isoform 1 of Elongation factor Tu, mitochondrial precursor | 245.14 |
| Amino acid and nucleic acid metabolism | |||
| IPI00269076 | Ak2 | Adenylate kinase isoenzyme 2, mitochondrial | 178.47 |
| IPI00116222 | Hibadh | 3-hydroxyisobutyrate dehydrogenase, mitochondrial precursor | 309.66 |
| IPI00116603 | Otc | Ornithine carbamoyltransferase, mitochondrial precursor | 340.46 |
| IPI00129178 | Oat | Ornithine aminotransferase, mitochondrial precursor | 166.18 |
| Signal transmission | |||
| IPI00317309 | Anxa5 | Annexin A5 | 168.8 |
| IPI00230540 | Vdac1 | Isoform Mt-VDAC1 of Voltage-dependent anion-selective channel protein 1 | 139.28 |
| Inflammatory factors and related proteins | |||
| IPI00316509 | Ephx1 | Epoxide hydrolase 1 | 203.74 |
| IPI00230185 | Gpd1 | Glycerol-3-phosphate dehydrogenase [NAD+], cytoplasmic | 141.79 |
| IPI00331322 | Mgst1 | Microsomal glutathione S-transferase 1 | 183.83 |
| IPI00134131 | Scp2 | Isoform SCPx of Non-specific lipid-transfer protein | 203.84 |
Table 3.
Down-regulated proteins in regenerating mouse livers 24 h post 50% PH (group 3)
| IPI NUMBER | GENE SYMBOL | PROTEIN DISCRIPTION | SCORE | RATIO |
|---|---|---|---|---|
| Carbohydrate, lipid and energy metabolism | ||||
| IPI00323592 | Mdh2 | Malate dehydrogenase, mitochondrial precursor | 469.97 | 1.6 |
| IPI00130280 | Atp5a1 | ATP synthase subunit alpha, mitochondrial precursor | 777.7 | 1.42 |
| IPI00230507 | Atp5h | ATP synthase subunit d, mitochondrial | 158.83 | 1.51 |
| IPI00755311 | Cat | Catalase | 150.19 | 2.66 |
| Cell regeneration-related proteins | ||||
| IPI00136929 | Actg1 | Gamma actin-like protein | 440.24 | 1.46 |
| IPI00129028 | EG434428 | similar to Tubulin, alpha 3c isoform 1 | 405.05 | 1.42 |
| IPI00133456 | Rgn | Regucalcin | 385.17 | 2.77 |
| Amino acid and nucleic acid metabolism | ||||
| IPI00130950 | Bhmt | Betaine--homocysteine S-methyltransferase 1 | 526.33 | 1.42 |
| IPI00117312 | Got2 | Aspartate aminotransferase, mitochondrial precursor | 363.02 | 1.28 |
| IPI00554931 | Hpd | 4-hydroxyphenylpyruvate dioxygenase | 260.38 | 1.84 |
| Signal transmission | ||||
| IPI00762128 | Tst | 33 kDa protein | 192.75 | 3 |
| Inflammatory factors and related proteins | ||||
| IPI00230212 | Gstm1 | Glutathione S-transferase Mu 1 | 1479.46 | 1.49 |
| IPI00648333 | Gstm4 | Glutathione S-transferase, mu 4 | 339.86 | 1.95 |
| IPI00323357 | Hspa8 | Heat shock cognate 71 kDa protein | 151.26 | 1.58 |
| IPI00319652 | Gpx1 | Glutathione peroxidase 1 | 184.93 | 1.55 |
Table 4.
Proteins below detection limit in regenerating mouse livers 24 h post 50% PH (group 4)
| IPI NUMBER | GENE SYMBOL | PROTEIN DISCRIPTION | SCORE |
|---|---|---|---|
| Carbohydrate, lipid and energy metabolism | |||
| IPI00126625 | Acsm1 | Isoform 1 of Acyl-coenzyme A synthetase ACSM1, mitochondrial precursor | 246.24 |
| IPI00338536 | Sdhb | Succinate dehydrogenase [ubiquinone] iron-sulfur subunit, mitochondrial precursor | 141.26 |
| Cell regeneration-related proteins | |||
| IPI00119667 | Eef1a2 | Elongation factor 1-alpha 2 | 147.8 |
| IPI00108125 | Eif5a | Eukaryotic translation initiation factor 5A-1 | 107.8 |
| IPI00121309 | Ndufs3 | NADH dehydrogenase [ubiquinone] iron-sulfur protein 3, mitochondrial precursor | 114.89 |
| IPI00762051 | Rpl24 | 60S ribosomal protein L24 | 108.35 |
| IPI00112448 | Rps10 | 40S ribosomal protein S10 | 115.27 |
| Amino acid and nucleic acid metabolism | |||
| IPI00461964 | Aldh6a1 | Methylmalonate-semialdehyde dehydrogenase [acylating], mitochondrial precursor | 302.15 |
| IPI00120123 | Dmgdh | Dimethylglycine dehydrogenase, mitochondrial precursor | 147.51 |
| IPI00114840 | Endog | Endonuclease G, mitochondrial precursor | 87.98 |
| IPI00742399 | Gamt | Isoform 1 of Guanidinoacetate N-methyltransferase | 109.42 |
| IPI00856685 | Fah | 16 kDa protein | 176.55 |
| IPI00856409 | Got1 | Protein | 121.03 |
| IPI00880958 | Hpd | 18 kDa protein | 211.4 |
| IPI00173179 | Mettl7b | Methyltransferase-like protein 7B precursor | 116.73 |
| Signal transmission | |||
| IPI00153317 | Aldh1l1 | 10-formyltetrahydrofolate dehydrogenase | 413.41 |
| IPI00170307 | Apoa1bp | Apolipoprotein A-I-binding protein precursor | 127.86 |
| IPI00134432 | Ugt | Ugt1a6b;Ugt1a5;Ugt1a1;Ugt1a10;Ugt1a9;Ugt1a2; LOC632297;Ugt1a7c;Ugt1a6a UDP-glucuronosyltransferase 1-6 precursor | 164.75 |
| IPI00226356 | Ttpa | Alpha-tocopherol transfer protein | 171.27 |
| Inflammatory factors and related proteins | |||
| IPI00458306 | Gstm2 | Glutathione transferase (EC 2.5.1.18) class mu chain Yb2 (Fragment) | 149.31 |
| IPI00881469 | Gstt1 | glutathione S-transferase, theta 1 | 91.43 |
| IPI00554929 | Hsp90ab1 | Heat shock protein HSP 90-beta | 358.82 |
Regucalcin(Rgn), a Ca2+ binding protein that plays an important role in cellular calcium homeostasis [15], has previously been identified as an up-regulated protein in response to 30% PH [16] but a slightly down-regulated protein following 70% PH [17]. Based on our proteomic analysis, the protein level of Rgn was reduced by 2.8 fold in the regenerating liver 24 h post 50% PH (Table 3). Using RT-PCR and Western Blotting, we further followed the dynamic changes of this protein over a time period of 30 days. The down-regulation of Rgn at both mRNA and protein levels was confirmed, and there was a rapid but partial recovery of Rgn at both levels over time (Fig. 3).
Figure 3.
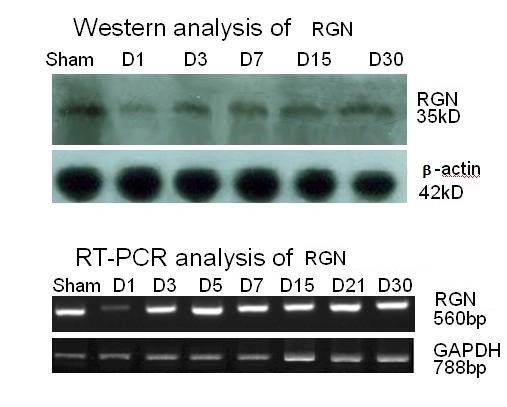
Time course of the level of protein and mRNA of Rgn in regenerating mouse liver following 50% PH. Liver samples from either sham-operated or 50% PH group recovered for different time period were analyzed by Western blot (upper) or RT-PCR (lower) for detecting the protein and mRNA of Rgn, respectively, as described in Methods. β-actin and GAPDH was probed in Western blot and RT-PCR, respectively, as a reference protein.
Pathways regulating liver regeneration following 50% PH
When all the 87 differentially-expressed proteins were pooled together for pathway analysis, 18 of them can be clustered into the same pathway and connected to each other in one way or another (Fig. 4 and Additional file 1). c-Myc situates at the center of this network. Among them, ACAA2, ALDH2, ACOX1, GSTP1, ACADM, ASS1(ASSY) were up-regulated and VDAC1, MGST, RPL11, ALDX, RPS5 were "newly-induced" in response to 50% PH; ACTG1(Actin cytoplasmic 2), HSPA8(HSC70), CAT(catalase) were down-regulated and FAH(FAAA), NDUFS3, RPS10, eEF1A2 were below detection limit.
Figure 4.
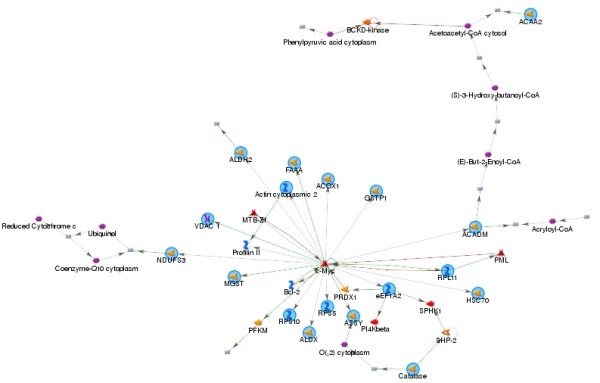
Pathway analysis result showing 18 differentially expressed proteins following 50% PH can be sorted into the c-myc pathway. There are 18 root nodes in the sub-network shown, of which ACAA2, ALDH2, ACOX1, GSTP1, ACADM, ASS1(ASSY) are up-regulated and VDAC1, MGST, RPL11, ALDX, RPS5 are "newly-induced" in response to 50% PH; ACTG1(Actin cytoplasmic 2), HSPA8(HSC70), CAT(catalase) are down-regulated and FAH(FAAA), NDUFS3, RPS10, eEF1A2 are below detection limit. These root nodes are connected to c-Myc directly or indirectly, and their expression levels or activities can be regulated by c-Myc, and some of them (such as RPL11) can regulate c-Myc activity in a feedback manner. Legend describing symbols in the network can be found in Additional file 1.
Discussion
Studies with hepatic resections have shown that within a certain range, the regenerative response is proportional to the amount of liver removed [18]. In most cases, removal of up to 75% of the liver was tolerated in patients with normal liver function pre-operatively [4], but greater than 75% to 80% resection is associated with a high mortality rate because of liver failure [3,4]. Therefore, to stimulate maximal liver regeneration yet maintain sufficient hepatic functionality, 70% (or 2/3) PH becomes the most commonly-used model to study the molecular mechanisms of rodent liver regeneration [19]. Previous results showed that many factors such as hepatocyte growth factor (HGF) [20], nuclear factor-kB (NF-kB) [21], tumor necrosis factor (TNF) [22] and interleukin (IL) 6 [23] might participate in the initiation of liver regeneration. In addition, serotonin, a neurotransmitter transported within the peripheral circulation by platelets, appears to be a co-mitogen that is essential for hepatic regeneration [24]. Based on the 70% PH model, a number of large-scale genomic [25-27] and proteomic [17,28-30] studies have been performed to map the complex dynamic changes of gene/protein expression during the process (in particularly the early phase) of liver regeneration, and various differentially regulated clusters of genes/proteins have been reported.
However, a lower percentage (e.g., 40-50%) of PH is more frequently conducted in partial liver transplantation [7] where hemiliver is removed from the donor. Moreover, resection must be more conservative in the presence of liver diseases (such as hepatic steatosis and cirrhosis), in patients after chemotherapy or in elderly patients [7]. Following removal of up to 50% of functioning liver, there was usually only a mild and short-lived increase in serum bilirubin and depression of serum proteins indicating sustained conservation of hepatocellular function [31]. In contrast to 70% PH, however, the molecular events of liver regeneration following 50% PH are much less understood and documented. We therefore sought to determine the global expression profile of proteins in the regenerating mouse liver following ~50% PH, and thereby gaining some insights into the hepatic regeneration mechanism(s) under this milder but clinically more relevant condition.
We grouped all the identified proteins into four categories that are deferentially expressed between mice subject to 50% PH and sham-operation. In group 1, 17 proteins were found to be up-regulated in 50% PH as opposed to the sham-operated group. Among them, 4 proteins have previously been associated with liver regeneration through proteomic studies: ALDH2 [17], CPS1 [17], HSPA9 [17], and CAR3 [30]. Firstly, mitochondrial aldehyde dehydrogenase 2 (ALDH2), the enzyme oxidizes a wide variety of aliphatic and aromatic aldehydes and converts them to acetic acid, which plays an important role in the clearance of ethanol-derived cytotoxic acetaldehyde [32], was found to be dramatically up-regulated by 14.3 fold in our study as compared to 2.8 fold increase in the study of Deng et al. [17] where regenerating rat livers were analyzed 4 h post 70% PH. Activation of ALDH2 correlates with reduced ischemic heart damage in rodent models most likely through reducing the formation of cytotoxic aldehydes [33]. Up-regulation of this enzyme at the protein level in liver cells was recently reported for rats exposed to heat stress [34]. Mitochondrial ALDH2 also plays a key role in bioconversion of nitroglycerin to its active vasodilator metabolite, and its oxidative inactivation by mitochondrial reactive oxygen species (ROS) underlies the development of nitrate and cross-tolerance [35]. Based on our pathway analysis (Fig. 4), ALDH2 is sorted into the c-Myc pathway which plays a critical role in regulating liver regeneration [36]. Secondly, HSPA9, which belongs to the heat shock protein 70 family, plays a role in the control of cell proliferation, and may also act as a chaperone [37,38], was found to be up-regulated by 3.6 fold, comparable to ~2 fold up-regulation reported by Deng et al. [17].
According to the Ingenuity Pathway Analysis conducted by Deng et al. [17], both ALDH2 and HSPA9 can be sorted into the Akt-NF-κB-p38MAPK signaling pathway, which is known to be essential for cell proliferation and liver regeneration [39,40]. Thirdly, another up-regulated protein found in both our study (by 6.7 fold) and in the report of Deng et al. [17](by 2.2 fold) is CPS1. It is primarily localized to liver mitochondria and plays a key role in the urea cycle. Patients with defects in the function or expression of CPS1 suffer from hyperammonemia [41]. It was found to be present in high concentrations in the plasma of septic humans, and thus to be considered as a biomarker for mitochondrial damage and depletion. This mitochondrial depletion is not due to cell death but is apparently related to the removal of damaged mitochondria by lysosomes (i.e., autophagy), followed by repletion of mitochondrial populations [42]. In Deng et al. study [17], CPS1 was sorted into the RB1-TP53-Myc pathway, which is known to be related to apoptosis, proliferation and cell-cycle progression [43-45]. Fourthly, CAR3 was found to be up-regulated by 2.4 fold in our study. The induced expression of this enzyme was found to be accompanied by increased cell proliferation and oxidative stress in mouse kidney [46]. Interestingly, CAR3 was found to be slightly down-regulated in regenerating mouse liver 1 to 3 days post 2/3 PH [30], and the cause for the discrepancy between the two studies remains unknown.
Besides the above 4 proteins which were also identified by other researchers, the augment of the remaining 13 proteins at the protein level has not yet been reported although some of them were found to be up-regulated at the mRNA level [47]. Among them, of particular note are ACOX1 (3.9 fold increase), the initial rate-limiting enzyme in the conversion of long-chain fatty acids to acyl-CoA thioesters, which donates electrons directly to molecular oxygen thereby producing hydrogen peroxide [48]. Also, this protein is sorted into the c-Myc pathway in our pathway analysis (Fig. 4). Elevation of ACOX enzyme activity (by ~3 fold) was reported for regenerating mouse liver 1 day after 70% PH, and was considered to result directly from transcriptional up-regulation by the transcription factor, peroxisome proliferator-activated receptor-α (PPARα) [49]. It is well established that numerous genes encoding peroxisomal, mitochondrial, and microsomal enzymes contain functional PPARα -responsive elements in their promoter regions, and these PPARα -responsive genes are largely involved in lipid metabolism, β-oxidation of fatty acids, and isoprenoid synthesis, processes required for cell proliferation [49]. Thus, identification of ACOX1 as an up-regulated protein in our system may indicate the global up-regulation of the PPARα-regulated pathways. However, the parallel induced expression of RPL11, a negative regulator of PPARα [50], may indicate a well-balanced control of this signaling pathway via feedback mechanism during liver regeneration. Since HP represents a major injury to the liver and to the whole body as well, it is expected to see altered expression of inflammatory and stress factors. Indeed, protein disulfide isomerase family which represents an injury response signal that can activate tissue factors to initiate blood coagulation [51] and to support extracellular matrix assembly [52], was up-regulated by 2 to 3.9 fold; in broad sense, HSPA9, as has been mentioned above, also belongs to stress responsive proteins.
In group 2, 33 proteins were detected only in 50% PH group but not the sham-operated group, and therefore are termed "newly-induced proteins". The failure of detecting those proteins in sham-operated group could be due either to true absence of expression of those proteins or to their very low quantity which is below the detection limit of our assay. In the latter case, those proteins are actually also up-regulated ones which are essentially the same as those classified into Group 1. About half (15 out of 33) of the "newly-induced proteins" in response to 50% PH belongs to cell regeneration related proteins, and among them, 5 are Histone (H2B) proteins, the post-translational modifications of which are known to be important for regulating gene transcription [53]. This finding is in good agreement with the one reported by Lim et al. [54] where the newly synthesis of the DNA and the mRNA of H2B was found to peak at 24 h and 36 h, respectively, after PH.
Keratin represents another major group of protein specifically detected in the regenerating mouse liver. Keratins are the largest subfamily of intermediate filaments consisting of >50 unique gene product members which include 37 epithelial and 17 hair keratin members in humans [55]. The hepatocytic keratin network is dense, particularly around bile canaliculi and at the cell periphery, and acts as cytoskeletal backbone to the functionally more dynamic and contractile actin microfilament system [56]. Keratins exhibit anti-oxidative and anti-apoptotic properties through sequestering oxidatively damaged proteins or apoptotic proteins, and are involved in cell protection [57]. Although there is evidence that keratin filaments can modulate hepatocyte mitotic progression [58] and liver regeneration [59], our present study showed for the first time the induced expression of keratins in regenerating livers. The rest of the newly-induced proteins are mainly those involved in carbohydrate, lipid synthesis, amino acid and nucleic acid metabolism. One of them, OAT, is a mitochondrial matrix enzyme that controls the L-ornithine level in tissues by catalyzing the transfer of the delta-amino group of L-ornithine to 2-oxoglutarate [60]. In agreement with our finding, an up-regulation of this protein was also reported by Hsieh et al. [30] where regenerating mouse livers following 2/3 PH were analyzed.
Group 3 and group 4 proteins are down-regulated or below detection limit with 50% PH treatment, respectively. Overall, the extent of down-regulation (as reflected by fold change or ratio) of proteins was not as dramatic as that of up-regulation, and was all below 4.2 fold reduction. Among those down-regulated proteins, the enzymes involved in ATP production and tubulin-like cytoskeleton proteins are particularly noteworthy. ATP5A1 and ATP5H which encodes α- and d- subunit of mitochondrial ATP synthase F1 and F0 complex, respectively, was down-regulated by 1.5-4.2 fold. Mitochondrial ATP synthase catalyzes ATP synthesis, using an electrochemical gradient of protons across the inner membrane during oxidative phosphorylation. The down-regulation of these ATP synthase subunits may lead to a decrease in cellular ATP production. Consistent with this is the finding that a number of key enzymes (such as SDHB, MDH2, NDUFS3) involved in citric acid cycle and the electron transport chain were also down-regulated or below detection limit, which could blunt the oxidative phosphorylation processes that are critical for ATP production. Indeed, Crumm et al. [61] reported that the ATP levels in remnant livers following both 30% and 70% PH decreased markedly and rapidly (to 48% of control by 30 seconds post-PH) and remained significantly lower than those in sham-operated controls for 24 to 48 hours. The reduction of ATP content in regenerating liver was not caused by increased energy demand, but by ATP release from the liver, and could generate early stress signals that contribute to the onset of liver regeneration. Our findings here provide important molecular mechanism for the phenomenon.
Tubulins are the main component forming the microtubule cytoskeleton in eukaryotic cells and play a key role in the regulation of the mitotic spindle for centrosome/chromosome movements in cell division and specific neuronal functions [62]. The expression level of tubulin subunits is relatively stable under most conditions. However, a strong down-regulation of β-tubulin mRNA was seen with hepatocytes treated with a nephro- and hepatotoxic mycotoxin [63]. We found a 1.4-2.5 fold decrease in α-tubulin protein level in regenerating liver, which is in contrast with the up-regulation of keratin as mentioned above. Interestingly, an opposing regulatory pattern of these two cytoskeletal components in liver tissues has also been seen in patients with hepatocellular carcinoma where β-tubulin protein level was up-regulated and keratin 8 down-regulated [64]. It remains to be investigated whether the opposing regulatory pattern of tubulin and keratin has any functional implications.
Remarkably, over 25 out of the 87 differentially-expressed proteins are located at the mitochondria, including the down-regulated ones mentioned above that are involved in ATP production. Thus, our study provides novel evidence for mitochondria as a pivotal organelle that is connected to liver regeneration. Recently, subproteomic analysis of proteins in isolated rat liver mitochondria after 70% PH revealed 25 differentially regulated proteins of which approximately half was identified in our current study [65]. However, in that study, only 3 proteins were found to be up-regulated while all the other 22 proteins (including ALDH, SUCLG2 which are up-regulated in our study) down-regulated. Since it has been reported that some proteins are released from mitochondria during liver regeneration after PH [66], it is conceivable that some of the up-regulated proteins detected in whole liver homogenate (such as ALDH2 in our study) may release from mitochondria into the cytosol, leaving their contents in isolated mitochondria even lower than those present in sham-operated control. Thus, subcellular fractionation and/or histochemistry/immunohistochemistry based studies will be helpful in determining the dynamic spatial and temporal changes of those identified mitochondrial proteins during the regeneration process.
Conclusions
Taken together, compared to sham-operated group, we detected totally 87 differentially expressed proteins (with 50 up-regulated and 37 down-regulated ones) in the regenerating mouse livers following 50% PH, a condition that is clinically relevant to liver transplantation and conservative liver resection. Among them, over 25 are located at the mitochondria, and the majority is reported to be associated with liver regeneration for the first time. Consistent with the documented regulatory roles of c-Myc during the G1 phase of liver regeneration [67] and in the "priming" of hepatocytes [17,68], 18 of the identified differentially-expressed proteins are connected to c-Myc in a complex signaling network via multiple modes, and thus placing c-Myc as one of the master factors regulating liver regeneration under our experimental conditions. Importantly, the functional roles of some newly identified proteins in liver regeneration await further clarification, and whether they are differentially regulated specifically with 50% PH but not with other volume of PH is currently under investigation. Furthermore, in future, proteomic analysis-based time course studies will be useful to unravel the mechanisms that govern cessation of the regenerative process once the original liver mass has been restored.
Methods
Animal models
34 male C57/BL6 mice, with a mean weight of 20 g each, were purchased from Sichuan Academy of Medical Science Institute of Laboratory Animals. Animals were kept under standard conditions with a 12-hour day/night cycle and access to food and water ad libitum. Animal protocols were approved by the Ethics Committee of the First Affiliated Hospital of Zhejiang University before the commencement of the study.
These mice were divided into the no surgery control group (2), 50% PH group (28), and sham-operation group (4) by using a random number table. Before the operation, 3 liver samples were resected from the no surgery control group via the abdominal cavity. For the 50% PH group, approximately 45% -50% of the liver was resected via lobectomy from the lower-left region of the liver along the margin of the fourth bile duct. Two mice were sacrificed after operation at the following time points: Day 1, 3, 5, 7, 9, 11, 13, 15, 18, 21, 25, 30, and 36. Of the 3 liver tissue samples resected from each mouse, one was fixed with 4% paraformaldehyde and paraffin-embedded for biopsy, and the other two samples were stored at -80°C until samples from all time points are ready to be analyzed simultaneously. Two mice from the 50% PH group were dead after the operation.
Extraction and purification of proteins
10 ml of T-PER® Tissue Protein Extraction Reagent (Pierce, Rockford, IL USA), supplemented with 1 mM PMSF (Pierce, Rockford, IL USA) and 5 mM EDTA were prepared prior to use. The resected liver samples were washed in pre-chilled PBS and two samples were combined for each time point. The samples were grinded into a homogenous mixture via Sample Grinding Kit (Amersham Biosciences, Piscataway, NJ USA.); centrifuged at 10,000 × g for 15 min. The SDS-PAGE Sample Prep Kit (Pierce, Rockford, IL USA) was used for protein purification and the BCA™ Protein Assay Kit (Pierce, Rockford, IL USA) for protein quantification.
Separation of proteins by SDS-PAGE
60 μg of each sample was separated on 10% SDS polyacrylamide gels. Gels were stained with Colloidal Coomassie Brilliant Blue G (Sigma, St Louis, MO USA) for 4 hours, and then were destained in a destaining solution (40% methanol, 10% acetic acid). Gels were scanned with ImageScanner II (Amersham Biosciences) and band intensities quantified by Volume Integration method using ImageQuant TL software (version 2005, Amersham Biosciences). The gel loading of 50% PH samples was confirmed to be between 100 ± 10% of that of the sham control in most cases, and was normalized in a few cases, by the total band intensity of each lane in the same gel.
In-gel digestion and sample preparation
The entire lane was cut into 19 strips according to the visible bands. Each fragment was cut into 1~2 mm3 gel pieces. In-gel reduction was performed with TCEP (Sigma, St Louis, MO USA) for 10 minutes at 60°C and carbamidomethylation was conducted with IAA (Sigma, St Louis, MO USA) for 1 hour at room temperature in the dark. The samples were dried via Speedvac (Labconco Centrivap Concentrator, Kansas City, MO USA). 15 μl of 25 mM NH4HCO3 buffer containing sequence grade trypsin (Promega, Madison, WI USA.) was added to each tube and each sample was allowed to rehydrate at room temperature for 15 minutes. Tryptic digestion was carried out overnight at 37°C. Peptides were extracted by washing the gel pieces three times with 50% acetonitrile and 5% formic acid. The supernatant was concentrated by a SpeedVac and was re-suspended in 30 μl of water with 0.1% formic acid for mass spectrometric analysis. All samples were stored at -20°C and were centrifuged at 15,000 × g for 5 minutes prior to mass spectrometric analysis.
Protein identification and analysis
NanoUPLC conditions
Tryptic peptide separations were performed with a nanoACQUITY UPLC™ System (Waters Corporation, Milford, MA, USA), using a trapping column (Symmetry® C18, 5 μm, 180 μm × 20 mm) (Waters Corporation, Milford, MA) and an analytical reversed-phase column (BEH130 C18, 1.7 μm, 75 μm × 150 mm) (Waters Corporation, Milford, MA), Samples were initially loaded and transferred with aqueous 0.1% formic acid solution to the trapping column at a flow rate of 15 μl/min for 1 min. Mobile phase A was water with 0.1% formic acid and B was 0.1% formic acid in acetonitrile. The peptide was separated with a gradient from 3% B to 40% B in 90 minutes, then to 90% B for 10 minutes, and held in 90% B for 10 minutes, at a flow rate of 300 nl/min. The column was re-equilibrated at initial conditions (3% B) for 30 minutes.
Q-Tof Premier mass spectrometer conditions
Mass spectrometry (MS) analysis of tryptic peptides was performed using Q-Tof premier™ mass spectrometer (Waters Corporation, Milford, MA, USA) with a nanoLockSpray™ source. External calibration was initially performed and the data subsequently post-acquisition lock mass corrected using Glu-fibrinopeptide (MW 785.8426), to ensure high mass accuracy. Data was acquired in the range from 50 Da to 1990 Da with the positive V-mode using alternating low collision energy (4 e V) (MS mode) and the course of the high energy was stepped from 15 to 40 e V (MSE mode). An integration time of 0.6 seconds was used for each scan. The reference, lock mass, channel was sampled every 30 seconds.
Data processing and protein identification
The continuum LC-MS data were processed and searched against the ipi.MOUSE.v3.40.fasta protein database http://www.ebi.ac.uk/IPI/IPImouse.html using ProteinLynx Global Server (PLGS) version 2.3, a fully automatic and integrated Mass-Informatics™ platform for quantitative and qualitative proteomics research[69]. Stringent search criteria were set so that each protein identification was collectively determined by at least 7 tryptic fragments and a matching peptide whose identification was determined by at least 3 tryptic fragments. Protein identification scores were calculated by the software and reported in the tables which provide a measure of confidence for the proteins identified. Since the LC-MS was performed in triplicate, the triplicate data were processed separately, and only an identification observed in at least two of the three replicates was taken to be valid (Fig. 5). The average MS signal of the three most intense tryptic peptides from each protein was taken as a measure for the relative quantity of that protein[70], and the ratio of this signal in 50% PH samples versus that in sham control sample was calculated and used to determine up or down-regulation of the specific protein upon 50% PH treatment. The gel equal loading validation/correction, and the triplicate MS identification, collectively ensured the authenticity of the results.
Figure 5.

Representative mass spectra of triplicate samples on nanoLC-Q-Tof Fig.5 (A-C) Individual mass spectrum of each of the triplicate samples shown in different colors. Fig.5 (D) An overlay of the mass spectrum of the triplicate samples. The high degree of overlapping of most peaks present in the triplicate samples demonstrated good reproducibility of the method. The protein identification was conducted separately with the triplicate samples, and only an identification observed in at least two of the three replicates was taken to be valid. In those cases, at least two out of the three mass spectra exhibited high degree of overlapping as shown in this figure.
Validation of the expression of selected proteins by Western blot analysis and RT-PCR
Western blot
Proteins were separated on 10% polyacrylamide gels and were transferred to PVDF membranes (Millipore, Bedford, MA, USA). The blots were incubated for 2 hours at room temperature in the TBST buffer (20 mM Tris-Cl, 140 mM NaCl, Ph 7.5, 0.05% Tween-20) containing 5% skim milk. Blots were incubated with the primary antibody (such as anti-RGN, diluted at 1:500, Santa Cruz Biotechnology, CA, USA; or anti-β-actin, 1: 2000, Sigma) overnight at 4°C. After being washed for three times in TBST, the blots were incubated with horseradish peroxidase-conjugated secondary antibody (diluted at 1:5000), (Pierce Biotechnology, Rockford, IL, USA) for 1 hour at room temperature, and developed with ECL reagents (Pierce Biotechnology, Rockford, IL, USA).
RT-PCR
Total RNA was isolated from liver tissues with TRIzol Reagent (Invitrogen). First-strand Cdna was generated from 1 μg of total RNA using an oligo (Dt) primer and the ImProm-II™ Reverse Transcription System (Promega). PCR was performed using Taq DNA polymerase (Takara). The primers used are as follows: 5'-GGAGGCTATGTTGCCACCATTGGAAC-3' and 5'-TTCCCTCCAAAGCAGCATGAAGTTGTTTTA-3' for RGN (560 bp); 5'-GTGAAGGTCGGTGTGAACGGAT-3' and 5'-GCATCCTGCTTCACCAC CTTCTT-3', for glyceraldehyde 3-phosphate dehydrogenase (GAPDH) (788 bp) [71]. The samples were incubated at 94°C for 2 min, and then amplified for 30 cycles of denaturation for 30 s at 94°C, annealing for 30 s at 60°C, and extension for 59 s at 72°C. The PCR products were analyzed by fractionation on a 1.2% agarose gel and visualized with ethidium bromide staining. Images were captured using a gel documentation system.
Pathway analysis
Pathway network analysis of all the identified proteins was conducted using the Shortest Paths and the Analyze Network options of the data mining software MetaCore version 5.4 (GeneGo, St Joseph, MI) as described in[72]. The Shortest Paths option connects all given objects with the shortest possible path, no more than 3 steps. The network is built dynamically, connecting all objects via direct mechanistic interactions based on manually curated literature evidence. It can then be used for local functional enrichment of the network itself, to associate the interconnected cluster of metabolites and proteins with specific processes or diseases.
Abbreviations
PH: partial hepatectomy; SLT: split-liver transplantation; PMSF: pheylmethylsulfonyl fluoride; EDTA: ethylene diamine tetraacetic acid; PBS: phosphate buffered saline; SDS-PAGE: sodium dodecyl ulphate polyacrylamide gel electropheresis; TCEP: trichloroethyl phosphate; IAA: iodoacetamide; nanoUPLC-Q-Tof: nanoultra performance liquid chromatrography-quadrupole-time of flight; PVDF: polyvinylidene difluoride; H&E: hematoxylin & eosin; Rgn: regucalcin; HGF: hepatocyte growth factor; NF-Kb: nuclear factor kappa-light-chain-enhancer of activated B cells; TNF: tumor necrosis factor; IL: interleukin; LC: liquid hromatography; MS: mass spectrometry.
Competing interests
The authors declare that they have no competing interests.
Authors' contributions
All authors participated in interpretation of the findings. LL and HC were responsible for the conception and design of the study. QZ made the animal models. WX, XJ, JYu, GS and YW performed the protein identification and analysis. JYu, JYa, QPan, JL and XP performed molecular biology experiments. HC and YW drafted the manuscript. LL modified and commented on the draft and all authors read and approved the final version of the paper. All authors confirm that the content has not been published elsewhere and does not duplicate their published work.
Supplementary Material
Symbols used for pathway analysis. The file is provided by Bioinformatics Center, Shanghai Institutes for Biological Sciences, Chinese Academy of Sciences, which decodes all the symbols used for pathway analysis in Fig. 4
Contributor Information
Hongcui Cao, Email: caohc70@yahoo.com.cn.
Jiong Yu, Email: yujiong@yahoo.cn.
Wei Xu, Email: zjuxw@yahoo.cn.
Xiaofei Jia, Email: jiaxiaofei514@163.com.
Jinfeng Yang, Email: jinfengjinfengyang@163.com.
Qiaoling Pan, Email: zjlspql@126.com.
Qiyi Zhang, Email: drqyzhang@163.com.
Guoping Sheng, Email: guoping.sheng@yahoo.com.cn.
Jun Li, Email: lijun918@gmail.com.
Xiaoping Pan, Email: panxiaoping001@126.com.
Yingjie Wang, Email: yingjiewang@zju.edu.cn.
Lanjuan Li, Email: ljli@zju.edu.cn.
Acknowledgements
We would like to thank the group of Bioinformatics Center, Shanghai Institutes for Biological Sciences, Chinese Academy of Sciences for their help on pathway analysis. Dr. Da Yu is gratefully acknowledged for his excellent technical help on the animal models.
This work was financially supported by the Chinese High Tech Research & Development (863) Program (No.: 2006AA02A108), Zhejiang Health Science Foundation, and Zhejiang Health Science Project for Young Scientists Fund (No.: 2007QN005).
References
- Fausto N. Liver regeneration. J Hepatol. 2000;32:19–31. doi: 10.1016/S0168-8278(00)80412-2. [DOI] [PubMed] [Google Scholar]
- Mitchell C, Nivison M, Jackson LF, Fox R, Lee DC, Campbell JS, Fausto N. Heparin-binding epidermal growth factor-like growth factor links hepatocyte priming with cell cycle progression during liver regeneration. J Biol Chem. 2005;280:2562–2568. doi: 10.1074/jbc.M412372200. [DOI] [PubMed] [Google Scholar]
- Koniaris LG, McKillop IH, Schwartz SI, Zimmers TA. Liver regeneration. J Am Coll Surg. 2003;197:634–659. doi: 10.1016/S1072-7515(03)00374-0. [DOI] [PubMed] [Google Scholar]
- Kubota K, Makuuchi M, Kusaka K, Kobayashi T, Miki K, Hasegawa K, Harihara Y, Takayama T. Measurement of liver volume and hepatic functional reserve as a guide to decision-making in resectional surgery for hepatic tumors. Hepatology. 1997;26:1176–1181. doi: 10.1053/jhep.1997.v26.pm0009362359. [DOI] [PubMed] [Google Scholar]
- Azoulay D, Castaing D, Adam R, Savier E, Delvart V, Karam V, Ming BY, Dannaoui M, Krissat J, Bismuth H. Split-liver transplantation for two adult recipients: feasibility and long-term outcomes. Ann Surg. 2001;233:565–574. doi: 10.1097/00000658-200104000-00013. [DOI] [PMC free article] [PubMed] [Google Scholar]
- Taub R. Liver regeneration: from myth to mechanism. Nat Rev Mol Cell Biol. 2004;5:836–847. doi: 10.1038/nrm1489. [DOI] [PubMed] [Google Scholar]
- Clavien PA, Petrowsky H, DeOliveira ML, Graf R. Strategies for safer liver surgery and partial liver transplantation. N Engl J Med. 2007;356:1545–1559. doi: 10.1056/NEJMra065156. [DOI] [PubMed] [Google Scholar]
- McCormack L, Petrowsky H, Jochum W, Furrer K, Clavien PA. Hepatic steatosis is a risk factor for postoperative complications after major hepatectomy: a matched case-control study. Ann Surg. 2007;245:923–930. doi: 10.1097/01.sla.0000251747.80025.b7. [DOI] [PMC free article] [PubMed] [Google Scholar]
- Clavien PA, Selzner M, Rudiger HA, Graf R, Kadry Z, Rousson V, Jochum W. A prospective randomized study in 100 consecutive patients undergoing major liver resection with versus without ischemic preconditioning. Ann Surg. 2003;238:843–850. doi: 10.1097/01.sla.0000098620.27623.7d. discussion 851-842. [DOI] [PMC free article] [PubMed] [Google Scholar]
- Rayya F, Harms J, Bartels M, Uhlmann D, Hauss J, Fangmann J. Results of resection and transplantation for hepatocellular carcinoma in cirrhosis and noncirrhosis. Transplant Proc. 2008;40:933–935. doi: 10.1016/j.transproceed.2008.03.045. [DOI] [PubMed] [Google Scholar]
- Wang WL, Tang XF, Yao MY, Liang TB, Jin J, Jiang ZJ, Zheng SS. Safety and efficiency of left hemihepatectomy combined with hepatic artery resection for hilar cholangiocarcinoma with artery infiltration: report of 2 cases. Can J Surg. 2008;51:305–307. [PMC free article] [PubMed] [Google Scholar]
- Haglund UH, Noren A, Urdzik J, Duraj FF. Right hemihepatectomy. J Gastrointest Surg. 2008;12:1283–1287. doi: 10.1007/s11605-008-0493-z. [DOI] [PubMed] [Google Scholar]
- Hasegawa K, Kokudo N, Makuuchi M. Surgical management of hepatocellular carcinoma. Liver resection and liver transplantation. Saudi Med J. 2007;28:1171–1179. [PubMed] [Google Scholar]
- Pahlavan PS, Feldmann RE Jr, Zavos C, Kountouras J. Prometheus' challenge: molecular, cellular and systemic aspects of liver regeneration. J Surg Res. 2006;134:238–251. doi: 10.1016/j.jss.2005.12.011. [DOI] [PubMed] [Google Scholar]
- Yamaguchi M. Role of regucalcin in maintaining cell homeostasis and function (review) Int J Mol Med. 2005;15:371–389. [PubMed] [Google Scholar]
- Yamaguchi M, Kanayama Y. Enhanced expression of calcium-binding protein regucalcin mRNA in regenerating rat liver. J Cell Biochem. 1995;57:185–190. doi: 10.1002/jcb.240570203. [DOI] [PubMed] [Google Scholar]
- Deng X, Li W, Chen N, Sun Y, Wei H, Jiang Y, He F. Exploring the priming mechanism of liver regeneration: proteins and protein complexes. Proteomics. 2009;9:2202–2216. doi: 10.1002/pmic.200800648. [DOI] [PubMed] [Google Scholar]
- Michalopoulos GK, DeFrances MC. Liver regeneration. Science. 1997;276:60–66. doi: 10.1126/science.276.5309.60. [DOI] [PubMed] [Google Scholar]
- Palmes D, Spiegel HU. Animal models of liver regeneration. Biomaterials. 2004;25:1601–1611. doi: 10.1016/S0142-9612(03)00508-8. [DOI] [PubMed] [Google Scholar]
- Roos F, Ryan AM, Chamow SM, Bennett GL, Schwall RH. Induction of liver growth in normal mice by infusion of hepatocyte growth factor/scatter factor. Am J Physiol. 1995;268:G380–386. doi: 10.1152/ajpgi.1995.268.2.G380. [DOI] [PubMed] [Google Scholar]
- Taub R. Liver regeneration 4: transcriptional control of liver regeneration. Faseb J. 1996;10:413–427. [PubMed] [Google Scholar]
- Webber EM, Bruix J, Pierce RH, Fausto N. Tumor necrosis factor primes hepatocytes for DNA replication in the rat. Hepatology. 1998;28:1226–1234. doi: 10.1002/hep.510280509. [DOI] [PubMed] [Google Scholar]
- Liao Y, Shikapwashya ON, Shteyer E, Dieckgraefe BK, Hruz PW, Rudnick DA. Delayed hepatocellular mitotic progression and impaired liver regeneration in early growth response-1-deficient mice. J Biol Chem. 2004;279:43107–43116. doi: 10.1074/jbc.M407969200. [DOI] [PubMed] [Google Scholar]
- Lesurtel M, Graf R, Aleil B, Walther DJ, Tian Y, Jochum W, Gachet C, Bader M, Clavien PA. Platelet-derived serotonin mediates liver regeneration. Science. 2006;312:104–107. doi: 10.1126/science.1123842. [DOI] [PubMed] [Google Scholar]
- Arai M, Yokosuka O, Chiba T, Imazeki F, Kato M, Hashida J, Ueda Y, Sugano S, Hashimoto K, Saisho H, Takiguchi M, Seki N. Gene expression profiling reveals the mechanism and pathophysiology of mouse liver regeneration. J Biol Chem. 2003;278:29813–29818. doi: 10.1074/jbc.M212648200. [DOI] [PubMed] [Google Scholar]
- Locker J, Tian J, Carver R, Concas D, Cossu C, Ledda-Columbano GM, Columbano A. A common set of immediate-early response genes in liver regeneration and hyperplasia. Hepatology. 2003;38:314–325. doi: 10.1053/jhep.2003.50299. [DOI] [PubMed] [Google Scholar]
- Fukuhara Y, Hirasawa A, Li XK, Kawasaki M, Fujino M, Funeshima N, Katsuma S, Shiojima S, Yamada M, Okuyama T, Suzuki S, Tsujimoto G. Gene expression profile in the regenerating rat liver after partial hepatectomy. J Hepatol. 2003;38:784–792. doi: 10.1016/S0168-8278(03)00077-1. [DOI] [PubMed] [Google Scholar]
- Strey CW, Winters MS, Markiewski MM, Lambris JD. Partial hepatectomy induced liver proteome changes in mice. Proteomics. 2005;5:318–325. doi: 10.1002/pmic.200400913. [DOI] [PubMed] [Google Scholar]
- Sun Y, Deng X, Li W, Yan Y, Wei H, Jiang Y, He F. Liver proteome analysis of adaptive response in rat immediately after partial hepatectomy. Proteomics. 2007;7:4398–4407. doi: 10.1002/pmic.200600913. [DOI] [PubMed] [Google Scholar]
- Hsieh HC, Chen YT, Li JM, Chou TY, Chang MF, Huang SC, Tseng TL, Liu CC, Chen SF. Protein profilings in mouse liver regeneration after partial hepatectomy using iTRAQ technology. J Proteome Res. 2009;8:1004–1013. doi: 10.1021/pr800696m. [DOI] [PubMed] [Google Scholar]
- Yamanaka N, Okamoto E, Kawamura E, Kato T, Oriyama T, Fujimoto J, Furukawa K, Tanaka T, Tomoda F, Tanaka W. Dynamics of normal and injured human liver regeneration after hepatectomy as assessed on the basis of computed tomography and liver function. Hepatology. 1993;18:79–85. doi: 10.1002/hep.1840180114. [DOI] [PubMed] [Google Scholar]
- Hempel J, Kaiser R, Jornvall H. Mitochondrial aldehyde dehydrogenase from human liver. Primary structure, differences in relation to the cytosolic enzyme, and functional correlations. Eur J Biochem. 1985;153:13–28. doi: 10.1111/j.1432-1033.1985.tb09260.x. [DOI] [PubMed] [Google Scholar]
- Chen CH, Budas GR, Churchill EN, Disatnik MH, Hurley TD, Mochly-Rosen D. Activation of aldehyde dehydrogenase-2 reduces ischemic damage to the heart. Science. 2008;321:1493–1495. doi: 10.1126/science.1158554. [DOI] [PMC free article] [PubMed] [Google Scholar]
- Rajaseger G, Lim CL, Wui LK, Saravanan P, Tang K, Gopalakrishnakone P, Pen-Huat YE, Lu J, Shabbir MM. A study on the differential protein profiles in liver cells of heat stress rats with and without turpentine treatment. Proteome Sci. 2009;7:1. doi: 10.1186/1477-5956-7-1. [DOI] [PMC free article] [PubMed] [Google Scholar]
- Daiber A, Oelze M, Wenzel P, Wickramanayake JM, Schuhmacher S, Jansen T, Lackner KJ, Torzewski M, Munzel T. Nitrate tolerance as a model of vascular dysfunction: roles for mitochondrial aldehyde dehydrogenase and mitochondrial oxidative stress. Pharmacol Rep. 2009;61:33–48. doi: 10.1016/s1734-1140(09)70005-2. [DOI] [PubMed] [Google Scholar]
- Arora V, Knapp DC, Smith BL, Statdfield ML, Stein DA, Reddy MT, Weller DD, Iversen PL. c-Myc antisense limits rat liver regeneration and indicates role for c-Myc in regulating cytochrome P-450 3A activity. J Pharmacol Exp Ther. 2000;292:921–928. [PubMed] [Google Scholar]
- Kaul SC, Taira K, Pereira-Smith OM, Wadhwa R. Mortalin: present and prospective. Exp Gerontol. 2002;37:1157–1164. doi: 10.1016/S0531-5565(02)00135-3. [DOI] [PubMed] [Google Scholar]
- Yaguchi T, Aida S, Kaul SC, Wadhwa R. Involvement of mortalin in cellular senescence from the perspective of its mitochondrial import, chaperone, and oxidative stress management functions. Ann N Y Acad Sci. 2007;1100:306–311. doi: 10.1196/annals.1395.032. [DOI] [PubMed] [Google Scholar]
- Hong F, Nguyen VA, Shen X, Kunos G, Gao B. Rapid activation of protein kinase B/Akt has a key role in antiapoptotic signaling during liver regeneration. Biochem Biophys Res Commun. 2000;279:974–979. doi: 10.1006/bbrc.2000.4044. [DOI] [PubMed] [Google Scholar]
- Stepniak E, Ricci R, Eferl R, Sumara G, Sumara I, Rath M, Hui L, Wagner EF. c-Jun/AP-1 controls liver regeneration by repressing p53/p21 and p38 MAPK activity. Genes Dev. 2006;20:2306–2314. doi: 10.1101/gad.390506. [DOI] [PMC free article] [PubMed] [Google Scholar]
- Chen YR, Sekine K, Nakamura K, Yanai H, Tanaka M, Miyajima A. Y-box binding protein-1 down-regulates expression of carbamoyl phosphate synthetase-I by suppressing CCAAT enhancer-binding protein-alpha function in mice. Gastroenterology. 2009;137:330–340. doi: 10.1053/j.gastro.2009.02.064. [DOI] [PubMed] [Google Scholar]
- Crouser ED, Julian MW, Huff JE, Struck J, Cook CH. Carbamoyl phosphate synthase-1: a marker of mitochondrial damage and depletion in the liver during sepsis. Crit Care Med. 2006;34:2439–2446. doi: 10.1097/01.CCM.0000230240.02216.21. [DOI] [PubMed] [Google Scholar]
- Herold S, Herkert B, Eilers M. Facilitating replication under stress: an oncogenic function of MYC? Nat Rev Cancer. 2009;9:441–444. doi: 10.1038/nrc2640. [DOI] [PubMed] [Google Scholar]
- Bertheau P, Espie M, Turpin E, Lehmann J, Plassa LF, Varna M, Janin A, de The H. TP53 status and response to chemotherapy in breast cancer. Pathobiology. 2008;75:132–139. doi: 10.1159/000123851. [DOI] [PubMed] [Google Scholar]
- Leiderman YI, Kiss S, Mukai S. Molecular genetics of RB1--the retinoblastoma gene. Semin Ophthalmol. 2007;22:247–254. doi: 10.1080/08820530701745165. [DOI] [PubMed] [Google Scholar]
- Gailly P, Jouret F, Martin D, Debaix H, Parreira KS, Nishita T, Blanchard A, Antignac C, Willnow TE, Courtoy PJ, Scheinman SJ, Christensen EI, Devuyst O. A novel renal carbonic anhydrase type III plays a role in proximal tubule dysfunction. Kidney Int. 2008;74:52–61. doi: 10.1038/sj.ki.5002794. [DOI] [PubMed] [Google Scholar]
- Nagano Y, Nagahori K, Yoshiro F, Hamaguchi Y, Ishikawa T, Ichikawa Y, Togo S, Okazaki Y, Hayashizaki Y, Shimada H. Gene expression profile analysis of regenerating liver after portal vein ligation in rats by a cDNA microarray system. Liver Int. 2004;24:253–258. doi: 10.1111/j.1478-3231.2004.0912.x. [DOI] [PubMed] [Google Scholar]
- Ferdinandusse S, Denis S, Hogenhout EM, Koster J, van Roermund CW, L IJ, Moser AB, Wanders RJ, Waterham HR. Clinical, biochemical, and mutational spectrum of peroxisomal acyl-coenzyme A oxidase deficiency. Hum Mutat. 2007;28:904–912. doi: 10.1002/humu.20535. [DOI] [PubMed] [Google Scholar]
- Wheeler MD, Smutney OM, Check JF, Rusyn I, Schulte-Hermann R, Thurman RG. Impaired Ras membrane association and activation in PPARalpha knockout mice after partial hepatectomy. Am J Physiol Gastrointest Liver Physiol. 2003;284:G302–312. doi: 10.1152/ajpgi.00175.2002. [DOI] [PubMed] [Google Scholar]
- Gray JP, Davis JW, Gopinathan L, Leas TL, Nugent CA, Heuvel JP Vanden. The ribosomal protein rpL11 associates with and inhibits the transcriptional activity of peroxisome proliferator-activated receptor-alpha. Toxicol Sci. 2006;89:535–546. doi: 10.1093/toxsci/kfj040. [DOI] [PubMed] [Google Scholar]
- Manukyan D, von Bruehl ML, Massberg S, Engelmann B. Protein disulfide isomerase as a trigger for tissue factor-dependent fibrin generation. Thromb Res. 2008;122(Suppl 1):S19–22. doi: 10.1016/S0049-3848(08)70013-6. [DOI] [PubMed] [Google Scholar]
- Zoeller JJ, Iozzo RV. Proteomic profiling of endorepellin angiostatic activity on human endothelial cells. Proteome Sci. 2008;6:7. doi: 10.1186/1477-5956-6-7. [DOI] [PMC free article] [PubMed] [Google Scholar]
- Wyrick JJ, Parra MA. The role of histone H2A and H2B post-translational modifications in transcription: a genomic perspective. Biochim Biophys Acta. 2009;1789:37–44. doi: 10.1016/j.bbagrm.2008.07.001. [DOI] [PubMed] [Google Scholar]
- Lim K, Park HC, Kim KY, Lee MS, Kweon GR, Kwak ST, Hwang BD. Regenerating liver-specific transacting factors of H2B histone gene are newly synthesized during liver regeneration. Biochem Biophys Res Commun. 1993;196:1093–1100. doi: 10.1006/bbrc.1993.2363. [DOI] [PubMed] [Google Scholar]
- Schweizer J, Bowden PE, Coulombe PA, Langbein L, Lane EB, Magin TM, Maltais L, Omary MB, Parry DA, Rogers MA, Wright MW. New consensus nomenclature for mammalian keratins. J Cell Biol. 2006;174:169–174. doi: 10.1083/jcb.200603161. [DOI] [PMC free article] [PubMed] [Google Scholar]
- Zatloukal K, Stumptner C, Fuchsbichler A, Fickert P, Lackner C, Trauner M, Denk H. The keratin cytoskeleton in liver diseases. J Pathol. 2004;204:367–376. doi: 10.1002/path.1649. [DOI] [PubMed] [Google Scholar]
- Strnad P, Stumptner C, Zatloukal K, Denk H. Intermediate filament cytoskeleton of the liver in health and disease. Histochem Cell Biol. 2008;129:735–749. doi: 10.1007/s00418-008-0431-x. [DOI] [PMC free article] [PubMed] [Google Scholar]
- Ku NO, Michie S, Resurreccion EZ, Broome RL, Omary MB. Keratin binding to 14-3-3 proteins modulates keratin filaments and hepatocyte mitotic progression. Proc Natl Acad Sci USA. 2002;99:4373–4378. doi: 10.1073/pnas.072624299. [DOI] [PMC free article] [PubMed] [Google Scholar]
- Bisgaard HC, Nagy P, Ton PT, Hu Z, Thorgeirsson SS. Modulation of keratin 14 and alpha-fetoprotein expression during hepatic oval cell proliferation and liver regeneration. J Cell Physiol. 1994;159:475–484. doi: 10.1002/jcp.1041590312. [DOI] [PubMed] [Google Scholar]
- Seiler N. Ornithine aminotransferase, a potential target for the treatment of hyperammonemias. Curr Drug Targets. 2000;1:119–153. doi: 10.2174/1389450003349254. [DOI] [PubMed] [Google Scholar]
- Crumm S, Cofan M, Juskeviciute E, Hoek JB. Adenine nucleotide changes in the remnant liver: An early signal for regeneration after partial hepatectomy. Hepatology. 2008;48:898–908. doi: 10.1002/hep.22421. [DOI] [PMC free article] [PubMed] [Google Scholar]
- Verhey KJ, Gaertig J. The tubulin code. Cell Cycle. 2007;6:2152–2160. doi: 10.4161/cc.6.17.4633. [DOI] [PubMed] [Google Scholar]
- Hundhausen C, Boesch-Saadatmandi C, Matzner N, Lang F, Blank R, Wolffram S, Blaschek W, Rimbach G. Ochratoxin a lowers mRNA levels of genes encoding for key proteins of liver cell metabolism. Cancer Genomics Proteomics. 2008;5:319–332. [PubMed] [Google Scholar]
- Matos JM, Witzmann FA, Cummings OW, Schmidt CM. A Pilot Study of Proteomic Profiles of Human Hepatocellular Carcinoma in the United States. J Surg Res. 2009;155(2):237–43. doi: 10.1016/j.jss.2008.06.008. [DOI] [PMC free article] [PubMed] [Google Scholar]
- Sun Q, Miao M, Jia X, Guo W, Wang L, Yao Z, Liu C, Jiao B. Subproteomic analysis of the mitochondrial proteins in rats 24 h after partial hepatectomy. J Cell Biochem. 2008;105:176–184. doi: 10.1002/jcb.21811. [DOI] [PubMed] [Google Scholar]
- Zhou YH, Shi D, Yuan B, Sun QJ, Jiao BH, Sun JJ, Miao MY. Mitochondrial ultrastructure & release of proteins during liver regeneration. Indian J Med Res. 2008;128:157–164. [PubMed] [Google Scholar]
- White P, Brestelli JE, Kaestner KH, Greenbaum LE. Identification of transcriptional networks during liver regeneration. J Biol Chem. 2005;280:3715–3722. doi: 10.1074/jbc.M410844200. [DOI] [PubMed] [Google Scholar]
- Pistoi S, Morello D. Liver regeneration 7. Prometheus' myth revisited: transgenic mice as a powerful tool to study liver regeneration. Faseb J. 1996;10:819–828. doi: 10.1096/fasebj.10.8.8666158. [DOI] [PubMed] [Google Scholar]
- Patel VJ, Thalassinos K, Slade SE, Connolly JB, Crombie A, Murrell JC, Scrivens JH. A comparison of labeling and label-free mass spectrometry-based proteomics approaches. J Proteome Res. 2009;8:3752–3759. doi: 10.1021/pr900080y. [DOI] [PubMed] [Google Scholar]
- Silva JC, Gorenstein MV, Li GZ, Vissers JP, Geromanos SJ. Absolute quantification of proteins by LCMSE: a virtue of parallel MS acquisition. Mol Cell Proteomics. 2006;5:144–156. doi: 10.1074/mcp.M500230-MCP200. [DOI] [PubMed] [Google Scholar]
- Lv S, Wang JH, Liu F, Gao Y, Fei R, Du SC, Wei L. Senescence marker protein 30 in acute liver failure: validation of a mass spectrometry proteomics assay. BMC Gastroenterol. 2008;8:17. doi: 10.1186/1471-230X-8-17. [DOI] [PMC free article] [PubMed] [Google Scholar]
- Birmachu W, Gleason RM, Bulbulian BJ, Riter CL, Vasilakos JP, Lipson KE, Nikolsky Y. Transcriptional networks in plasmacytoid dendritic cells stimulated with synthetic TLR 7 agonists. BMC Immunol. 2007;8:26. doi: 10.1186/1471-2172-8-26. [DOI] [PMC free article] [PubMed] [Google Scholar]
Associated Data
This section collects any data citations, data availability statements, or supplementary materials included in this article.
Supplementary Materials
Symbols used for pathway analysis. The file is provided by Bioinformatics Center, Shanghai Institutes for Biological Sciences, Chinese Academy of Sciences, which decodes all the symbols used for pathway analysis in Fig. 4