Abstract
Nitric oxide (NO) is a potent vasodilator and its homeostasis depends on interaction with RBCs. A key factor in understanding NO-RBC interactions in vascular lumen is a comprehensive analysis of product identification and quantification. In this context, administration of NO during in vitro NO-RBC interactions becomes a crucial variable. In this study, we designed a bioreactor that maintains a precise NO concentration in the headspace that diffuses to RBCs suspension to study the quantitative effect of NO concentration and hematocrit (Hct) on NO-RBC interactions. The products of NO-RBC reaction (nitrite and total nitrogen species (total NOx)) were measured by chemiluminescence assay. A mathematical model simulating NO biotransport to a single RBC was developed to 1) estimate NO-RBC reaction rate constant; 2) predict the NO concentrations in the bulk RBC suspension and at the RBC membrane for RBC membrane NO permeability (Pm) values of 0.0415–40 cm/s. Measured nitrite and total NOx concentrations increased with increase in headspace NO concentration whereas nitrite concentrations decreased with hematocrit and total NOx concentrations increased with hematocrit. This indicates that the extracellular resistance is a controlling factor for RBC uptake of NO. Modeling results showed that the effective reaction rate constant (keff) for NO-RBC interactions was 2.32 × 10⁴ – 1.08 × 10⁶ M−1 s−1. Results also predict that the membrane permeability in the range of 0.0415 – 0.4 cm/s is required to maintain physiologically relevant levels of NO at the smooth muscle cell layer. The effective reaction rate constant increased with increase in Pm and magnitude of increase was higher at 45% Hct. For all Pm values, the khb/keff ratios were lower for 45% Hct as compared to 5% Hct indicating extracellular resistance is important for RBC NO uptake. Our experimental and mathematical analyses of NO-RBC interactions indicate that both unstirred layer and RBC membrane have a significant effect on NO transport to RBCs. In addition, the membrane permeability in the range of 0.0415 – 0.4 cm/s is required to maintain sufficient NO concentrations at the smooth muscle cell layer.
Keywords: Nitric oxide, Biotransport, Mathematical Modeling, Bioreactor, Kinetic Modeling, Nitrite, Total Nitrogen Species, Red Blood Cells
Introduction
Nitric oxide (NO) plays a significant role in several physiological processes including vascular regulation, neurotransmission and immunological responses (Arnold et al., 1977; Ignarro et al., 1987; Moncada et al., 1991). A lack of NO bioavailability is implicated in several disease conditions like diabetes, hypertension, atherosclerosis, neurodegenerative disorders and renal failure (Hadi et al., 2005). In vasculature, NO homeostasis is maintained by its production by endothelial nitric oxide synthase (eNOS) in endothelial cells and its consumption in vascular lumen by red blood cells (RBCs). NO activates soluble guanylate cyclase (sGC) in smooth muscles leading to vasodilation (Arnold et al., 1977; Furchgott and Zawadzki, 1980; Palmer et al., 1987).
In microcirculation, the NO uptake by RBCs is reported to be ~ 500 to1000-fold lower than the NO uptake free hemoglobin (Hb) (Azarov et al., 2005; Carlsen and Comroe, 1958; Liu et al., 1998; Tsoukias and Popel, 2002). The lower NO uptake by RBCs is attributed to several diffusional resistances that NO has to overcome before it is consumed by RBC-Hb. A cell free layer near the vessel wall is reported to provide diffusional resistance for NO transport from the endothelium to the vascular lumen (Butler et al., 1998; Vaughn et al., 1998). NO transport to the RBCs is also affected by the diffusional resistance from the unstirred layer surrounding the RBCs (Liu et al., 1998; Liu et al., 2002; Liu et al., 2007) and the RBC membrane (Han and Liao, 2005; Huang et al., 2007; Vaughn et al., 2000); however, the extent of the individual contribution from these two resistances is a matter of debate. The majority of diffusional resistance for NO transport in the vascular lumen comes from the unstirred layer surrounding the RBCs (Liu et al., 2002) and the RBC membrane resistance is comparatively smaller at physiological Hct for RBC membrane permeability (Pm) value of 4.5 cm/s (Liu et al., 2007). On the other hand, a number of experimental and mathematical analyses (Han and Liao, 2005; Huang et al., 2007; Vaughn et al., 2000) have reported that the RBC membrane provides an intrinsic barrier for NO transport into RBCs. NO bioactivity is also preserved in vascular lumen in the form of S-nitrosohemoglobin (Stamler et al., 1997) or in the form of nitrite (Crawford et al., 2006; Doyle et al., 1981). Analysis of NO-RBC interactions is under intense investigation to understand the mechanisms of reduced uptake of NO by RBCs.
A key factor in understanding NO-RBC interactions in vascular lumen is a comprehensive analysis of product identification and quantification. In this context, administration of NO during in vitro NO-RBC interactions becomes a crucial variable. Most common NO delivery methods include 1) saturated NO solutions (Liu et al., 1998; Liu et al., 2007) and 2) NO releasing donors (Vaughn et al., 2001). These methods deliver NO in the vicinity of bolus leading excess nitrite formation (Zhang and Hogg, 2002) or homogeneously for NO donors (Kavdia and Lewis, 2003), respectively. We designed a bioreactor based on a previous system developed by Kavdia et al. (Kavdia et al., 2000), which uses gaseous NO delivery to the RBCs in suspension. Using gaseous NO delivery, precise amounts of NO concentrations can be maintained in the headspace of the bioreactor. A constant NO flux from the headspace to the RBC suspension can be achieved for longer periods, similar to in vivo endothelial flux from endothelium to the RBCs flowing in vascular lumen; hence avoiding homogeneous and localized delivery of NO.
Using the bioreactor capable of delivering gaseous NO to RBCs, we studied the effect of hematocrit and NO concentrations on NO-RBC interactions. In absence of flow of RBCs in the bioreactor, cell free layer diffusional resistance arising from the hemodynamics (Kim et al., 2006) is eliminated and only the effects of diffusional resistances from unstirred layer surrounding the RBCs and resistance from RBC membrane can be studied on NO uptake of RBCs using the bioreactor. We developed a mathematical model to simulate NO transport in a single red blood cell and studied the effect of RBC membrane permeability on a) the estimated NO concentration in the bulk of RBC suspension and at the RBC membrane for different gaseous NO concentrations and hematocrit levels, and b) the effective reaction rate constant for NO-RBC reaction (effective reaction rate constant incorporates NO-RBC reaction rate constant and the diffusional resistance for NO transport to RBCs).
Materials and Methods
Chemicals and reagents
Sodium nitrite (NaNO2), sodium nitrate (NaNO3), sodium iodide (NaI), phosphate buffered saline (PBS), sodium hydroxide, glucose, and vanadium (III) chloride (VCl3) were purchased from Sigma-Aldrich (St. Louis, MO). Glacial acetic acid and hydrochloric acid were purchased from VWR International (Suwannee, GA). Sodium nitrite and sodium nitrate standards were prepared in de-ionized water. Saturated solution of VCl3 was prepared by dissolving 0.8 g of VCl3 in 1 M HCl.
Preparation of RBCs and gaseous NO delivery
Fresh swine blood collected in heparinized tubes was centrifuged at 800 × g and 4°C to separate RBCs. Blood collection procedure were approved by the Institutional Animal Care and Use Committee (IACUC) of the University of Arkansas, Fayetteville. Plasma and buffy coat were discarded. RBCs were washed three times by re-suspending them in cold PBS buffer (10 mM PBS with 2 mg/ml glucose, pH 7.4) and centrifuging at 800 × g and 4°C. Supernatant from the third wash was analyzed in spectrophotometer (DU 800, Beckman Coulter) at 523 nm to check free Hb resulting from RBC lysis during blood separation and was found to contain negligible amounts of free Hb (<10 μM). Air equilibrated 5% and 45% RBC suspensions were prepared in cold PBS buffer (10 mM PBS with 2 mg/ml glucose, pH 7.4) and stored at 4°C. All experiments were performed within 24 hrs of blood collection.
Nitric oxide gas mixture (10% NO, balance nitrogen (N2), Matheson Tri-Gas Inc., Parsippany, NJ) was mixed with ultrahigh pure N2 using digital gas mass flow controllers (Porter Instrument Co., Hatfield, PA) to achieve desired NO gas concentrations in the headspace of the bioreactor. Different headspace NO concentrations were obtained by mixing 100% N2 (100 ml/min) with 4%, 7% and 10% NO+N2 mixture (0.4, 0.7 and 1 ml/min). Desired mixture of NO and N2 gases was vented for 15 min through the gas tubing to remove any air present in the tubing prior to introducing the gaseous mixture to the bioreactor to avoid NO auto-oxidation in the tubing. NO concentration in equilibrium with the liquid phase was calculated by multiplying NO solubility (2.53 μM/mmHg (Lange, 1967)) with the partial pressure of NO in the headspace.
Design of a bioreactor to study NO-RBC interactions
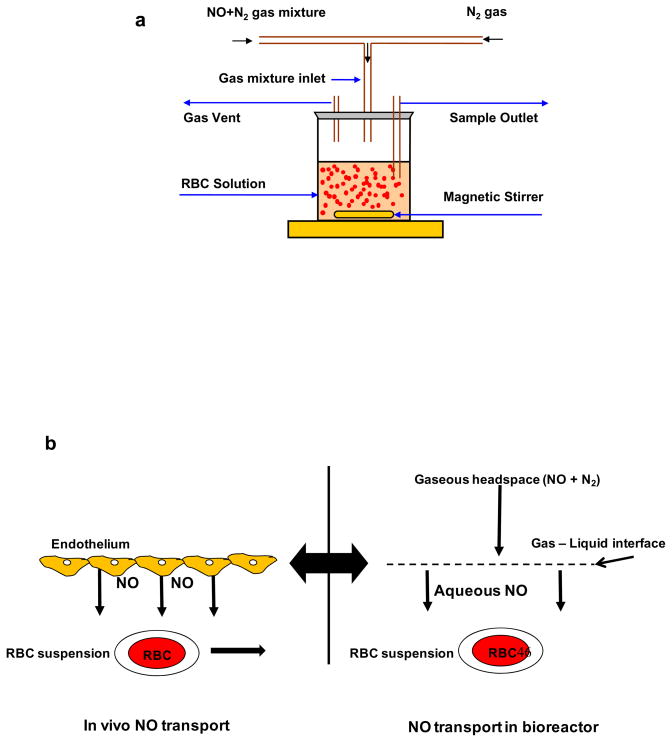
To study the NO-RBC interactions, we designed a novel stirred bioreactor with a headspace to maintain controlled NO concentrations. Fig. 1a shows the schematic diagram for the experimental set up. The cap of the reactor was modified to provide inlet and outlet for gaseous mixture of NO and nitrogen. Desired amount of gaseous mixture of NO and N2 was delivered to the bioreactor through digital mass flow controllers. RBCs were kept in suspension by stirring the suspension using magnetic stirrer at low speeds, thus preventing the RBCs from settling. A constant NO flux from the headspace to the RBC suspension can be maintained for longer periods, similar to the constant in vivo endothelial flux from endothelium to the RBCs in vascular lumen (Fig 1b). All experiments were conducted at room temperature.
Figure 1. a) Schematic diagram for bioreactor.
Gaseous NO and N2 mixture is allowed in the bioreactor headspace. NO diffuses from the headspace to the RBCs in suspension and reacts with RBC-Hb. The RBC suspension is kept stirring at low speed by a magnetic stirrer to prevent RBCs from settling. Samples are taken after the reaction through a sample port. b) NO transport to the RBCs (in vivo and in the bioreactor).
NO interactions with DI water and PBS were performed to determine whether a constant NO flux can be achieved in the bioreactor. A 10 ml volume of air equilibrated DI water was reacted for 10 min keeping NO+N2 flow rate at 0.7 ml/min and N2 flow rate of 100 ml/min. The liquid surface area of exposed to gaseous phase was 20 cm2 and the depth of the liquid in the bioreactor was 5 mm. Samples were collected every 2 min (sample volume of 500 μl) and analyzed for nitrite formation using chemiluminescence assay (described later). Next, 10 ml of air equilibrated PBS was reacted for 30 min keeping NO+N2 flow rate at 0.7 ml/min and N2 flow rate at 100 ml/min and samples were collected every 5 min (sample volume of 100 μl). Nitrite formation was measured using chemiluminescence assay.
A 10 ml of air equilibrated 5%RBC suspension was reacted with 0.7 ml/min of NO+N2 mixture for 10 min and samples were collected at 2 min interval and analyzed for nitrite and total nitrogen species formation (total NOx) using chemiluminescence assay. To study the effect of NO concentrations, experiments were conducted with 10 ml of 5% Hct with three different NO+N2 flow rates (0.4, 0.7 and 1 ml/min) for 10 min. The samples were collected at the end of 10 min and analyzed for nitrite and total NOx formation. To study the effect of hematocrit on NO-RBC interactions experiments were conducted for 5% and 45% Hct keeping the equilibrium NO concentration at 1.33 μM. The samples were collected at the end of 10 min and analyzed for nitrite and total NOx formation using chemiluminescence assay.
Chemiluminescence assay for nitrite and total NOx detection
Samples from the experiments were analyzed for nitrite and total NOx concentrations using a chemiluminescence analyzer (Model NOA 280i, Seivers, Boulder, CO) as previously described (Marwali et al., 2007). Briefly, NO formed from reaction between the reagents in the purge vessel and the injected sample was carried by argon into the analyzer where it reacts with ozone to yield photon which is detected and amplified in the analyzer and the signal is recorded in mV. For nitrite measurements, the reagents used were 0.2 M NaI and glacial acetic acid in 1:3 ratios and the sample size was 10 μL. Samples were injected using a gas tight syringe immediately after sample collection for nitrite measurement to avoid oxidation of nitrite to nitrate. For total NOx measurements, VCl3 saturated with 1 M HCl was used as a reagent and 5 μL samples were injected in the purge vessel, which was kept at 95°C. To avoid any HCl carryover, the gases exiting the purge vessel were scrubbed by 1 M NaOH in a gas bubbler. Nitrite and total NOx concentrations of the samples were calculated based on NaNO2 and NaNO3 standards.
Mathematical modeling
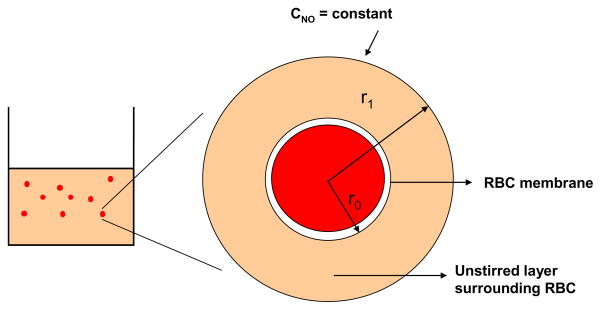
We modeled the transport of NO from the bulk of RBC suspension to the single RBC. The model geometry as shown in Fig. 2 comprised of two concentric spheres and is based on earlier spherical RBC models (Liu et al., 2002; Liu et al., 2007; Tsoukias and Popel, 2002). The mathematical equation describing NO transport to RBC and the boundary conditions are similar to those reported by Liu et al. (Liu et al., 2007). The outer sphere represents the unstirred layer surrounding RBCs and the inner sphere represents a single RBC. Since the RBCs were kept continuously stirred at low speed to keep them in suspension, a uniform concentration was assumed outside the unstirred layer thereby eliminating the extracellular diffusional resistance offered by the bulk of RBC suspension.
Figure 2. Model geometry for simulating NO biotransport to a single RBC.
The model geometry consists of two concentric spheres. The outer sphere represents the unstirred layer surrounding the RBC and the inner cylinder represents a single RBC.
Parameters used in the model are listed in Table 1. The radius of unstirred layer is determined by the hematocrit and is given by following equation.
Table 1.
Mathematical model parameters
| Parameter | Description | Value | Units |
|---|---|---|---|
| Ceq | NO Equilibrium Concentration | 0.8, 1.33 and 1.9 | μM |
| Hct | Hematocrit | 0.05 and 0.45 | % |
| DNO | NO Diffusivity | 3.33×10⁻⁵ | cm2/s |
| Pm | Membrane Permeability | 0.0415,0.4, 4.5 | cm/s |
| r0 | RBC Radius | 2.44 | μm |
| r1 | Radius of Unstirred Layer | r0/Hct1/3 | μm |
| khb | NO-Hb reaction rate constant | 3 × 10⁷ | M−1 s−1 |
| keff | NO-RBC reaction constant | To be estimated | M−1 s−1 |
| CNOm | NO concentration at the RBC membrane | To be estimated | M |
| CNOb | NO concentration in the unstirred layer surrounding RBC | To be estimated | M |
where r1 is the radius of unstirred layer surrounding the RBC, r0 is the radius of the pig RBC which ranges from 2 – 4 μm ((Eckermann et al., 2004). We used 2.44 μm as the radius of RBC. Hct is the hematocrit.
The steady state mass balance equations governing the NO transport from the bulk of RBC suspension through the unstirred layer and to the RBC core is given as follows.
| (1) |
DNO, the diffusivity of NO is 3.3 × 10⁻⁵ cm2/s (Malinski et al., 1993; Vaughn et al., 1998). RNOx represents the amount of NO entering the aqueous phase from the gaseous headspace, which indicates the amount of NO reacting with the aqueous medium in the bioreactor. RNOx is obtained by dividing the experimentally obtained total NOx formation by the time of reaction. Total NOx formation is the sum of dissolved NO, nitrite and nitrate formed during the course of the reaction. The boundary conditions used to solve the mass balance equation (Eq. 1) are given as follows.
| (2) |
| (3) |
CNOm is the steady state NO concentration at the RBC membrane. The mass balance equation was solved analytically to obtain the NO concentration profile across the geometry of model. Eq. 1 is solved analytically using the boundary conditions given in Eq. 2 and 3 and the solution given below is similar to that reported in Liu et al. (Liu et al., 2007).
| (4) |
NO concentration at the membrane is obtained by equating the NO fluxes across the RBC membrane and calculated by using following equation.
| (5) |
CNOm is the steady state NO concentration at the RBC membrane and Pm is the NO permeability of RBC membrane. Solution of Eq. 5 leads to:
| (6) |
The steady state NO concentration in the bulk of the solution (CNOb) was obtained by substituting Eq. (5) in Eq (4) at r = r1 and is given below.
| (7) |
The effect of NO permeability of RBC membrane on CNOb and CNOm was analyzed for different values of Pm. The Pm values ranged from 0.0415 – 40 cm/s and were obtained from the literature (Liu et al., 2007; Tsoukias and Popel, 2002; Vaughn et al., 2001). By using the estimated bulk NO concentrations, effective reaction rate constants for NO-RBC reaction were calculated. Using the calculated effective reaction rate constant for NO-RBC reaction, we obtained the ratios of NO-Hb reaction rate constant and NO-RBC reaction constant. The value of NO-Hb reaction rate constant used was 3 × 10⁷ M−1 s−1(Eich et al., 1996).
Statistical methods
Each experiment was repeated three times unless noted otherwise. The data are represented in the form of mean ± standard deviation.
Results
Characterization of the bioreactor
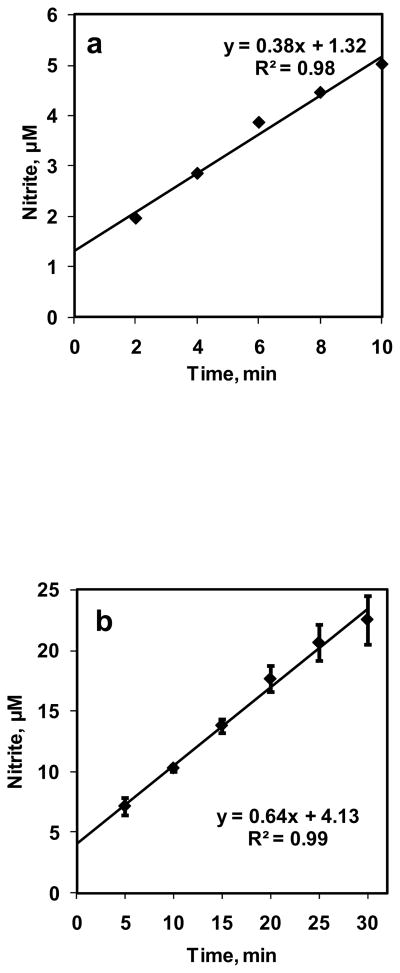
A 10 ml volume of DI water was reacted with NO+N2 flowing in the bioreactor with a flow rate of 0.7 ml/min for 10 min. NO concentration in equilibrium with the aqueous phase (CNOeq) was 1.33 μM. Samples (volume 500 μl) were collected at 2 min intervals and measured for nitrite formation using chemiluminescence assay. Nitrite formations are plotted with respect to time in Fig. 3a. The nitrite formations increased linearly with time. Rate of NO entering the aqueous phase was calculated from nitrite formed divided by time of reaction. The rate of NO entering the aqueous phase was constant at 11.3 ± 3.14 nM/s for all time points. Next, we performed longer term experiments. NO was reacted with 10 mM PBS for 30 min and samples (volume 100 μl) were collected every 5 min The nitrite formation for NO-PBS reaction is plotted in Fig. 3b as function of time. The nitrite formation increased linearly over 30 min period and rate of NO entering the aqueous phase was 16.2 ± 4 nM/s. This shows that a constant NO flux was achieved from gaseous headspace to the DI water and PBS in the bioreactor.
Figure 3. Characterization of bioreactor.
a) NO–DI water reaction was carried out for 10 min. at equilibrium NO concentration of 1.33 μM. Samples are collected every 2 min and measured for nitrite formation (n = 1); b) NO–PBS reaction was carried out for 30 min and NO equilibrium concentration was kept at 1.33 μM. Samples were collected every 5 min and measured for nitrite formation (n = 3).
For 30 min experiments, the temperature of the aqueous media before and after the experiments was 22.3°C and 23.2°C indicating that the gas flows did not cause cooling of the liquid media in the bioreactor. The reaction rate constant can be extrapolated to normal body temperature by using a temperature coefficient of 1.4 per 10°C (Tsoukias and Popel, 2002).
NO-RBC interactions over 10 min period
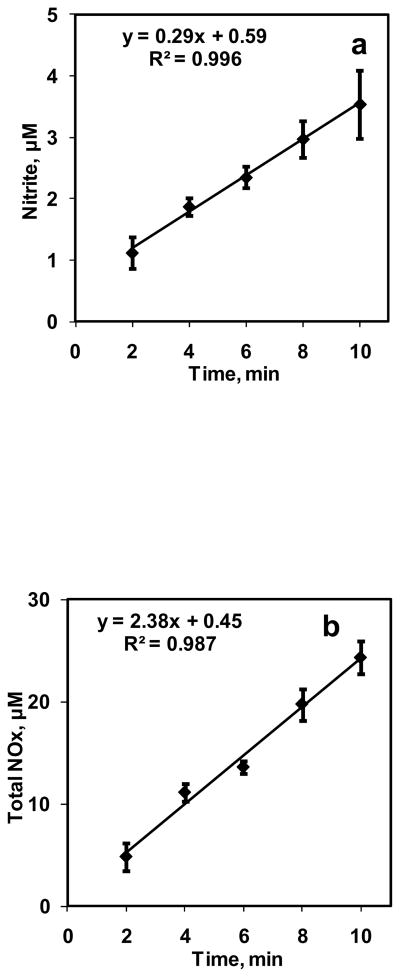
A 10 ml suspension containing 5% Hct was reacted with 0.7 ml/min of NO+N2 gas mixture (CNOeq = 1.33 μM) in the bioreactor for 10 min. The NO:Hb ratio obtained in these experiments was 1:760. Samples were collected at 2 min intervals and analyzed for nitrite and total NOx in the chemiluminescence analyzer. Experiments were repeated three times and the nitrite and total NOx formations with respect to time are plotted in Fig. 4a and 4b respectively. The nitrite and total NOx formation increased linearly with time. Rate of NO entering the aqueous phase from gaseous phase was calculated from total NOx divided by time of reaction and was constant at 41.1 ± 3.14 nM/s.
Figure 4. Effect of time on NO-RBC interaction.
a) Nitrite formation over 10 min for 5% Hct at equilibrium NO concentration of 1.33 μM (n=3); b) Total NOx formation over 10 min for 5% Hct at equilibrium NO concentration of 1.33 μM (n=3).
Effect of NO concentrations on NO-RBC interactions
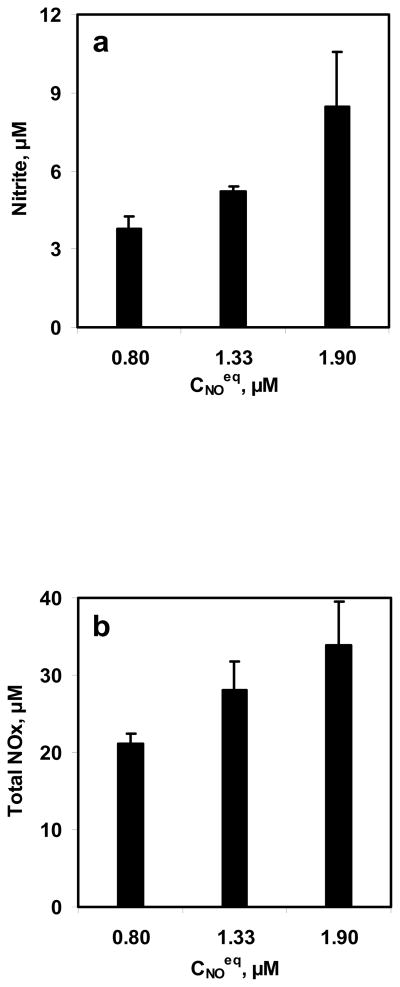
To study the effect of NO concentrations on NO-RBC interactions, three equilibrium NO concentrations were reacted with 10 ml RBC suspension for 10 min. The equilibrium NO concentrations used for these experiments were 0.8, 1.33, and 1.9 μM while the hematocrit used was 5%. The range of NO:Hb ratios obtained in this study was 1:530 to 1:1260. Samples were collected at the end of 10 min and measured for nitrite and total NOx formations. The nitrite and total NOx formation are plotted with respect to the NO equilibrium concentrations in Fig. 5a and 5b, respectively. Nitrite and total NOx concentrations increased with equilibrium NO concentrations.
Figure 5. Effect of NO concentrations on NO-RBC interaction.
a) Nitrite formation at the end of 10 min; b) Total NOx formation at the end of 10 min. The hematocrit used was 5% and the equilibrium NO concentrations used were 0.8, 1.33 and 1.9 μM (n=3).
Effect of hematocrit on NO-RBC interactions
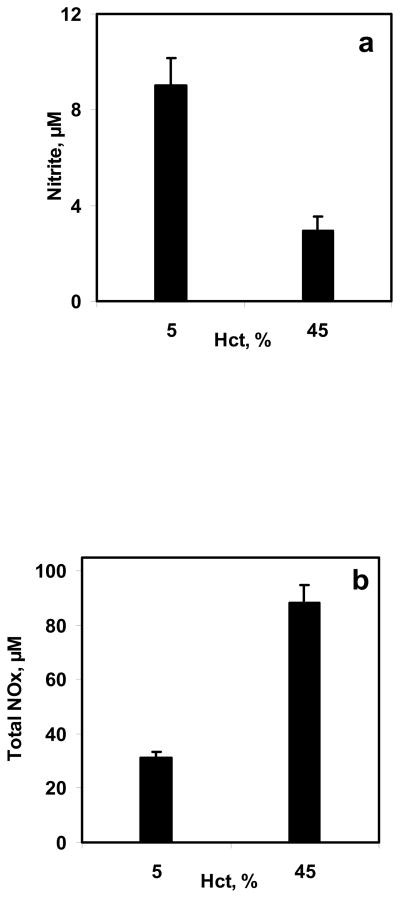
5% and 45% Hct were used in the bioreactor to study the effect of hematocrit on NO-RBC interactions. Equilibrium NO concentration used was 1.33 μM for both hematocrits. The NO:Hb ratios achieved were 1:760 and 1:6860 for 5% and 45% Hct, respectively. Samples collected at the end of 10 min were analyzed for nitrite and total NOx formations. The nitrite and total NOx formation for 5% and 45% were compared and are plotted as a function of hematocrit in Fig. 6a and 6b, respectively. The nitrite formations decreased with hematocrit indicating that at higher hematocrit, the NO-RBC-Hb reaction is more dominant than that of NO auto-oxidation reaction. The total NOx formations increased with hematocrit.
Figure 6. Effect of hematocrit on NO-RBC interaction.
a) Nitrite formation at the end of 10 min; b) Total NOx formation at the end of 10 min. The hematocrit used were 5% and 45% and the equilibrium NO concentration was kept at 1.33 μM (n=3).
Estimation of membrane NO concentration, bulk NO concentration and effective reaction rate constant for NO-RBC reaction
Steady state NO concentrations at the membrane of RBCs (CNOm) and NO concentration in the bulk of the suspention surrounding the RBCs (CNOb) were estimated using equations 3 and 4 respectively. To see the effect of NO permeability of RBC membrane on NO transport into the RBCs, we repeated the simulations for different values of RBC membrane permeability (0.0415, 0.4, 4.5 and 40 cm/s).
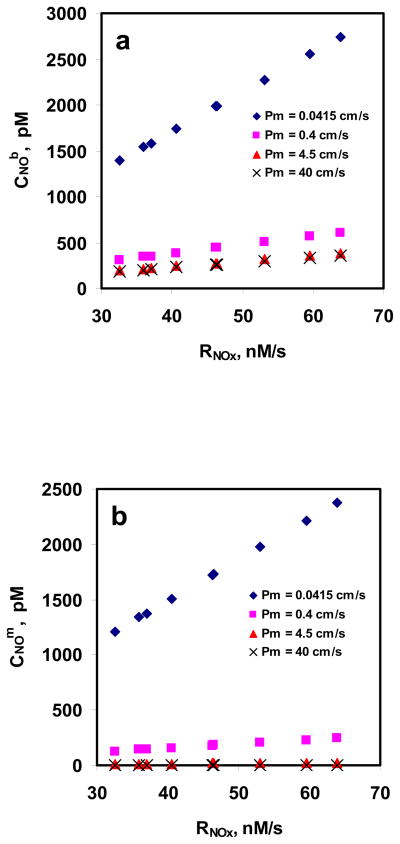
Fig. 7a and 7b show the CNOm and CNOb as a function of rate of NO entering RBC suspension (RNOx: based on experimentally obtained values of total NOx formation), respectively, for different RBC membrane permeability values for 5%. For a given Pm, CNOm and CNOb increased as RNOx increased indicating that NO uptake by RBCs is diffusion limited and the diffusional resistance is offered by the unstirred layer. Both CNOm and CNOb decreased for a given RNOx when the Pm was increased indicating that the RBC membrane provides resistance to NO uptake by RBCs; however, the reduction was more significant for lower Pm values (0.0415 and 0.4 cm/s) as compared with the higher Pm values (4.5 and 40 cm/s).
Figure 7. Estimation of CNOm and CNOb using mathematical model.
a) NO concentrations at the membrane of RBC; and b) NO concentrations in the unstirred layer surrounding the RBC are plotted as a function of NO flux based on total NOx formations at different equilibrium NO concentration. The permeability values used were 0.0415, 0.4, 4.5 and 40 cm/s.
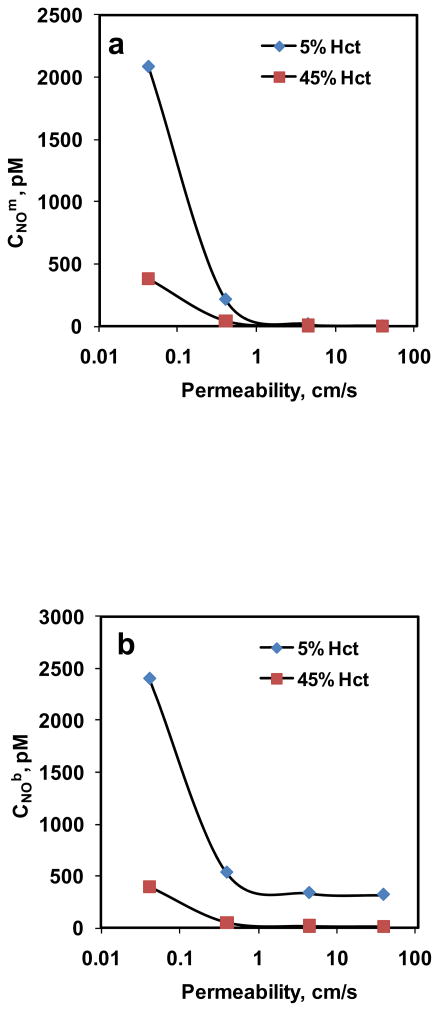
The steady state CNOm and CNOb for 5% and 45% Hct are plotted as function of RBC membrane permeability in Fig. 8a and 8b, respectively. The equilibrium NO concentration used was 1.33 μM. For all the Pm values, CNOm and CNOb were lower for higher hematocrit than that of lower hematocrit. As Pm increased, both CNOm and CNOb decreased which is consistent with our observations in the previous simulations; however, the decrease was not significant for Pm > 1 cm/s for both hematocrits.
Figure 8. Estimation of CNOm and CNOb using mathematical model.
a) NO concentrations at the membrane of the RBC; and b) NO concentrations in the unstirred layer surrounding the RBC are plotted as a function of NO permeability of the membrane for 5% and 45% Hct.
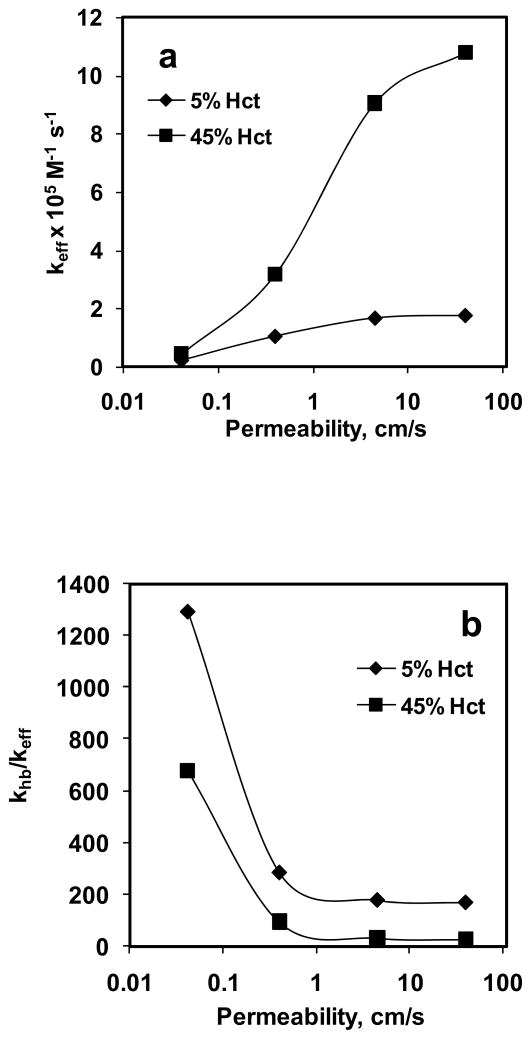
Effective reaction rate constant (keff) was calculated using rate of NO consumption based on the experimentally obtained total NOx formation and CNOb estimated from the simulation of NO biotransport to the RBC. Fig. 9a shows the effect of Pm on keff for 5% and 45% Hct. Our data indicate that for a given hematocrit, keff increased with increase in Pm. For 5% Hct, keff increased a) ~5-fold when Pm was changed from 0.0415 to 0.4 cm/s, b) ~2-fold when Pm was changed from 0.4 to 4.5 cm/s and c) did not change appreciably when Pm was changed from 4.5 to 40 cm/s. For 45% Hct, keff increased a) ~7-fold when Pm was changed from 0.0415 to 0.4 cm/s, b) ~3-fold when Pm was changed from 0.4 to 4.5 cm/s and c) ~1.2-fold when Pm was changed from 4.5 to 40 cm/s. At a given Pm value, keff was higher for 45% Hct than that of 5% Hct. For 5% Hct, keff ranged from 0.23–1.76 × 10⁵ M−1 s−1 and for 45% Hct, keff range was 0.44–10.8 × 10⁵ M−1 s−1.
Figure 9. Effect of permeability.
on a) effective reaction rate constant of NO-RBC reaction (keff) and b) the ratio of NO-Hb reaction rate constant and NO-RBC reaction rate constant (khb/keff).
Fig. 9b shows the effect of Pm on the ratio of NO-Hb reaction rate constant to NO-RBC reaction rate constant (khb/keff). The NO-Hb reaction rate constant used was 3 × 10⁷ M−1 s−1 (Eich et al., 1996) to calculate the khb/keff ratio. For a given Hct, khb/keff decreased with increase in Pm, however it did changed little at higher Pm (4.5 and 40 cm/s) for both hematocrits. As the Pm was increased from 0.0415 to 40 cm/s, the, khb/keff decreased from 1292 to 171 for 5% Hct and khb/keff decreased from 677 to 28 for 45% Hct. At a given Pm, khb/keff was higher for 5% Hct than that of 45% Hct.
Discussion
Development and characterization of a bioreactor
We designed a novel bioreactor which uses gaseous NO delivery to study in vitro NO-RBC interactions. Majority of studies involving in vitro NO-RBC interactions use either saturated NO solutions (Liu et al., 1998; Liu et al., 2007) or NO donor compounds (Vaughn et al., 2001) to deliver NO to RBCs. Saturated NO solutions can create localized NO concentrations (Han et al., 2002) and may cause excessive nitrite formations (Joshi et al., 2002) leading to artifacts in the quantification of NO-RBC interaction products. NO donor compounds deliver NO homogeneously and their release rates are not constant over longer periods (Kavdia and Lewis, 2003; Ramamurthi and Lewis, 1997). Using gaseous NO delivery, precise amounts of NO can be delivered to the RBCs. The design of our bioreactor allows for obtaining a constant NO flux from the gaseous headspace of the bioreactor to the RBC suspension similar to the constant in vivo endothelial flux to the vascular lumen. As shown in Fig. 3a and 3b, nitrite formation resulting from NO-DI water reaction and NO-PBS reaction increased linearly with time. The rate of NO entering the aqueous phase based on nitrite formation remained constant (11.3 ± 3.14 nM/s for NO-DI water reaction and 16.2 ± 4 nM/s for NO-PBS reaction) for all the time points indicating that a constant flux is obtained in the bioreactor over longer periods.
In vitro NO-RBC interactions using the bioreactor
NO consumption by RBCs is reported to be several fold lesser than that of equivalent amount of free Hb consumption of NO (Azarov et al., 2005; Liao et al., 1999; Liu et al., 1998). The reduced NO consumption by RBCs is attributed to diffusional resistance NO has to overcome to reach RBCs including cell free layer resistance near the vessel wall (Butler et al., 1998), unstirred layer resistance surrounding the RBCs (Liu et al., 1998) and the RBC membrane resistance (Vaughn et al., 2000). Assessing the impact of each of the resistance on NO uptake by RBCs individually is difficult; however, using our experimental system in combination with mathematical modeling, the effect of RBC membrane resistance and resistance from unstirred layer surrounding the RBCs can be studied. The design of bioreactor, as discussed earlier, also provides a constant NO flux to the RBCs in suspension similar to the constant in vivo endothelial flux to the RBCs in vascular lumen. A wide range of physiologically relevant NO:Hb ratios (~1:700 – 1:7000) can be obtained in the bioreactor.
Nitrite and total NOx formation increased with time linearly as shown in Fig. 4a and 4b, respectively for 5% Hct with 1.33 μM equilibrium NO concentration. Nitrite is formed from the auto-oxidation reaction and total NOx is represents the total NO consumed by RBCs suspension. The rate of NO entering the RBC suspension based on the total NOx formation was found to be constant 41 ± 3 nM/s for all the time points indicating neither NO nor RBC-Hb was depleted during the experiment.
For constant hematocrit of 5%, Nitrite and total NOx formations increased with equilibrium NO concentrations of 0.8 – 1.9 μM (Fig. 5a and 5b) indicating that as the NO concentration gradient from gas phase to the aqueous phase increased, NO availability for reaction with RBCs increased leading to higher NO consumption by RBCs. These results indicating that NO delivery to the RBCs is controlled by the unstirred layer surrounding the RBCs through diffusion.
Nitrite formations decreased with increasing hematocrit as shown in Fig 6a and 6b. In addition, nitrite formation for NO-PBS experiment was higher than that for NO –RBC reaction at both Hct after 10 min. A possible explanation for the lower nitrite formation with increasing hematocrit is described next. A constant flux of NO into the solution was established in the experiments in a short period of time (<2 min). At this point, NO will penetrate to a finite depth (characterized, for example, as the distance for a 99% drop from the surface NO value). Consequently, there will be very little NO available for forming nitrite, perhaps for a very large fraction of the sample. However, there may also be competition for the NO that is converted to nitrate and the smaller fraction of the sample volume where NO is available to react with O2 compared with the saline sample. At low hematocrit, the radius of unstirred layer surrounding the RBCs (r1 = r0/Hct1/3) would be higher than that at high hematocrit. As a result, NO has to diffuse over longer distances at low hematocrit to reach the RBC encapsulated Hb leading to lower NO consumption by RBCs. These results also indicate that there is a competition for NO consumption between oxygen and RBC encapsulated Hb.
The total NOx formation increased with hematocrit indicating that NO consumption increased at higher hematocrit. At high hematocrit, the radius of unstirred layer surrounding the RBCs would be smaller as compared to low hematocrit. Consequently, the diffusional resistance offered by the unstirred layer surrounding the RBCs would be lower; allowing more NO to diffuse into the RBCs and react with RBC encapsulated Hb leading to higher total NOx formation.
Mathematical analysis of NO-RBC interactions
A detailed mathematical analysis of NO-RBC interactions was performed to estimate the steady state NO concentration at the RBC membrane and in the unstirred layer surrounding the RBC. Rate of NO entering the aqueous phase (RNOx) used in the modeling calculations was based on the experimental values of total NOx formation representing the total NO consumed by RBCs. We analyzed the effect of equilibrium NO concentrations and hematocrit on the estimated CNOm and CNOb for different values of RBC membrane permeability to assess the impact of resistance offered by RBC membrane and the unstirred layer surrounding the RBCs on NO-RBC interactions.
We used a single cell spherical RBC model of radius 2.44 μm for pig RBC as compared to human RBC radius of 3.85 μm (Eckermann et al., 2004). The biconcave or a disk-shaped RBC model may be more accurate. However, using experimental data of Carlsen and Comroe (Carlsen and Comroe, 1958), Liu et al. (Liu et al., 1998) reported that change of RBC shape from discoid to a sphere do not affect the NO uptake by RBCs. In addition, Vaughn et al. (Vaughn et al., 2001) reported that the estimations of optimal values of parameters such as permeability and reaction rate constant are insensitive to the geometry of the RBC whether sphere or a rectangular plate (which approximate the discoidal geometry of RBCs).
Fig. 7a and 7b show the effect of RNOx on CNOm and CNOb at different Pm values for 5%Hct. Both CNOm and CNOb increased with rate of NO entering the RBC suspension (based on the total NOx formation) indicating that diffusional resistance offered by unstirred layer surrounding the RBCs plays a significant role in NO transport into the RBCs. As Pm was increased from 0.0415 to 40 cm/s, the percentage of CNOm to CNOb decreased from ~86% to < 1% for all RNOx values which can be explained by the fact that increasing permeability would allow more NO to enter the RBCs to be consumed by RBC bound Hb and thereby reducing the steady state CNOm to CNOb.
In our next simulation, we estimated the CNOm and CNOb for 5% and 45% Hct keeping the equilibrium NO concentration at 1.33 μM. As shown in Fig. 8a and 8b, respectively, the CNOm and CNOb were higher for low hematocrit than that of high hematocrit for all Pm values. At lower hematocrit, NO consumption at a given Pm value would be lower as Hb concentration is lower compared to higher hematocrit, leading to higher steady state CNOm and CNOb. As Pm was increased from 0.0415 to 40 cm/s, the percentage of CNOm to CNOb decreased from a) ~86% to < 1% for 5% Hct and b) ~95% to ~2% for 45% Hct. For both hematocrit, CNOm and CNOb decreased as Pm increased. As the NO permeability increased, the resistance offered by the RBC membrane decreased, thereby allowing more NO transfer to the RBCs to react with Hb and thus reducing the steady state CNOm and CNOb. However, for Pm >1 cm/s, CNOm and CNOb did not vary significantly with Pm for both hematocrit. A possible explanation could be that for Pm > 1 cm/s, the membrane is no longer a significant resistance barrier for NO. In that case, the steady state NO concentrations (CNOm and CNOb) would be solely dependent on the extracellular diffusional resistance from unstirred layer surrounding the RBCs and the hematocrit. Since the equilibrium NO concentration is fixed in our study, for a given hematocrit, the diffusional gradient would not change leading to less significant decrease in CNOm and CNOb for Pm > 1 cm/s.
Data from Fig. 9a indicate that NO permeability of RBC membrane affects the keff for NO-RBC reaction, however, for both 5% and 45% RBCs, for Pm values of 4.5 and 40 cm/s the effect on keff is less pronounced than that at lower permeability values (0.0415 and 0.4 cm/s). For the physiological hematocrit of 45%, we obtained a reaction rate constant of 3.17 × 10⁵ M−1 s−1 at Pm = 0.4 cm/s which is comparable with that reported in previous modeling and experimental studies (Carlsen and Comroe, 1958; Kavdia et al., 2002; Liu et al., 1998; Tsoukias and Popel, 2002). Fig. 9a shows that as Pm increased, the NO-RBC reaction rate constant increased which would lead to lesser NO bioavailability at the smooth muscle cell layer indicating that a low Pm value (0.0415–0.4 cm/s range) is required to maintain physiologically relevant NO concentrations at smooth muscle cell to perform vasodilation.
A recent experimental and mathematical analysis by Liu et al. (Liu et al., 2007) reported that at 45% Hct and Pm = 4.5 cm/s, the effect of resistance from the RBC membrane was considerably smaller than that of the resistance from unstirred layer surrounding the RBCs based on the estimated ratio of bulk NO concentration and membrane NO concentration. However, our results indicate that at Pm = 4.5 cm/s and 45% Hct, the effective reaction rate constant for NO-RBC interaction is approximately 6 times higher (~9 × 10⁵ M−1 s−1) than the NO-RBC reaction rate constant used in most of the NO transport models (Buerk et al., 2003; Chen et al., 2007; Chen et al., 2006; Kavdia, 2006; Kavdia and Popel, 2006; Kavdia et al., 2002; Lamkin-Kennard et al., 2004; Tsoukias and Popel, 2002), which would lead to approximately 6 times lower NO availability at the smooth muscle cell layer. Our results strongly suggest that 1) permeability of the RBC membrane is a significant mass transport barrier for NO transport into the RBCs and 2) the membrane permeability in the range of 0.0415 – 0.4 cm/s is required to maintain physiologically relevant levels of NO at the smooth muscle cell layer (Kavdia, 2006; Kavdia and Popel, 2006; Kavdia et al., 2002).
Ratios of NO-Hb reaction rate constant to the NO-RBC reaction rate constant (khb/keff) are plotted as a function of Pm for 5% and 45% Hct in Fig. 9b. The khb/keff represents the NO consumption by RBCs relative to the NO consumption by free Hb and is an important parameter in determining the reduction in NO consumption by RBCs. The khb/keff ratios were higher for 5% Hct than that of 45% Hct for all the Pm values. A possible explanation could be that as hematocrit increases, the thickness of the unstirred layer (r1 = r0/Hct1/3) will decrease thereby decreasing the extracellular diffusional resistance by the unstirred layer. Because of reduced extracellular resistance through the unstirred layer more NO will be available for RBC consumption. This would lead to increase in the keff and reduction in the khb/keff ratio as the hematocrit is increased from 5% to 45%. Increasing the permeability for a given hematocrit would also increase the NO available for RBC consumption leading to increase in the keff and decrease in khb/keff ratio as observed in Fig. 9b. However, the khb/keff ratios did not change significantly for Pm > 1 cm/s for both hematocrits, possibly because for Pm > 1 cm/s, the membrane no longer provides a significant barrier for NO transport. As a result, only the diffusional resistance from unstirred layer surrounding the RBCs controls the NO consumption by RBC. Since the equilibrium NO concentration is held constant in our study, for a given hematocrit, NO consumption by RBCs and consequently khb/keff ratios would not change significantly for Pm > 1 cm/s. At the physiological hematocrit of 45%, we obtained a khb/keff ratio of 95 for Pm = 0.4 cm/s which are similar to 150 ± 50 value reported by Huang et al. (Huang et al., 2007) for 50% Hct under oxygenated conditions.
In summary, we developed a bioreactor which uses gaseous NO delivery to study in vitro NO-RBC interactions. Our experimental and mathematical analyses of NO-RBC interactions indicate that the unstirred layer and the RBC membrane have a significant effect on NO transport to RBCs. In addition, the membrane permeability in the range of 0.0415 – 0.4 cm/s is required to maintain sufficient NO concentrations at the smooth muscle cell layer.
Acknowledgments
We thank Dr. Rakesh Patel for helpful discussion in preparation of this manuscript. We thank Dr. Charles Maxwell for providing fresh pig blood. This study is supported by Arkansas Biosciences Institute, AHA grant 0530050N and NIH grants R01 HL084337 and R15 HL087287.
Footnotes
Publisher's Disclaimer: This is a PDF file of an unedited manuscript that has been accepted for publication. As a service to our customers we are providing this early version of the manuscript. The manuscript will undergo copyediting, typesetting, and review of the resulting proof before it is published in its final citable form. Please note that during the production process errors may be discovered which could affect the content, and all legal disclaimers that apply to the journal pertain.
References
- Arnold WP, et al. Nitric oxide activates guanylate cyclase and increases guanosine 3′:5′-cyclic monophosphate levels in various tissue preparations. Proc Natl Acad Sci U S A. 1977;74:3203–7. doi: 10.1073/pnas.74.8.3203. [DOI] [PMC free article] [PubMed] [Google Scholar]
- Azarov I, et al. Nitric oxide scavenging by red blood cells as a function of hematocrit and oxygenation. J Biol Chem. 2005 doi: 10.1074/jbc.M509045200. [DOI] [PubMed] [Google Scholar]
- Buerk DG, et al. Modeling the influence of superoxide dismutase on superoxide and nitric oxide interactions, including reversible inhibition of oxygen consumption. Free Radic Biol Med. 2003;34:1488–503. doi: 10.1016/s0891-5849(03)00178-3. [DOI] [PubMed] [Google Scholar]
- Butler AR, et al. Diffusion of nitric oxide and scavenging by blood in the vasculature. Biochim Biophys Acta. 1998;1425:168–76. doi: 10.1016/s0304-4165(98)00065-8. [DOI] [PubMed] [Google Scholar]
- Carlsen E, Comroe JH., Jr The rate of uptake of carbon monoxide and of nitric oxide by normal human erythrocytes and experimentally produced spherocytes. J Gen Physiol. 1958;42:83–107. doi: 10.1085/jgp.42.1.83. [DOI] [PMC free article] [PubMed] [Google Scholar]
- Chen X, et al. A model of NO/O2 transport in capillary-perfused tissue containing an arteriole and venule pair. Ann Biomed Eng. 2007;35:517–29. doi: 10.1007/s10439-006-9236-z. [DOI] [PubMed] [Google Scholar]
- Chen X, et al. The influence of radial RBC distribution, blood velocity profiles, and glycocalyx on coupled NO/O2 transport. J Appl Physiol. 2006;100:482–92. doi: 10.1152/japplphysiol.00633.2005. [DOI] [PubMed] [Google Scholar]
- Crawford JH, et al. Hypoxia, red blood cells, and nitrite regulate NO-dependent hypoxic vasodilation. Blood. 2006;107:566–74. doi: 10.1182/blood-2005-07-2668. [DOI] [PMC free article] [PubMed] [Google Scholar]
- Doyle MP, et al. Kinetics and mechanism of the oxidation of human deoxyhemoglobin by nitrites. J Biol Chem. 1981;256:12393–8. [PubMed] [Google Scholar]
- Eckermann JM, et al. Initial investigation of the potential of modified porcine erythrocytes for transfusion in primates. Xenotransplantation. 2004;11:18–26. doi: 10.1111/j.1399-3089.2004.00087.x. [DOI] [PubMed] [Google Scholar]
- Eich RF, et al. Mechanism of NO-induced oxidation of myoglobin and hemoglobin. Biochemistry. 1996;35:6976–83. doi: 10.1021/bi960442g. [DOI] [PubMed] [Google Scholar]
- Furchgott RF, Zawadzki JV. The obligatory role of endothelial cells in the relaxation of arterial smooth muscle by acetylcholine. Nature. 1980;288:373–6. doi: 10.1038/288373a0. [DOI] [PubMed] [Google Scholar]
- Hadi HA, et al. Endothelial dysfunction: cardiovascular risk factors, therapy, and outcome. Vasc Health Risk Manag. 2005;1:183–98. [PMC free article] [PubMed] [Google Scholar]
- Han TH, et al. Nitric oxide reaction with red blood cells and hemoglobin under heterogeneous conditions. Proc Natl Acad Sci U S A. 2002;99:7763–8. doi: 10.1073/pnas.122118299. [DOI] [PMC free article] [PubMed] [Google Scholar]
- Han TH, Liao JC. Erythrocyte nitric oxide transport reduced by a submembrane cytoskeletal barrier. Biochim Biophys Acta. 2005;1723:135–42. doi: 10.1016/j.bbagen.2005.01.013. [DOI] [PubMed] [Google Scholar]
- Huang KT, et al. Nitric oxide red blood cell membrane permeability at high and low oxygen tension. Nitric Oxide. 2007;16:209–16. doi: 10.1016/j.niox.2006.11.002. [DOI] [PMC free article] [PubMed] [Google Scholar]
- Ignarro LJ, et al. Endothelium-derived relaxing factor produced and released from artery and vein is nitric oxide. Proc Natl Acad Sci U S A. 1987;84:9265–9. doi: 10.1073/pnas.84.24.9265. [DOI] [PMC free article] [PubMed] [Google Scholar]
- Joshi MS, et al. Nitric oxide is consumed, rather than conserved, by reaction with oxyhemoglobin under physiological conditions. Proc Natl Acad Sci U S A. 2002;99:10341–6. doi: 10.1073/pnas.152149699. [DOI] [PMC free article] [PubMed] [Google Scholar]
- Kavdia M. A computational model for free radicals transport in the microcirculation. Antioxid Redox Signal. 2006;8:1103–11. doi: 10.1089/ars.2006.8.1103. [DOI] [PubMed] [Google Scholar]
- Kavdia M, Lewis RS. Nitric oxide delivery in stagnant systems via nitric oxide donors: a mathematical model. Chem Res Toxicol. 2003;16:7–14. doi: 10.1021/tx025528r. [DOI] [PubMed] [Google Scholar]
- Kavdia M, Popel AS. Venular endothelium-derived NO can affect paired arteriole: a computational model. Am J Physiol Heart Circ Physiol. 2006;290:H716–23. doi: 10.1152/ajpheart.00776.2005. [DOI] [PubMed] [Google Scholar]
- Kavdia M, et al. Nitric oxide, superoxide, and peroxynitrite effects on the insulin secretion and viability of betaTC3 cells. Ann Biomed Eng. 2000;28:102–9. doi: 10.1114/1.258. [DOI] [PubMed] [Google Scholar]
- Kavdia M, et al. Model of nitric oxide diffusion in an arteriole: impact of hemoglobin-based blood substitutes. Am J Physiol Heart Circ Physiol. 2002;282:H2245–53. doi: 10.1152/ajpheart.00972.2001. [DOI] [PubMed] [Google Scholar]
- Kim S, et al. A computer-based method for determination of the cell-free layer width in microcirculation. Microcirculation. 2006;13:199–207. doi: 10.1080/10739680600556878. [DOI] [PubMed] [Google Scholar]
- Lamkin-Kennard KA, et al. Impact of the Fahraeus effect on NO and O2 biotransport: a computer model. Microcirculation. 2004;11:337–49. doi: 10.1080/10739680490437496. [DOI] [PubMed] [Google Scholar]
- Lange NA. Lange’s Handbook of Chemistry. McGraw-Hill; New York: 1967. [Google Scholar]
- Liao JC, et al. Intravascular flow decreases erythrocyte consumption of nitric oxide. Proc Natl Acad Sci U S A. 1999;96:8757–61. doi: 10.1073/pnas.96.15.8757. [DOI] [PMC free article] [PubMed] [Google Scholar]
- Liu X, et al. Diffusion-limited reaction of free nitric oxide with erythrocytes. J Biol Chem. 1998;273:18709–13. doi: 10.1074/jbc.273.30.18709. [DOI] [PubMed] [Google Scholar]
- Liu X, et al. Nitric oxide uptake by erythrocytes is primarily limited by extracellular diffusion not membrane resistance. J Biol Chem. 2002;277:26194–9. doi: 10.1074/jbc.M201939200. [DOI] [PubMed] [Google Scholar]
- Liu X, et al. Estimation of nitric oxide concentration in blood for different rates of generation. Evidence that intravascular nitric oxide levels are too low to exert physiological effects. J Biol Chem. 2007;282:8831–6. doi: 10.1074/jbc.M611684200. [DOI] [PubMed] [Google Scholar]
- Malinski T, et al. Diffusion of nitric oxide in the aorta wall monitored in situ by porphyrinic microsensors. Biochem Biophys Res Commun. 1993;193:1076–82. doi: 10.1006/bbrc.1993.1735. [DOI] [PubMed] [Google Scholar]
- Marwali MR, et al. Modulation of ADP-induced platelet activation by aspirin and pravastatin: role of lectin-like oxidized low-density lipoprotein receptor-1, nitric oxide, oxidative stress, and inside-out integrin signaling. J Pharmacol Exp Ther. 2007;322:1324–32. doi: 10.1124/jpet.107.122853. [DOI] [PubMed] [Google Scholar]
- Moncada S, et al. Nitric oxide: physiology, pathophysiology, and pharmacology. Pharmacol Rev. 1991;43:109–42. [PubMed] [Google Scholar]
- Palmer RM, et al. Nitric oxide release accounts for the biological activity of endothelium-derived relaxing factor. Nature. 1987;327:524–6. doi: 10.1038/327524a0. [DOI] [PubMed] [Google Scholar]
- Ramamurthi A, Lewis RS. Measurement and modeling of nitric oxide release rates for nitric oxide donors. Chem Res Toxicol. 1997;10:408–13. doi: 10.1021/tx960183w. [DOI] [PubMed] [Google Scholar]
- Stamler JS, et al. Blood flow regulation by S-nitrosohemoglobin in the physiological oxygen gradient. Science. 1997;276:2034–7. doi: 10.1126/science.276.5321.2034. [DOI] [PubMed] [Google Scholar]
- Tsoukias NM, Popel AS. Erythrocyte consumption of nitric oxide in presence and absence of plasma-based hemoglobin. Am J Physiol Heart Circ Physiol. 2002;282:H2265–77. doi: 10.1152/ajpheart.01080.2001. [DOI] [PubMed] [Google Scholar]
- Vaughn MW, et al. Erythrocytes possess an intrinsic barrier to nitric oxide consumption. J Biol Chem. 2000;275:2342–8. doi: 10.1074/jbc.275.4.2342. [DOI] [PubMed] [Google Scholar]
- Vaughn MW, et al. Erythrocyte consumption of nitric oxide: competition experiment and model analysis. Nitric Oxide. 2001;5:18–31. doi: 10.1006/niox.2000.0328. [DOI] [PubMed] [Google Scholar]
- Vaughn MW, et al. Estimation of nitric oxide production and reaction rates in tissue by use of a mathematical model. Am J Physiol. 1998;274:H2163–76. doi: 10.1152/ajpheart.1998.274.6.H2163. [DOI] [PubMed] [Google Scholar]
- Zhang Y, Hogg N. Mixing artifacts from the bolus addition of nitric oxide to oxymyoglobin: implications for S-nitrosothiol formation. Free Radic Biol Med. 2002;32:1212–9. doi: 10.1016/s0891-5849(02)00829-8. [DOI] [PubMed] [Google Scholar]


