Abstract
A general approach for discovering novel catabolic metabolites from a parent biocompound was developed and validated on metabolism of γ-tocopherol in human A549 cell. Method is based on LC-MS analysis of in vitro stable isotope labeled metabolites and assumes that a parent compound and its metabolites share a common functional group that can be derivatized by well-documented reagents. In this method, two equal aliquots of extracted metabolites are separately derivatized with isotope-coded (heavy) and non-isotope-coded (light) form of derivatizing reagent, mixed at 1:1 ratio and analyzed using LC-MS. The metabolites with common functional group are then easily recognized by determination of a chromatographically co-eluted pair of isotopomers (MS doublet peaks) with similar peak intensities and mass difference corresponding to the mass difference between heavy and light form of derivatization reagent. The feasibility of this approach was demonstrated and validated by identification of products of γ-tocopherol catabolism in human A549 cell culture media using N-methyl-nicotinic acid N-hydroxysuccinimide ester (C1-NANHS) and N-methyl-d3-nicotinic acid N-hydroxysuccinimide ester (C1-d3-NANHS) derivatizing reagent. Overall four γ-tocopherol metabolites were identified including 9'-COOH, 11'-COOH, 13'-COOH and 13'-OH. In addition, the developed LC-MS method can also be used for the fast and sensitive quantitative analysis of γ-tocopherol and other forms of vitamin E related compounds.
Keywords: Group Specific Internal Standard Technology (GSIST), Metabolite discovery, LC-MS, Stable isotope labeling, Vitamin E, Carboxychromanol, Tocopherol
1. Introduction
Metabolites are important indicators of biological processes, and discovery of new metabolites and determination of their concentration levels may provide insight into disease mechanisms, metabolic pathway interaction, and metabolism and absorption process of drugs. With recent advances in analytical methodology such as the use of ultra-performance liquid chromatography-high resolution mass spectrometry (UPLC-HRMS) and with increasing number of commercially available standards the confirmation or quantification of known metabolites becomes integrated part of many analytical laboratories. On the other hand due to high complexity of biological systems initial discovery of novel endogenous metabolites still remains a challenging aspect of biology. Traditionally, discovery of new metabolites from a single parent molecule was performed by tracking radioactive tracers that are catabolized from a radioactive parent compound [1,2]. Although well accepted, this approach is difficult to apply to the studies on human subjects. Another widely used approach is in vivo stable isotope labeling. Stable isotope labels (most often 13C) are incorporated into metabolites in the metabolism process through feeding the biological reference sample with isotope labeled media, such as 13C-glucose or 13C-acetate. Metabolites are discovered and quantified through comparing the profiling of isotope labeled and non-isotope labeled samples by means of differential analytical techniques, such as MS and NMR [3,4]. While this approach can be used in more complicated metabolic systems, it is again unsuitable for living organisms. Currently, a prevailing approach in biomarker discovery is in vitro differential labeling technique, such as two-color nucleotide labeling by fluorescent probes [5,6] in transcriptomics, protein fluorescence labeling [7,8], isotope-coded affinity tag (ICAT) [9,10] and global internal standard technology (GIST) [11,12] in proteomics. Whilst protein or RNA molecules have common chemical moieties that can be universally labeled, in metabolome analyses comprehensive labeling technologies areimpossible because of the high chemical diversity of metabolites. Yet, similar applications of this technique to metabolites have also been exploited through technique called Group Specific Internal Standard Technology (GSIST) [13–17]. Similarly, isotope-coded glutathione has been utilized as trapping reagent for identification of reactive drug metabolites. The pitfall is that this reagent only works for electrophilic compounds [18].
LC-MS is currently a dominant analytical tool for metabolite quantification and identification. Recently the introduction of high mass accuracy and high resolution mass spectrometers has increased the quality of acquired data. In addition, the use of various scan modes for data acquisition including precursor ion and neutral loss scans, and advanced data-processing approaches such as mass defect filter [19] or multivariate statistical analysis [20] significantly improved metabolite detection. In order to further simplify and streamline the identification process of novel metabolites, we developed a new LC-MS approach which is based on in vitro differential stable isotope labeling. Method was evaluated and validated by determination of the intermediates of γ-tocopherol catabolism.
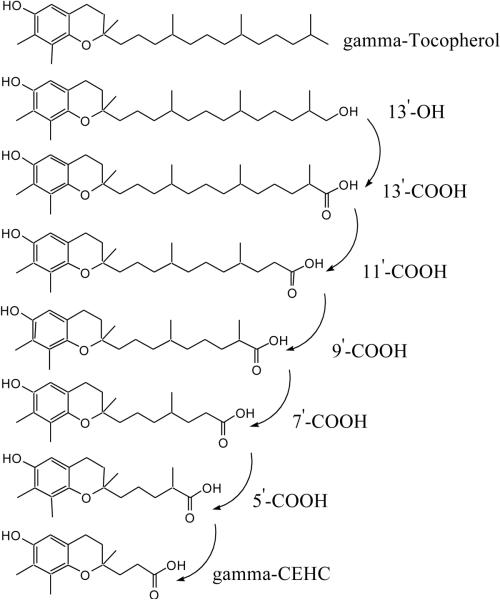
γ-tocopherol represents the most biologically relevant form of vitamin E in many diets and provides antioxidant activities through electron trapping of lipophilic electrophiles and reactive nitrogen and oxygen species [21] Plasma γ-tocopherol has been shown to be inversely associated with the risk of prostate cancer and coronary heart diseases [21]. The first metabolite of γ-tocopherol, 7,8-dimethyl-2-(β-carboxyethyl)-6-hydroxychromanol (γ-CEHC), was isolated from human urine in 1996 [22,23]. The structure of γ-CEHC suggests that it is metabolized via phytyl chain oxidation of γ-tocopherol, without oxidative modification of the chroman ring. A cytochrome P450 ω-hydroxylase pathway of γ-tocopherol catabolism was elucidated in 2002 [24,25]. The pathway involves cytochrome P450-mediated ω-hydroxylation of the tocopherol phytyl side chain followed by stepwise removal of two- or three- carbon moieties, ultimately yielding γ-CEHC, as shown in Figure 1. Recently, several novel sulfuric acid conjugates of γ-tocopherol metabolites were reported [26] and some intermediate metabolites have been shown to be potent inhibitors for cyclooxygenases [27]. The same mechanism of γ-tocopherol side-chain degradation was also reported in other cells, such as HepG2 cells [28]. However, except for γ-CEHC, all other intermediates have been readily available for use in metabolic studies and therefore they have not been further confirmed with radioactive or stable isotope-labeled forms of γ-tocopherol or by direct comparison with the authentic compounds.
Figure 1.
Metabolic pathway of γ-tocopherol.
In this work, these metabolites were validated by the proposed method without the use of radioactive or stable isotope-labeled forms of γ-tocopherol, or standard metabolites of γ-tocopherol.
2. Experimental
2.1 Chemicals and reagents
Triethylamine (TEA) and γ-tocopherol were obtained from Sigma (St. Louis, MO). HPLC grade acetonitrile and formic acid were purchased from Mallinkrodt Baker (Phillipsburg, NJ) and 7,8-dimethyl-2-(β-carboxyethyl)-6-hydroxychromanol (γ-CEHC) from Cayman Chemicals (Ann Arbor, MI). Double-deionized water was produced by a Milli-Q gradient A10 system from Millipore (Bedford, MA).
Derivatizing reagents, N-methyl-nicotinic acid N-hydroxysuccinimide ester (C1-NANHS) and N-methyl-d3-nicotinic acid N-hydroxysuccinimide ester (C1-d3-NANHS), were synthesized as described by Yang et al. [14]. Briefly, nicotinic acid was first esterificated by N-hydroxysuccinimide through the activation of dicyclohexylcarbodiimide (DCC) to form nicotinic acid N-hydroxysuccinimide ester, which was further quaternized by iodomethane or iodomethane-d3.
2.2 Cell culture for catabolism study of γ-tocopherol
The human alveolar epithelial cell line A549 was obtained from American Type Culture Collection (Manassas, VA). Cells were maintained routinely in RPMI-1640 with 10% fetal bovine serum (FBS). At the time of experiments, cells were seeded in RPMI-1640 with 10% FBS at a density of 8×10⁵ cells per well in 6-well plates. Twenty-four hours later, media were replaced with fresh DMEM containing 1% FBS with either 50 μM γ-tocopherol in dimethyl sulfoxide (DMSO; stored in −20 °C) (experimental samples) or 0.05% DMSO (control samples). After 72 hour incubation, media were collected, frozen immediately and stored in −20°C until further use. In order to improve detection and identification of γ-tocopherol related metabolites two additional control samples were generated.
The “non-cell” control samples were obtained by incubation of cell-free DMEM containing 1% FBS in 6-well plates for 72 h.
For “inhibitor” control samples, cells were incubated with DMEM containing 1% FBS, 50 μM γ-tocopherol and 0.5 μM sesamin in DMSO (stored in −20 °C) for 72h.
2.3. Sample preparation
2.3.1 SPE extraction
A 3-mL C18 SPE cartridge (VYDAC, Deerfield, IL) was preconditioned with 2 mL of elution solution (99.9% ACN + 0.1% formic acid) and 2.0 mL of washing solution (5% ACN+0.1% formic acid). Cell culture media (1 mL) was loaded into the cartridge and washed with 3 mL of the washing solution. The analytes were eluted with 2 mL of the elution solution, split into two equal aliquots, and dried under nitrogen.
2.3.2 Derivatization
Individual dried aliquotes were resuspended in 50 μL of acetonitrile containing 25 mg/mL either C1-NANHS or C1-d3-NANHS derivatizing reagent, respectively. Following an addition of 1 μl TEA the mixture was vortexed for 30 seconds, and the reaction stopped by 2 μL of formic acid. Light and heavy forms of solutions were mixed at 1:1 ratio, and directly analyzed by LC-MS.
2.4. LC-ESI-MS
LC experiments were performed with an Agilent XDB-C18 column (4.6 × 50 mm, 1.8 μm particle size) on Agilent 1100 Series LC system (Agilent Technologies, Wilmington, DE). The mobile phases were composed of (A) 5% ACN + 0.05% formic acid, and (B) 95% ACN + 0.05% formic acid in water. Separation was achieved by a 30 min linear gradient from 100% A to 100% B at a flow rate of 1.2 mL/min. Injection volume was 5 μL. System back pressure did not exceed 200 bars during the analysis.
MS analysis was carried out on Unique® LC-TOFMS with High Flow ESI Source (LECO Corporation, St. Joseph, MI). The main operation parameters for positive ESI were as follows: electrospray voltage, 4900 V; desolvation temperature, 370 °C; nebulizer pressure, 400 kPa; interface temperature, 100 °C; nozzle voltage, 230 V; skimmer voltage, 75 V; quad RF voltage, 250; quad high voltage, 76 V; quad low voltage, 32 V; quad exit voltage, 32 V; desolvation gas, 6880 mL/min.
2.5. ESI-MS/MS
Tandem MS analysis was performed on a Micromass Q-Tof micro mass spectrometer (Waters, Milford, MA). Collected fractions from LC separation (0.5 mL) were dried, reconstituted in 0.5 mL of methanol/H2O/formic acid (50%/49.9%/0.1%) and injected into the ESI source by infusion at 5.0 μL/min. Ionization was achieved with an electrospray voltage of 3 kV, cone voltage of +30 V, cone and desolvation gas flows of 5–8 and 500 L/h, respectively. The source block and desolvation temperatures were maintained at 150°C and 350°C, respectively. To obtain the most relevant MS/MS spectra, collision energy was optimized and established at 45 V.
3. Results
3.1 Strategy for novel metabolite discovery
Most of the metabolites in real biological samples are present at very low concentrations and their detection requires the use of highly sensitive methods Tocopherol metabolites contain carboxylic group (Figure 1) suggesting that maximum sensitivity would be achieved by ESI in negative mode. For revised-phase HPLC separation, small portion of organic acid is typically added in the mobile phase to maintain separation reproducibility and to extend the lifetime of a column. This additive may suppress the ionization efficiency of the acidic analytes, and significantly reduce the detection sensitivity [14]. To circumvent this obstacle, acidic metabolites can be derivatized with a quaternized derivatizing reagent, C1-NANHS, as it is illustrated in Figure 2. This derivatization reaction introduces a permanent positive charge to the analytes by which ESI efficiency and detection sensitivity are greatly increases [13]. Moreover added tag decreases hydrophobicity of derivatized compounds and consequently reduces their retention time and overall time for the analysis. It is important to note that parent molecule and its metabolites must carry the same functional group such as phenol moiety in the case γ-tocopherol catabolism. Metabolites with modified functional group cannot be derivatized and identified. In addition, products of derivatization reaction must be stable to give consistent results during LC-MS analysis.
Figure 2.
Derivatization reaction of γ-tocopherol and its metabolites.
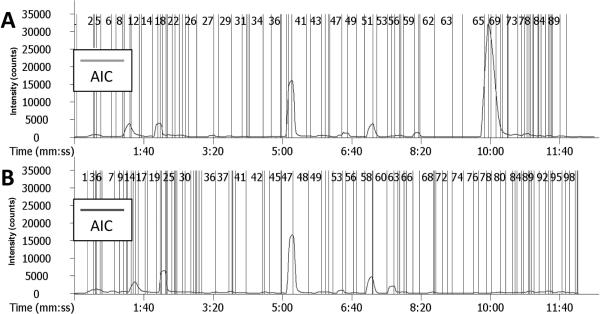
Although derivatization increases ionization efficiency of tagged molecules, a main challenge in complex samples is how to differentiate between peaks that correspond to derivatized and non-derivatized metabolites. Figure 3 shows the analytical ion chromatograms (similar to base peak chromatogram in some other MS software) of derivatized experimental (Fig. 3A) and control (Fig. 3B) samples analyzed by LECO Unique MS software (v3.1). Vertical lines in the chromatograms represent detected chromatographic peaks (even though these peaks are too small to be seen visually). Overall 90 peaks were detected in experimental and 100 peaks in control sample. Traditional way to discover metabolite candidates involved in catabolism of parent molecule is to align chromatograms corresponding to experimental and control samples using the retention time of individual chromatographic peaks and identify those that are present in the experimental sample only. This method however depends strongly on reproducibility and even small change in retention time may lead to false positive/negative identification/elimination of potential targets. An alternative approach is to reduce the complexity by recognition of peaks corresponding to tagged metabolites using stable isotope labeling strategy.
Figure 3.
Analytical ion chromatograms of (A) γ-tocopherol and (B) non-γ-tocopherol control cell culture media. The vertical lines with numbers indicate the presence of the peaks. Sample aliquots were derivatized in two separate reactions with C1-NANHSand C1-d3-NANHS, and mixed at 1:1 ratio for LC-MS analysis. Experimental conditions are described in the experimental section.
3.2 Identification of γ-tocopherol metabolites
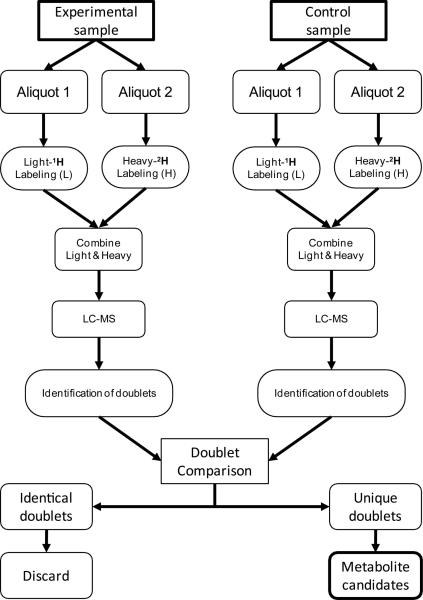
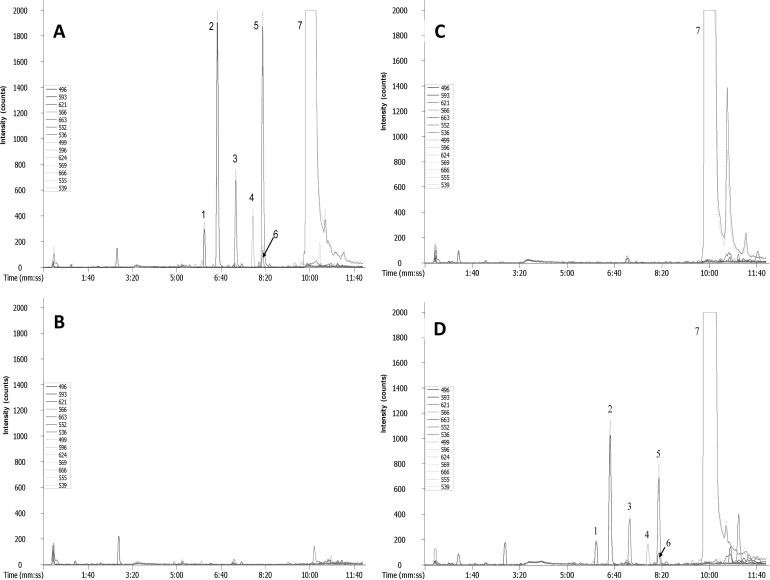
The method illustrated in Figure 4 was used to verify various metabolites from γ-tocopherol, including long-chain carboxychromanols generated in A549 cells [27]. The experimental sample was split in half and aliquots simultaneously derivatized with C1-NANHS (light form) or C1-d3-NANHS (heavy form), respectively. The resulting deuterated and non-deuterated experimental samples were mixed and analyzed by LC-MS. Chromatographic peaks were detected by LECO Unique MS software and then were examined manually for the presence of ion doublets. Because all metabolites of γ-tocopherol contain a single phenol group and equal amount of samples were derivaitzed by the reagents with mass difference of 3 amu, only doublets with similar intensities and a mass difference of 3 were selected for further analysis. The control sample was treated and analyzed in same way. The selected ion doublets from both experimental and control samples were then compared and those detected in both samples disregarded. The doublets exclusively found in the experimental sample were identified as potential metabolite of γ-tocopherol catabolism. This conclusion was based on the two facts: 1) cells for experimental and control samples were treated identically except for that the experimental cells were cultivated in the presence of γ-tocopherol, and 2) γ-tocopherol and its metabolites contain a single derivatizable functional group. This procedure assured exclusion of false positive/negative candidates by using these three additional criteria for identification; derivatization of targeted molecules, mass difference and 1:1 ratio in peak intensities between light and heavy form of the same compound. Using this screening process, 6 ions with m/z values of 496.30 (ion 1), 593.32 (ion 2), 621.33 (ion 3), 566.38 (ion 4), 663.40 (ion 5) and 552.40 (ion 6) for non-deuterated derivatization were found uniquely in the experimental sample (Fig. 5A). None of those ions was detected in the analytical ion chromatogram of the control, non-γ-tocopherol cell culture media (Fig. 5B). To rule out the possibility that these ions were from the chemical decomposition of γ-tocopherol during the cell culture process, the “non-cell” control was also analyzed. As expected γ-tocopherol was the only peak detected (Fig. 5C). Additional experiments with “inhibitor” control samples also suggested that all identified ions are metabolites of γ-tocopherol catabolism as the intensities of ion 1 to 6 decreased in the presence of sesamin (Figure 5D). Sesamin, a benzofuran lignan in sesame seed oil, is known to inhibit γ-tocopherol-ω-hydroxylase [24,25].
Figure 4.
Strategy for metabolite discovery.
Figure 5.
Extracted ion chromatograms (EIC) suggesting the presence of intermediates of γ-tocopherol catabolism in cell culture media. A: cells incubated in the media with γ-tocopherol; B: cells incubated in the media without γ-tocopherol; C: cell-free media with γ-tocopherol; D: cells incubated in the media with γ-tocopherol and catabolism inhibitor sesamin. The numbered peaks represent the ions which were found uniquely in cell culture media (except for γ-tocopherol). Dotted and solid lines represent deuterated and non-deuterated derivatives, respectively. Analytical conditions are described in the experimental section.
3.3 Structural determination of identified ions
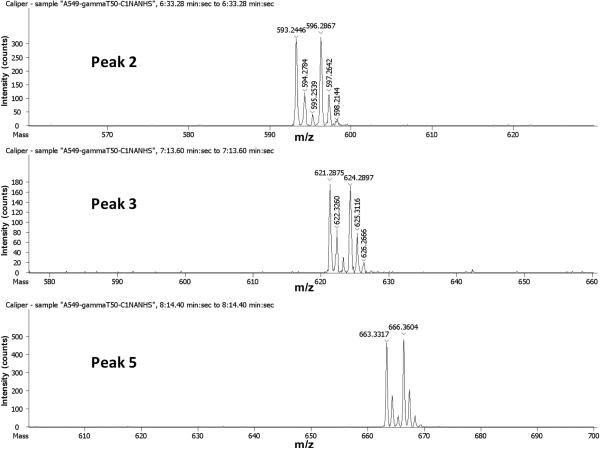
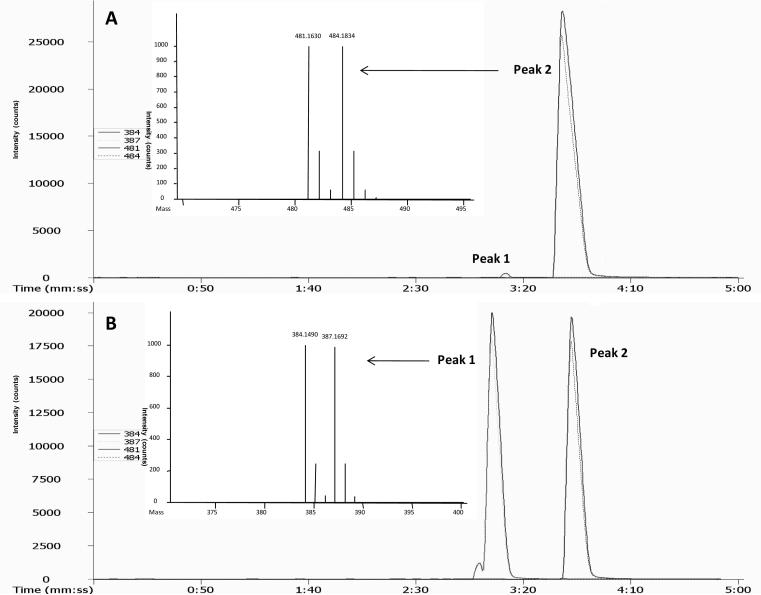
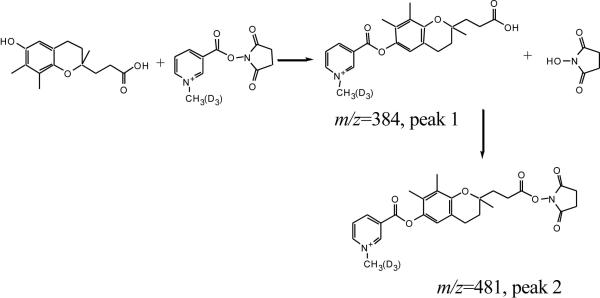
The above evidence strongly sugguests that the 6 ion candidates were from γ-tocopherol catabolism. After subtracting the mass of derivatizing tag (mass is 120.13), the ion 1 (m/z 376.17) matches the metabolite 9'-COOH, ion 4 (m/z 446.25) matches 13'-COOH, and ion 6 (m/z 432.27) matches 13'-OH. No match, however, was found for ions 2, 3, and 5 (Fig. 6). Further examination revealed that the m/z values of ion 2, 3, and 5 correspond to the derivatized 9'-COOH, 11'-COOH and 13'-COOH plus the mass addition of 97.02, respectively. This number represents the mass of N-hydroxysuccinimide (NHS) (Mr 115.09) minus H2O (Mr 18.02). NHS is a by-product of the derivatization and a reactant for synthesizing the derivatizing reagent. Therefore, we suspected that these ions might be generated from the secondary derivatization through carboxyl groups of the metabolites and NHS produced in the derivatizing process of phenol group To verify this hypothesis, a standard metabolite, γ-CEHC, was derivatized with C1-NANHS and C1-d3-NANHS and the 1:1 mixture was analyzed. As shown in Figure 7, the expected derivatized ions through phenol group (Peak 1, m/z = 384.14 and 387.17) and a major ions with extra mass of 97.02 (Peak 2, m/z = 481.16 and 484.18) appeared. In both cases, similar intensities between light and heavy form of the corresponding ions indicate that they are direct products of derivatization reaction. These results are consistent with those obtained for ion 2, 3 and 5 and suggest the chemical reaction summarized in Figure 8. Moreover, this ester is unstable under acidic conditions thus by performing the reaction overnight at room temperature a decrease of original peak 2 and significant increase of the peak 1 (expected ions) is observed (Fig 7A and B). Reaction between carboxylic group and N-hydroxysuccinamide (NHS) requires activation of carboxylic group through a coupling reagent, such as dicyclohexylcarbodiimide. In this case however no coupling reagent is present and the exact mechanism of the reaction is unclear.
Figure 6.
MS spectra corresponding to peak2, 3, and 5 in Figure 5 A. Experimental conditions are described in the experimental section.
Figure 7.
Chromatographic evidences supporting the secondary derivatization reaction. A: EIC of derivatives analyzed one minute following the derivatization; B: EIC of derivatives analyzed after overnight reaction at room temperature. Peak 1 - expected derivative; Peak 2 - secondary derivative. Experimental conditions are described in the experimental section.
Figure 8.
Derivatizing process of γ-CEHC with suggested secondary reaction.
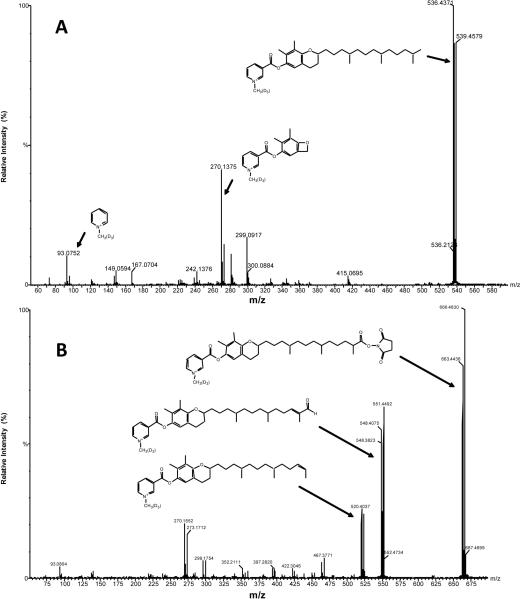
Molecular structures of derivatized γ-tocopherol and secondarily derivatized 13'-COOH (ion 5) were also confirmed by MS/MS analysis (Fig. 9). Corresponding fractions were collected during LC separation and directly analyzed using tandem mass spectrometry. The MS/MS fragments originated in precursor molecules can be easily recognized, since they contain characteristic deuterated and non-deuterated ion doublet pattern (Fig. 9). The similar fragment to ion m/z 270.1 was previously reported in EI spectra of γ-tocopherol metabolites [25]. The MS/MS spectrum of ion 5 confirmed the hypothesis of the secondary derivatization. Therefore six unique ions found in the experimental sample were identified as 4 metabolites of γ-tocopherol (Table 1).
Figure 9.
MS/MS spectra of (A) derivatized γ-tocopherol and (B) secondarily derivatized metabolite 13'-COOH. Experimental conditions are described in the experimental section.
Table 1.
Ions corresponding to metabolites of γ-tocopherol in cell culture media
| Observed m/z value of ions | Corresponding metabolite |
|---|---|
| 496.30 | 9'-COOH (mono-derivatized) |
| 593.32 | 9'-COOH (bis-derivatized) |
| 621.33 | 11'-COOH (bis-deivatized) |
| 566.38 | 13'-COOH (mono-derivatized) |
| 663.40 | 13'-COOH (bis-derivatized) |
| 552.40 | 13'-OH |
4. Discussion
The process for discovering a novel metabolite using MS is more difficult than for finding or confirming a preconceived one. In complex samples, large numbers of ions with wide dynamic range of concentrations generates many chromatographic peaks varied in peak intensities and the use of high accuracy/resolution instruments such as TOF-MS, Orbitrap-MS or FT-ICR-MS is often necessary to identify peaks that may potentially correspond to novel metabolites. Structural determination and confirmation is then achieved by Q-TOF, Q-Trap, ion trap or other instruments capable MSn analysis. Even with these mass spectrometers, it may be still difficult to give unambiguous identification for endogenous metabolites. Ultimately the best approach would be the synthesis of possible metabolites and direct comparison of the LC-MS data for the experimentally detected metabolites and synthesized compounds. This approach is however expensive, time consuming and requires much efforts to conduct the synthesis of the desired structures. On the other hand, in vitro stable isotope labeling strategy presented in this paper offers a relatively simple, three steps selection process that increases identification reliability without synthesis of expensive standards. The first selection step was based on derivatization presuming that phenol functional group in γ-tocopherol is still remaining in its catabolic metabolites. Therefore, all metabolites should be derivatized in the same way as the parent compound. The derivatization also introduced a permanent positive charge on the derivatives enhancing MS detection sensitivity for the derivatives and suppressing the ionization of other ions. The second selection step was achieved through isotope coding. This coding generated a pair of MS isotopomers, which are completely coeluted in a single LC peak, theoretically equal in peak intensities with mass difference of 3 amu between the light and heavy form. This feature provided an easy way to visually recognize derivatized compounds from MS spectra. The process of doublet recognition and search for characteristic isotope signature can be also automated using either “in house” developed software [29] or modified, commercially available programs for MS based metabolite identification. The third selection step involves direct comparison of experimental and control samples. The compounds which have passed the first two filters do not necessarily represent a metabolite of interest, since the derivatization is not absolutely group-specific. For instance, C1-NANHS used in this study for derivatization of phenol groups can also react with amines. However, through the control experiments, those deivatized compounds existing in both experimental and control samples can be eliminated.
The secondary derivatization presented an extra demonstration for the metabolite 13'-COOH, 11'-COOH and 9'-COOH. The finding for the secondary derivatization to carboxyl groups is also significant as under the normal conditions, NHS reacts with carboxyl groups only in the presence of an activating reagent. Our data, however, suggest that NHS freshly produced during a reaction process can immediately react with carboxyl group. This might provide a new way for the esterification of carboxylic acid. In the previous work, sulfuric acid conjugates of 13'-COOH, 11'-COOH and 9'-COOH through phenol groups were demonstrated in the human cell line A549 [26]. These metabolites do not have free phenol groups, and cannot be detected by described procedure.
Additionally, the LC-MS method developed here provides a fast and sensitive assay for γ-tocopherol and its metabolites. The enhancement of MS detection sensitivity and the decrease in separation time through this type of derivatization have been previously reported [13,14]. In this study, the use of a short column with small particle size packing (1.8 μm) further reduced separation time from ~50min [26] to ~10 min and increased separation efficiency.
Acknowledgement
The authors would like to thank Xinmin Yin for the work with cell culture. This work was supported by grant numbers 5R33DK070290-03 (FR and JA) and R01AT001821 (QJ) from the National Institute of Health.
Footnotes
Publisher's Disclaimer: This is a PDF file of an unedited manuscript that has been accepted for publication. As a service to our customers we are providing this early version of the manuscript. The manuscript will undergo copyediting, typesetting, and review of the resulting proof before it is published in its final citable form. Please note that during the production process errors may be discovered which could affect the content, and all legal disclaimers that apply to the journal pertain.
References
- [1].Chiku S, Hamamura K, Nakamura T. J. Lipid Res. 1984;25:40. [PubMed] [Google Scholar]
- [2].Gross CS, Milhorat AT, Simon EJ. J. Biol. Chem. 1956;221:797. [PubMed] [Google Scholar]
- [3].Birkemeyer C, Luedemann A, Wagner C, Erban A, Kopka J. Trends in Biotechnol. 2005;23:28. doi: 10.1016/j.tibtech.2004.12.001. [DOI] [PubMed] [Google Scholar]
- [4].Macedo FC, Jr, Porto ALM, Marsaioli AJ. Tetrahedron Lett. 2004;45:53. [Google Scholar]
- [5].Lockhart DJ, Dong H, Byrne MC, Follettie MT, Gallo MV, Chee MS, Mittmann M, Wang C, Kobayashi M, Horton H, Brown EL. Nature Biotechnol. 1996;14:1675. doi: 10.1038/nbt1296-1675. [DOI] [PubMed] [Google Scholar]
- [6].Schena M, Shalon D, Davis RW, Brown PO. Science. 1995;270:467. doi: 10.1126/science.270.5235.467. [DOI] [PubMed] [Google Scholar]
- [7].Unlu M, Morgan ME, Minden JS. Electrophoresis. 1997;18:2071. doi: 10.1002/elps.1150181133. [DOI] [PubMed] [Google Scholar]
- [8].Van den Bergh G, Arckens L. Curr. Opin. in Biotechnol. 2004;15:38. doi: 10.1016/j.copbio.2003.12.001. [DOI] [PubMed] [Google Scholar]
- [9].Aebersold R, Mann M. Nature. 2003;422:198. doi: 10.1038/nature01511. [DOI] [PubMed] [Google Scholar]
- [10].Gygi SP, Rist B, Gerber SA, Turecek F, Gelb MH, Aebersold R. Nature Biotechnol. 1999;17:994. doi: 10.1038/13690. [DOI] [PubMed] [Google Scholar]
- [11].Chakraborty A, Regnier FE. J. Chromatogr. A. 2002;949:173. doi: 10.1016/s0021-9673(02)00047-x. [DOI] [PubMed] [Google Scholar]
- [12].Regnier FE. Methods Mol. Biol. 2007;359:125. doi: 10.1007/978-1-59745-255-7_8. [DOI] [PubMed] [Google Scholar]
- [13].Yang WC, Adamec J, Regnier FE. Anal. Chem. 2007;79:5150. doi: 10.1021/ac070311t. [DOI] [PubMed] [Google Scholar]
- [14].Yang WC, Mirzaei H, Liu X, Regnier FE. Anal. Chem. 2006;78:4702. doi: 10.1021/ac0600510. [DOI] [PubMed] [Google Scholar]
- [15].Yang WC, Regnier FE, Adamec J. Electrophoresis. 2008;29:4549. doi: 10.1002/elps.200800156. [DOI] [PMC free article] [PubMed] [Google Scholar]
- [16].Yang WC, Regnier FE, Sliva D, Adamec J. J. Chromatogr. B. 2008;870:233. doi: 10.1016/j.jchromb.2008.06.026. [DOI] [PMC free article] [PubMed] [Google Scholar]
- [17].Yang W-C, Sedlak M, Regnier FE, Mosier N, Ho N, Adamec J. Anal. Chem. 2008;80:9508. doi: 10.1021/ac801693c. [DOI] [PubMed] [Google Scholar]
- [18].Yan Z, Caldwell GW. Anal. Chem. 2004;76:6835. doi: 10.1021/ac040159k. [DOI] [PubMed] [Google Scholar]
- [19].Plumb RS, Stumpf CL, Granger JH, Castro-Perez J, Haselden JN, Dear GJ. Rapid Commun. Mass Spectrom. 2003;17:2632. doi: 10.1002/rcm.1250. [DOI] [PubMed] [Google Scholar]
- [20].Zhang H, Zhang D, Ray K. J. Mass Spectrom. 2003;38:1110. doi: 10.1002/jms.521. [DOI] [PubMed] [Google Scholar]
- [21].Jiang Q, Christen S, Shigenaga MK, Ames BN. Am. J. Clin. Nutr. 2001;74:714. doi: 10.1093/ajcn/74.6.714. [DOI] [PubMed] [Google Scholar]
- [22].Murray ED, Kantoci D, Dewind SA, Bigornia AE, Damico DC, King JG, Pham T, Levine BH, Jung ME, Wechter WJ. Life Sciences. 1995;57:2145. doi: 10.1016/0024-3205(95)02207-y. [DOI] [PubMed] [Google Scholar]
- [23].Wechter WJ, Kantoci D, Murray ED, Jr., D'Amico DC, Jung ME, Wang WH. Proc. Natl. Acad. Sci. U. S. A. 1996;93:6002. doi: 10.1073/pnas.93.12.6002. [DOI] [PMC free article] [PubMed] [Google Scholar]
- [24].Parker RS, Sontag TJ, Swanson JE, McCormick CC. Annals New York Acad. Sci. 2004;1031:13. doi: 10.1196/annals.1331.002. [DOI] [PubMed] [Google Scholar]
- [25].Sontag TJ, Parker RS. J. Biol. Chem. 2002;277:25290. doi: 10.1074/jbc.M201466200. [DOI] [PubMed] [Google Scholar]
- [26].Jiang Q, Freiser H, Wood KV, Yin X. J. Lipid Res. 2007;48:1221. doi: 10.1194/jlr.D700001-JLR200. [DOI] [PMC free article] [PubMed] [Google Scholar]
- [27].Jiang Q, Yin X, Lill MA, Danielson ML, Freiser H, Huang J. Proc. Natl. Acad. Sci. U. S. A. 2008;105:20464. doi: 10.1073/pnas.0810962106. [DOI] [PMC free article] [PubMed] [Google Scholar]
- [28].Birringer M, Pfluger P, Kluth D, Landes N, Brigelius-Flohe R. J. Nutr. 2002;132:3113. doi: 10.1093/jn/131.10.3113. [DOI] [PubMed] [Google Scholar]
- [29].Zhang X, Hines W, Adamec J, Asara JM, Naylor S, Regnier FE. J. Am. Soc. Mass Spectrom. 2005;16:1181. doi: 10.1016/j.jasms.2005.03.016. [DOI] [PubMed] [Google Scholar]


