Abstract
History dependent effects on muscle force development following active changes in length have been measured in a number of experimental studies. However, few muscle models have included these properties or examined their impact on force and power output in dynamic cyclic movements. The goal of this study was to develop and validate a modified Hill-type muscle model that includes shortening induced force depression and assess its influence on locomotor performance. The magnitude of force depression was defined by empirical relationships based on muscle mechanical work. To validate the model, simulations incorporating force depression were developed to emulate single muscle in situ and whole muscle group leg extension experiments. There was excellent agreement between simulation and experimental values, with in situ force patterns closely matching the experimental data (average RMS error < 1.5 N) and force depression in the simulated leg extension exercise being similar in magnitude to experimental values (6.0% vs 6.5%, respectively). To examine the influence of force depression on locomotor performance, simulations of maximum power pedaling with and without force depression were generated. Force depression decreased maximum crank power by 20% – 40%, depending on the relationship between force depression and muscle work used. These results indicate that force depression has the potential to substantially influence muscle power output in dynamic cyclic movements. However, to fully understand the impact of this phenomenon on human movement, more research is needed to characterize the relationship between force depression and mechanical work in large muscles with different morphologies.
Keywords: history dependent properties, forward dynamics simulation, muscle model, power
1. Introduction
History dependent effects on muscle force development following active changes in length have long been known to exist in skeletal muscles. For example, the isometric force produced by a muscle following active shortening has been shown to be depressed relative to isometric force without previous shortening (e.g., Abbott and Aubert, 1952; Herzog et al., 2000; Marechal and Plaghki, 1979; Meijer et al., 1998). Following an active muscle stretch, the isometric force produced has been shown to be increased relative to a corresponding isometric contraction without a previous stretch (e.g., Abbott and Aubert, 1952; Cavagna and Citterio, 1974; Edman et al., 1982; Herzog and Leonard, 2002; Hisey et al., 2009). Both force depression and enhancement are long lasting and have been identified in isolated muscles and muscle fibers (e.g., Abbott and Aubert, 1952; Edman et al., 1978; Edman and Tsuchiya, 1996), whole muscles in situ (Herzog and Leonard, 2002; Marechal and Plaghki, 1979), whole muscles in vivo (e.g., De Ruiter et al., 1998) and whole muscle groups in vivo (e.g., Chapman et al., 1985; Lee et al., 1999).
Several studies have shown that shortening induced force depression has a linear relationship with the magnitude of length change when shortening at constant velocity (e.g., Edman, 1975; Marechal and Plaghki, 1979), and an exponential relationship with velocity when shortening over a fixed distance (e.g., Marechal and Plaghki, 1979; Meijer et al., 1998). However, others have shown that force depression is independent of velocity if the magnitude of force remains constant during shortening (Herzog et al., 2000). These relationships have been the basis for previous modified Hill-type muscle models incorporating history dependent muscle properties (Ettema and Meijer, 2000; Meijer et al., 1998). Other studies have shown that force depression is significantly related to muscle work, with variation in muscle work accounting for over 85% of the variation in force depression (Herzog et al., 2000). This relationship has been supported in a recent analysis of mouse muscles (Kosterina et al., 2008).
However, the experimental protocols required to identify history dependent effects do not readily permit the evaluation of how they influence muscle force and power output during cyclic locomotor tasks such as human walking or pedaling. Musculoskeletal modeling and forward dynamics simulations provide an ideal framework for examining the influence of muscle properties that cannot be measured directly (Gerritsen et al., 1998; Umberger et al., 2006; van Soest and Bobbert, 1993). A large number of muscle models have been developed to estimate force output ranging in complexity, with the classic Hill-type model being used most frequently in forward dynamics simulations due to its relative simplicity (Erdemir et al, 2007). The need to explore the influence of history dependent effects on muscle models has often been recognized (e.g., Huijing, 1995; Winters, 1995); however, relatively few models have incorporated them into their estimates of force output (Ettema and Meijer, 2000; Forcinito et al., 1998; Meijer et al., 1998; Tamura et al., 2005; Wu and Herzog, 1999). Even fewer studies have used these models to examine the influence of history dependent effects on muscle coordination during dynamic movements (e.g., Ettema, 2002).
The overall goal of this study was to develop a phenomenological model of shortening induced force depression based on a Hill-type muscle model that could easily be incorporated into forward dynamics simulations of human movement to assess the potential influence of force depression on human locomotor performance. The accuracy of the model was evaluated by comparing simulation output with experimental measurements of force depression at the single muscle and muscle group levels. At the single muscle level, simulations were developed that emulated in situ muscle ergometer experiments on cat soleus muscles, and at the muscle group level, simulations were developed that emulated a human leg extension exercise. To examine the potential effects of force depression on locomotor performance, a theoretical analysis was conducted in which simulations of maximum power pedaling with and without force depression were generated and compared.
2. Methods
2.1. Hill-type muscle model
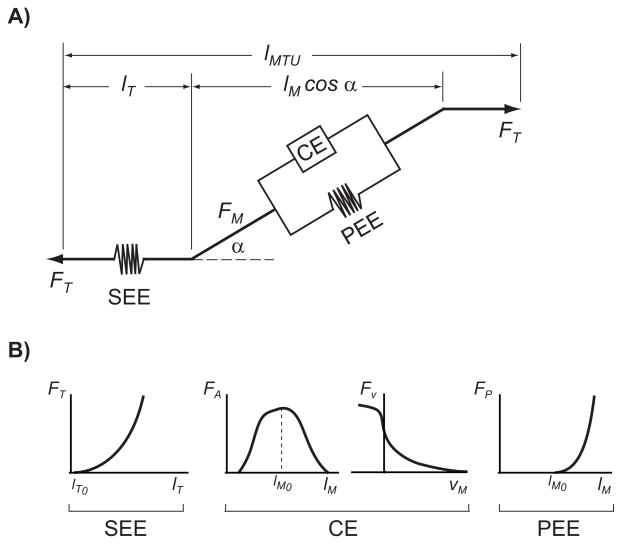
Simulations of muscle force were generated using a standard two state (activation, fiber length) Hill-type muscle model where the magnitude of the force is dependent primarily on the level of activation and the intrinsic muscle force-length-velocity relationships (Zajac, 1989) (Fig. 1). The musculotendon unit (MTU) is composed of a contractile element (CE) in parallel with an elastic element (PEE), both of which are in series with a tendon elastic element (SEE; Fig. 1).
Figure 1.
A) Generalized Hill-type muscle model consisting of a contractile element (CE), parallel elastic element (PEE) and series elastic element (SEE) with a pennation angle (α) (Zajac, 1989). B) Muscle force is determined from the active force-length (FA-LM) and force-velocity (FV-VM) relationships in the contractile element and the non-linear spring properties of the passive elastic (FP-LM) and series elastic (FT-LT) elements. The relationships were normalized by the corresponding maximal isometric force, optimal fiber length, maximal shorting velocity, tendon slack length for each muscle.
2.2. Force depression model
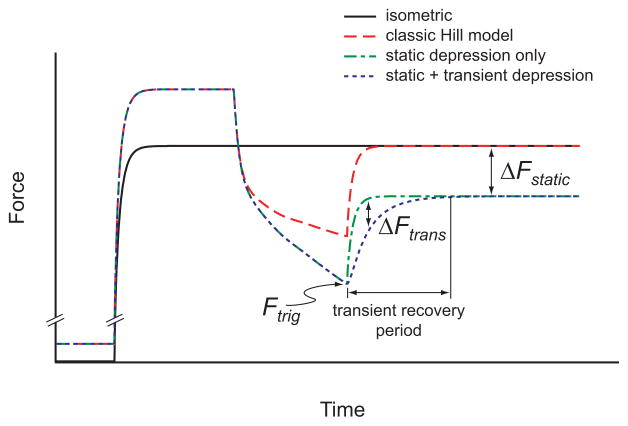
Studies have shown force depression likely occurs instantaneously with active muscle shortening and is maintained until the muscle is no longer active (e.g., Herzog et al., 2000). Further, when active shortening stops, there is a period over which the force returns exponentially to a steady state value (Fig. 2). In this study, the difference between the steady state isometric force following shortening and the corresponding isometric force without shorting is termed static force depression (ΔFstatic) and the component of force depression during the period in which force returns to steady state is termed transient force depression (ΔFtrans) (Fig. 2).
Figure 2.
A schematic showing force traces from different muscle models for simulated muscle ergometer test. The classic Hill-type muscle model does not reproduce any aspects of shortening induced force depression. Static force depression (ΔFstatic) occurs throughout the test, while transient force depression (ΔFtrans) occurs during the transient recovery period which begins when the muscle stops shorting (Ftrig). In order to accurately reproduce experimental data, both ΔFstatic and ΔFtrans is included.
The magnitude of static force depression is cumulative while the muscle is active and is a function of the net work (Wnet) done during shortening (Herzog et al., 2000). This relationship is defined as
| (1) |
The relationship between ΔFstatic and Wnet is assumed to be linear, with the regression coefficient (c= 9.43) determined from Herzog et al. (2000). Instantaneous muscle work (Wi) is the product of instantaneous muscle force (Fi) and velocity (vi), and time step (dt) and is calculated as
| (2) |
Net work (Wnet) is the cumulative sum of Wi over the entire time the muscle is active and set to zero when the muscle is inactive. Net work is calculated as
| (3) |
where a is muscle activation.
Because force depression is related to net work, if the muscle is stretched after shortening while still active, the amount of force depression is decreased. If the muscle is stretched to a greater degree than it had previously shortened, the resulting isometric force is increased (stretch induced force enhancement) relative to isometric force with no previous length change (e.g., Herzog and Leonard, 2002). However, the relationship between muscle stretch and force enhancement is less well characterized and it is not clear if muscle work is also a reliable predictor of increased force. Therefore, in this study, if Wnet became negative (active stretching), total force depression was set to zero.
Transient force depression (ΔFtrans) describes the delayed force recovery between when the muscle stops shortening and when the force returns to a steady state (Fig. 2). The nature of this delayed force response has been previously characterized for cat soleus muscle with an exponential force recovery rate (k) that is also a function of Wnet (Corr and Herzog, 2005). Studies of the cat soleus have shown that the delayed force recovery occurs for a short time following a rapid change in fiber velocity (e.g., Herzog et al., 2000). Therefore, ΔFtrans was set to zero until initiated by an increase in contraction velocity (dv/dt > 0), at which point it was calculated as
| (4) |
where A is the difference between the current force (including ΔFstatic) and the force at the time when ΔFtrans was initiated and defined as
| (5) |
The resulting muscle force (F′) is expressed as the muscle force without force depression (F) minus the sum of the static and transient force depression using the equation
| (6) |
2.3. Simulations
2.3.1 Single muscle in situ simulation
To validate the muscle model’s ability to reproduce empirical measurements of force depression at the single muscle level, the protocol from the experimental study of Herzog et al. (2000) analyzing the cat soleus was simulated. The experimental muscle ergometer from that study was modeled using SIMM/Dynamics Pipeline (MusculoGraphics, Inc) with two blocks mounted horizontally on a frictionless surface with the modified Hill-type muscle mounted between them. One block was fixed while the other block underwent prescribed linear motion in which velocity was controlled. Briefly, the experiment was designed to compare the isometric force following a constant velocity contraction with the isometric force of a muscle that did not shorten. To account for force-length effects, all contractions ended at the same length (4 mm less than optimal). In each simulation, the muscle was fully activated prior to shortening and remained fully activated until well after the muscle returned to constant force. Two sets of experiments were conducted to examine the effects of shortening length and shortening velocity. In the first set of experiments, shortening velocity was held constant (4 mm/s) and the initial muscle length was varied such that the muscle shortened over different lengths (2, 4, 6, 8 and 10mm). In the second set of experiments, the muscle shortened a fixed distance (8 mm) at a range of constant velocities (4, 8, 16, 32 and 256 mm/s). Values for the optimal muscle fiber length (36 mm), tendon slack length (74 mm, including aponeurosis), maximum shorting velocity (3.3 lengths/sec) and maximum isometric force (22.4 N) were set to approximate values for a cat soleus muscle used in the experimental study (Herzog et al., 2000).
2.3.2 Leg extension simulation
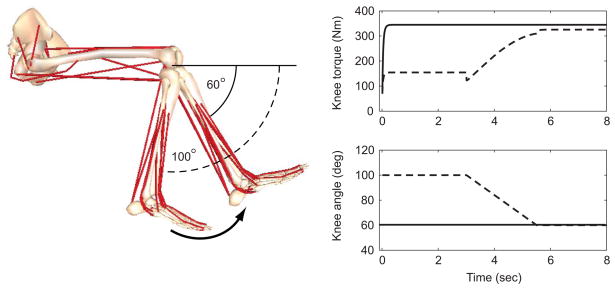
To validate the muscle model’s ability to reproduce empirical measurements of force depression at the muscle group level, the protocol from the experimental study of Lee et al. (1999) analyzing an isometric human knee extension exercise was simulated. A previously described linked segment musculoskeletal model (e.g., Neptune et al., 2008) was modified and consisted of a trunk and single leg comprised of a foot, shank and thigh segment and included 25 modified Hill-type muscle actuators. However, only the four quadriceps muscles (rectus femoris and three vastii) were activated during the simulations. The model was configured in a seated position with the hip and ankle angles fixed and the knee controlled using prescribed motion (Fig. 4). Simulations were performed which emulated the experiments conducted by Lee et al. (1999). Similar to the ergometer experiments, force output was compared between isometric contractions following active shortening and contractions with no prior shortening. This was accomplished by comparing the knee joint torque measured during a maximal contraction with the knee fixed at 60 degrees flexion with the isometric joint torque measured following a constant velocity extension from 100 degrees to 60 degrees. This protocol was replicated in the simulation and the corresponding changes in knee joint torque were compared.
Figure 4.
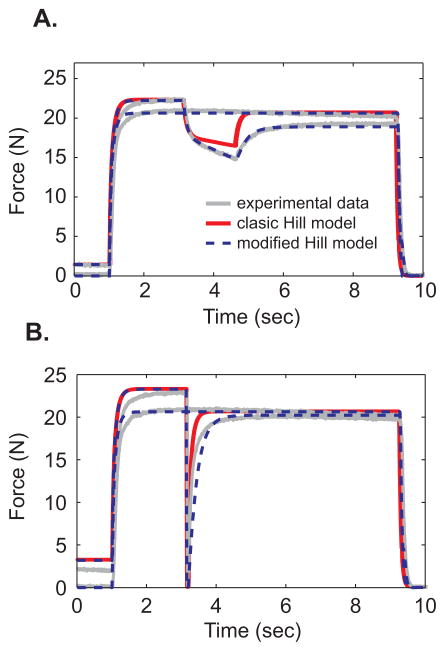
A comparison of experimental data with a simulation using the classic Hill model the modified Hill model during A) a 6mm shortening trial at 4mms−1 and B) a 8mm shorting trial at 256 mms−1.
2.3.3 Maximum power pedaling simulation
To examine the potential effects of force depression on human locomotor performance, simulations of maximum power pedaling with and without force depression were generated and compared. The modified Hill-type model with force depression was incorporated into a previously described pedaling simulation (for details, see Rankin and Neptune, 2008). Briefly, the musculoskeletal model consisted of nine segments (pelvis, two legs with a thigh, shank, patella and foot), a crank and pedal system, and 15 musculotendon actuators per leg. The pelvis and crank segments were fixed to the ground and the foot segments were fixed to the pedals resulting in three rotational degrees of freedom (crank and two pedals). The motion of the crank segment was prescribed in order to emulate an isokinetic ergometer. Simulations of 90 rpm pedaling with and without force depression were generated using a simulated annealing algorithm (Goffe et al., 1994) that fine tuned the muscle excitation patterns to maximize average crank power. The influence of force depression was assessed by comparing the results for maximal average crank power between the two simulations.
3. Results
3.1 Single muscle in situ simulation
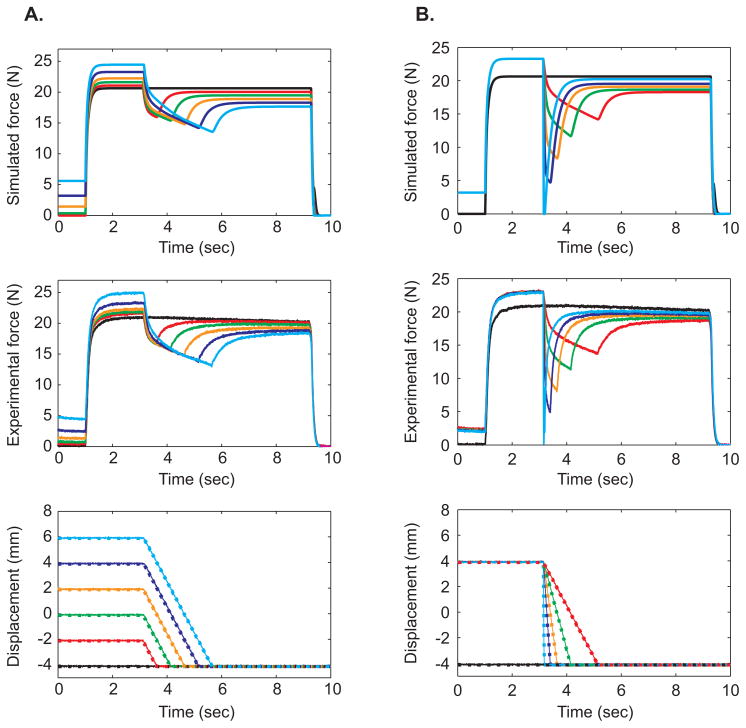
The simulated muscle ergometer tests incorporating the modified Hill-type model were able to accurately reproduce both the length and velocity dependent characteristics of shortening induced force depression observed experimentally (Fig. 3,4). The constant velocity experiments exhibited both an increase in steady-state force depression and a decrease in the rate of force recovery during the transient recovery period (Fig. 2) with increasing length change (Fig. 3A). The average root mean square error (RMSE) between the simulation and experimental data for the constant velocity trials was 0.66 N (range: 0.58 N – 0.94 N). The variable velocity experiments exhibited a decrease in steady state force depression and an increase in rate of force recovery with increasing shortening velocity (Fig. 3B). The average RMSE for the variable velocity trials was 0.86 N (range: 0.35 N – 1.45 N).
Figure 3.
Simulated (top row) and experimental (middle row) data from A) constant velocity and B) variable velocity in situ experiments. Muscles were fully activated at 1 sec and deactivated ~ 9.5 sec. The constant velocity experiments were conducted at -4mm s−1 and shortened 2, 4, 6, 8 and 10 mm. Variable velocity experiments were conducted at 4, 8, 16, 32 and 256 mm s−1 with a fixed displacement of 8 mm. Simulated displacements (large dashed lines) and plotted over experimental displacements (thin lines) are plotted in the same graphs (bottom row).
3.2 Leg extension simulation
The simulation of a seated knee extension exercise showed that isometric torque following a knee extension of 40° (from 100° to 60° flexion) was reduced by 6% relative to an isometric contraction at 60° with no previous shortening (Fig. 5). This result is comparable to the previous experimental study of human subjects which showed an average reduction in torque of 6.5% under the same conditions (Lee et al, 1999).
Figure 5.
Simulations of a knee extension exercise during isometric (solid line) and isometric-shortening-isometric (dashed line) contractions. The quadriceps muscle were fully activated at 0 sec and remained active throughout the simulation. The isometric test was conducted at 60 degrees and the isometric-shortening-isometric test began at 100 degrees and underwent constant velocity shortening to 60 degrees.
3.3 Maximum power pedaling simulation
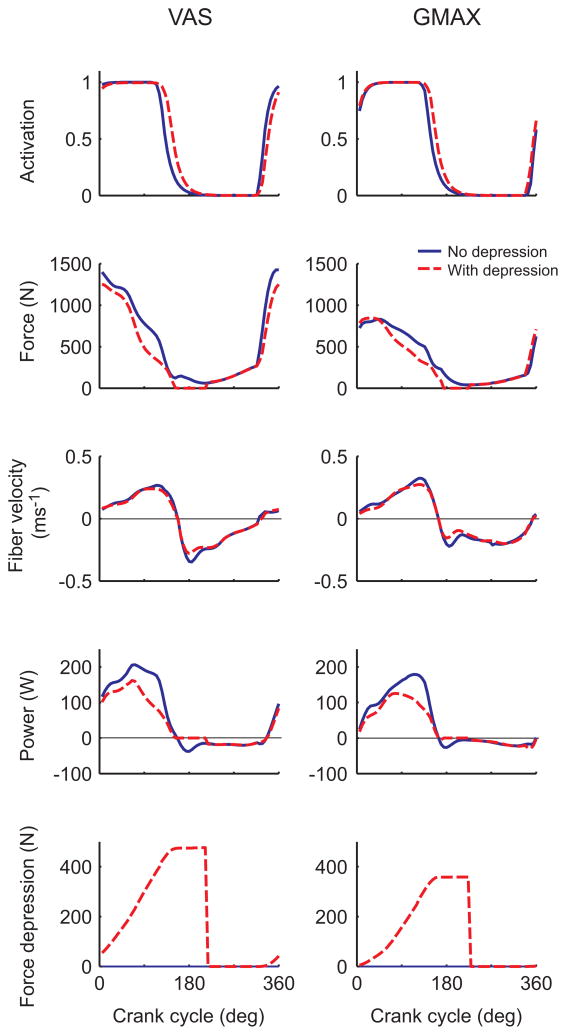
The maximal average crank power in the pedaling simulation with and without force depression was 649 W and 966 W, respectively, yielding a reduction in average power of ~ 28%. Not surprisingly, force depression had the greatest impact on the major power producing muscles (i.e. the vastii and gluteus maximus). Force depression in these muscles resulted in a reduction in average muscle power of 45.6 W and 13.6 W, respectively. Both simulations utilized similar activation patterns (Fig. 6) and had similar muscle fiber lengths and velocities. Thus, the reduction in muscle power was almost exclusively due to force depression, especially during the second half of the power stroke (~90° to 180°; Fig. 6).
Figure 6.
Simulation data from vastus lateralis (VAS) and gluteus maximus (GMAX) from one cycle of maximum power pedaling with (dashed line) and without (solid line) shortening induced force depression.
4. Discussion
The goal of this study was to develop a phenomenological model of shortening induced force depression that could easily be incorporated into forward dynamics simulations. The results of the simulations showed that the modified Hill-type model could more accurately reproduce experimental data than the classic Hill-type model alone (Fig. 4). Experimental data were matched for single muscle in situ preparations (Fig. 3.) and whole muscle groups in vivo (Fig. 5), thus validating the model’s use in more complex whole-body movements. The results from incorporating the modified model into a forward dynamics simulation of maximal power pedaling suggest that shortening induced force depression has the potential to substantially reduce muscle power output.
The agreement between our simulations and experimental muscle ergometer data was comparable to that found by previous models incorporating shortening induced force depression (Ettema and Meijer, 2000; e.g., Forcinito et al., 1998; Meijer et al., 1998; Wu and Herzog, 1999) indicating a similar ability to account for this history dependent effect. The model developed by Wu and Herzog (1999) is based on a modified cross-bridge model, which can accurately reproduce both the static and transient aspects of force depression, but is relatively complex and cannot be easily incorporated into computationally intensive forward dynamics simulations. Simpler modified Hill-type muscle models (Ettema and Meijer, 2000; Meijer et al., 1998) and exponential decay models (Ettema and Meijer, 2000) have been developed that are better suited for use in forward dynamics simulations, but these are limited in their ability to reproduce the transient component of force depression (Meijer et al., 1998). Building on this previous work, the present model reproduces both the transient and long lasting force depression, similar to the model of Wu and Herzog (1999), while being simple enough to use in forward dynamics simulation analyses.
With the model validated at the single muscle and muscle group levels, we could pursue our primary goal of assessing the potential influence of force depression on human locomotor performance. During normal cyclic movements such as walking or pedaling, muscles typically undergo repeated cycles of shortening and lengthening with little or no isometric activity. However, studies suggest that force depression begins at the instant that the muscle begins to shorten (e.g., Herzog et al., 2000), and therefore should affect the muscle’s ability to generate force during cyclic movements with no isometric phase. The results from our simulation of maximal power pedaling support this conclusion. The maximal average crank power was reduced by ~ 28%, primarily due to a reduction in force during the second half of the power stroke, when cumulative muscle work, and thus depression, is greatest (Fig. 6). It is important to note that force depression would likely not have as great an effect during sub-maximal activities, where increased muscle recruitment can offset any force depression. However, increased recruitment would be associated with greater fatigue and higher metabolic cost.
The model presented in this study only accounts for shortening induced force depression. However, other history dependent effects such as active, stretch-induced force enhancement may play an equally important role during cyclic movements. Force enhancement was not included in the current model because, to date, there has not been an established relationship between force enhancement and a simple scalar variable such as muscle work and it appears force enhancement may depend greatly on the current muscle length (e.g., Hisey et al., 2009). Other studies have incorporated force enhancement by generally using the same function for enhancement and depression (Ettema and Meijer, 2000; Forcinito et al., 1998). This approach is reasonable, provided that the cumulative effects are taken into account. Specifically, the effects of a stretch following shortening appear to be cumulative; whereas the effects of shortening following stretch are not (Herzog and Leonard, 2000). In the present study, it is likely that stretch-induced force enhancement would have a limited influence during our simulation of pedaling since active stretch only occurs for a short period of time during the transition between the power (downstroke) and recovery (upstroke) regions in the pedaling cycle when the activation level is low. However, in activities such as running, where several muscles are actively stretched during the first part of stance, stretch-induced force enhancement may have a greater influence than shortening depression. Future work is needed to examine the relative roles of force depression and enhancement in other types of locomotion.
An important note is that the modified Hill-type model in this study calculated force depression based on the relationship between force depression and mechanical work derived from cat soleus muscle. However, Herzog et al. (2000) showed that there is considerable variability in the relationship among individual muscles tested. Because the soleus muscle is relatively small, this relationship had to be extrapolated well beyond the values measured in order to incorporate force depression in our simulation of human movement. Thus, a relatively small difference in regression constants could potentially have a large effect on force depression in muscles that produce significant muscle work. To examine this, we repeated the maximal power pedaling simulations with regression constants that represented the highest (c = 13.3) and lowest (c = 6.67) possible slopes for the data presented by Herzog et al (2000). Maximal average crank power varied from 570 W to 770 W for the high and low regression constants, respectively. Thus, depending on the relationship chosen, force depression may reduce maximal average power in pedaling between 20% – 40%.
The current study assumes that the relationship between mechanical work and force depression in cat soleus muscles is representative of what exists in human muscles. However, based on the few studies that have characterized this relationship, there is reason to believe this may not be the case, at least not for all muscles. Recent studies have indicated that the relationship between force depression and mechanical work may be related to fiber type (Kosterina et al., 2009; Kosterina et al., 2008). From our present study, it is clear that force depression has the potential to have a significant influence on whole-body cyclic movements in humans. But to gain a better insight into the magnitude of this influence, it is important that studies continue to examine the relationship between force depression and mechanical work in larger muscles and in muscles with different fiber type compositions, as well as trying to elucidate the mechanisms underlying this phenomenon.
Acknowledgments
This work was funded by NIH grants RO1 NS55380 and F32 AR054245.
Footnotes
Publisher's Disclaimer: This is a PDF file of an unedited manuscript that has been accepted for publication. As a service to our customers we are providing this early version of the manuscript. The manuscript will undergo copyediting, typesetting, and review of the resulting proof before it is published in its final citable form. Please note that during the production process errors may be discovered which could affect the content, and all legal disclaimers that apply to the journal pertain.
References
- Abbott BC, Aubert XM. The force exerted by active striated muscle during and after change of length. J Physiol. 1952;1171:77–86. [PMC free article] [PubMed] [Google Scholar]
- Cavagna GA, Citterio G. Effect of stretching on the elastic characteristics and the contractile component of frog striated muscle. J Physiol. 1974;2391:1–14. doi: 10.1113/jphysiol.1974.sp010552. [DOI] [PMC free article] [PubMed] [Google Scholar]
- Chapman AE, Caldwell GE, Selbie WS. Mechanical output following muscle stretch in forearm supination against inertial loads. J Appl Physiol. 1985;591:78–86. doi: 10.1152/jappl.1985.59.1.78. [DOI] [PubMed] [Google Scholar]
- Corr DT, Herzog W. Force recovery after activated shortening in whole skeletal muscle: transient and steady-state aspects of force depression. J Appl Physiol. 2005;991:252–260. doi: 10.1152/japplphysiol.00509.2004. [DOI] [PubMed] [Google Scholar]
- De Ruiter CJ, De Haan A, Jones DA, Sargeant AJ. Shortening-induced force depression in human adductor pollicis muscle. J Physiol. 1998;507(Pt 2):583–591. doi: 10.1111/j.1469-7793.1998.583bt.x. [DOI] [PMC free article] [PubMed] [Google Scholar]
- Edman KA. Mechanical deactivation induced by active shortening in isolated muscle fibres of the frog. J Physiol. 1975;2461:255–275. doi: 10.1113/jphysiol.1975.sp010889. [DOI] [PMC free article] [PubMed] [Google Scholar]
- Edman KA, Elzinga G, Noble MI. Enhancement of mechanical performance by stretch during tetanic contractions of vertebrate skeletal muscle fibres. J Physiol. 1978;281:139–155. doi: 10.1113/jphysiol.1978.sp012413. [DOI] [PMC free article] [PubMed] [Google Scholar]
- Edman KA, Elzinga G, Noble MI. Residual force enhancement after stretch of contracting frog single muscle fibers. J Gen Physiol. 1982;805:769–784. doi: 10.1085/jgp.80.5.769. [DOI] [PMC free article] [PubMed] [Google Scholar]
- Edman KA, Tsuchiya T. Strain of passive elements during force enhancement by stretch in frog muscle fibres. J Physiol. 1996;490(Pt 1):191–205. doi: 10.1113/jphysiol.1996.sp021135. [DOI] [PMC free article] [PubMed] [Google Scholar]
- Ettema GJ. Effects of contraction history on control and stability in explosive actions. J Electromyogr Kinesiol. 2002;126:455–461. doi: 10.1016/s1050-6411(02)00039-1. [DOI] [PubMed] [Google Scholar]
- Ettema GJ, Meijer K. Muscle contraction history: modified Hill versus an exponential decay model. Biol Cybern. 2000;836:491–500. doi: 10.1007/s004220000190. [DOI] [PubMed] [Google Scholar]
- Forcinito M, Epstein M, Herzog W. Can a rheological muscle model predict force depression/enhancement? J Biomech. 1998;3112:1093–1099. doi: 10.1016/s0021-9290(98)00132-8. [DOI] [PubMed] [Google Scholar]
- Gerritsen KG, van den Bogert AJ, Hulliger M, Zernicke RF. Intrinsic muscle properties facilitate locomotor control - a computer simulation study. Motor Control. 1998;23:206–220. doi: 10.1123/mcj.2.3.206. [DOI] [PubMed] [Google Scholar]
- Goffe WL, Ferrier GD, Rodgers J. Global optimization of statistical functions with simulated annealing. J Econometrics. 1994;60:65–99. [Google Scholar]
- Herzog W, Leonard TR. The history dependence of force production in mammalian skeletal muscle following stretch-shortening and shortening-stretch cycles. J Biomech. 2000;335:531–542. doi: 10.1016/s0021-9290(99)00221-3. [DOI] [PubMed] [Google Scholar]
- Herzog W, Leonard TR. Force enhancement following stretching of skeletal muscle: a new mechanism. J Exp Biol. 2002;205(Pt 9):1275–1283. doi: 10.1242/jeb.205.9.1275. [DOI] [PubMed] [Google Scholar]
- Herzog W, Leonard TR, Wu JZ. The relationship between force depression following shortening and mechanical work in skeletal muscle. J Biomech. 2000;336:659–668. doi: 10.1016/s0021-9290(00)00008-7. [DOI] [PubMed] [Google Scholar]
- Hisey B, Leonard TR, Herzog W. Does residual force enhancement increase with increasing stretch magnitudes? J Biomech. 2009 doi: 10.1016/j.jbiomech.2009.03.046. [DOI] [PubMed] [Google Scholar]
- Huijing PA. Parameter interdependence and success of skeletal muscle modelling. Human Movement Science. 1995;144–5:443. [Google Scholar]
- Kosterina N, Westerblad H, Eriksson A. Mechanical work as predictor of force enhancement and force depression. J Biomech. 2009 doi: 10.1016/j.jbiomech.2009.04.028. [DOI] [PubMed] [Google Scholar]
- Kosterina N, Westerblad H, Lannergren J, Eriksson A. Muscular force production after concentric contraction. J Biomech. 2008;4111:2422–2429. doi: 10.1016/j.jbiomech.2008.05.019. [DOI] [PubMed] [Google Scholar]
- Lee HD, Suter E, Herzog W. Force depression in human quadriceps femoris following voluntary shortening contractions. J Appl Physiol. 1999;875:1651–1655. doi: 10.1152/jappl.1999.87.5.1651. [DOI] [PubMed] [Google Scholar]
- Marechal G, Plaghki L. The deficit of the isometric tetanic tension redeveloped after a release of frog muscle at a constant velocity. J Gen Physiol. 1979;734:453–467. doi: 10.1085/jgp.73.4.453. [DOI] [PMC free article] [PubMed] [Google Scholar]
- Meijer K, Grootenboer HJ, Koopman HF, van der Linden BJ, Huijing PA. A Hill type model of rat medial gastrocnemius muscle that accounts for shortening history effects. J Biomech. 1998;316:555–563. doi: 10.1016/s0021-9290(98)00048-7. [DOI] [PubMed] [Google Scholar]
- Neptune RR, Sasaki K, Kautz SA. The effect of walking speed on muscle function and mechanical energetics. Gait Posture. 2008;281:135–143. doi: 10.1016/j.gaitpost.2007.11.004. [DOI] [PMC free article] [PubMed] [Google Scholar]
- Rankin JW, Neptune RR. A theoretical analysis of an optimal chainring shape to maximize crank power during isokinetic pedaling. J Biomech. 2008;417:1494–1502. doi: 10.1016/j.jbiomech.2008.02.015. [DOI] [PubMed] [Google Scholar]
- Tamura Y, Saito M, Nagato R. A new motor model representing the stretch-induced force enhancement and shortening-induced force depression in skeletal muscle. J Biomech. 2005;384:877–884. doi: 10.1016/j.jbiomech.2004.04.028. [DOI] [PubMed] [Google Scholar]
- Umberger BR, Gerritsen KG, Martin PE. Muscle fiber type effects on energetically optimal cadences in cycling. J Biomech. 2006;398:1472–1479. doi: 10.1016/j.jbiomech.2005.03.025. [DOI] [PubMed] [Google Scholar]
- van Soest AJ, Bobbert MF. The contribution of muscle properties in the control of explosive movements. Biol Cybern. 1993;693:195–204. doi: 10.1007/BF00198959. [DOI] [PubMed] [Google Scholar]
- Winters JM. How detailed should muscle models be to understand multi-joint movement coordination? Human Movement Science. 1995;144–5:401. [Google Scholar]
- Wu JZ, Herzog W. Modelling concentric contraction of muscle using an improved cross-bridge model. J Biomech. 1999;328:837–848. doi: 10.1016/s0021-9290(99)00057-3. [DOI] [PubMed] [Google Scholar]
- Zajac FE. Muscle and tendon: properties, models, scaling, and application to biomechanics and motor control. Crit Rev Biomed Eng. 1989;174:359–411. [PubMed] [Google Scholar]


