Abstract
Repositioning microelectrodes post-implantation is emerging as a promising approach to achieve long-term reliability in single neuronal recordings. The main goal of this study was to (a) assess glial reaction in response to movement of microelectrodes in the brain post-implantation and (b) determine an optimal window of time post-implantation when movement of microelectrodes within the brain would result in minimal glial reaction. Eleven Sprague-Dawley rats were implanted with two microelectrodes each that could be moved in vivo post-implantation. Three cohorts were investigated: (1) microelectrode moved at day 2 (n = 4 animals), (2) microelectrode moved at day 14 (n = 5 animals) and (3) microelectrode moved at day 28 (n = 2 animals). Histological evaluation was performed in cohorts 1–3 at four-week post-movement (30 days, 42 days and 56 days post-implantation, respectively). In addition, five control animals were implanted with microelectrodes that were not moved. Control animals were implanted for (1) 30 days (n = 1), (2) 42 days (n = 2) and (3) 56 days (n = 2) prior to histological evaluation. Quantitative assessment of glial fibrillary acidic protein (GFAP) around the tip of the microelectrodes demonstrated that GFAP levels were similar around microelectrodes moved at day 2 when compared to the 30-day controls. However, GFAP expression levels around microelectrode tips that moved at day 14 and day 28 were significantly less than those around control microelectrodes implanted for 42 and 56 days, respectively. Therefore, we conclude that moving microelectrodes after implantation is a viable strategy that does not result in any additional damage to brain tissue. Further, moving the microelectrode downwards after 14 days of implantation may actually reduce the levels of GFAP expression around the tips of the microelectrodes in the long term.
Introduction
Implantable microelectrodes are critical tools that are extensively used in neurophysiology to decipher brain function and dysfunction. They are also emerging as promising clinical devices in the treatment of a wide range of central nervous system (CNS) disorders including Parkinson's disease and depression, as well as hearing and visual impairment [1–3]. However, it has been frequently reported that the in vivo recording capabilities of the microelectrodes degrade over time in experimental animals due in part to the CNS immune response to injury and chronic implantation [2, 4–9]. It is widely hypothesized that as a consequence of this immune response, the microelectrodes are progressively electrically isolated from the targeted neurons by a glial encapsulation [5, 8–15] eventually leading to a recording failure.
At the cellular level, the glial response begins with tissue macrophages; both blood-borne macrophages and microglia are the first to respond to an implant injury. Blood-borne macrophages, generally absent in healthy CNS tissue, enter the tissue from the vasculature when the blood brain barrier (BBB) is disrupted and/or damaged by surgical implantation [16, 17]. The extent of the BBB disruption is thought to be partially related to the severity of the chronic glial scar [17–19]. As an example, when considering hemorrhagic stroke, where large numbers of blood-borne macrophages infiltrate the CNS tissue after breakdown of the BBB, in the days and weeks following the initial injury, the final scar is dramatically increased in size by several times compared to the initial lesion [19]. It is theorized that the CNS immune response and the blood-borne macrophages are partially responsible for this increase in tissue damage and cellular death [19–21]. Concurrently, during the initial stages of injury, the microglia, along with their macrophagic activities, begin to signal quiescent astrocytes into their reactive state [5, 8, 13]. Reactive astrocytes rapidly begin to upregulate glial fibrillary acidic protein (GFAP), migrate toward and proliferate at the site of injury [16, 17, 19]. Astrocytic upregulation of GFAP typically begins in the first few days following the initial injury as the microglia and macrophages clear the injury site of necrosed cells, the astrocytes then begin to proliferate at the site of injury [17, 19, 22]. Astrocytic mitosis occurs only when the CNS tissue is damaged and a physical void of tissue is created. This space is then eventually filled by astrocytes [23]. By four weeks, a complete glial sheath is formed [5, 8, 13]. Although microglia are present in the long-term glial scar, the astrocytes are the predominant cell type found encapsulating the implant [5, 8, 24, 25].
An array of design strategies have been targeted toward minimizing failure of implanted microelectrodes by minimizing the chronic glial scar around the microelectrode under chronic conditions. These approaches have included developing novel implant materials and insulation, implant shape and electrode tip shape (sharp versus blunt), implant size, implant rigidity (rigid versus flexible), implantation speed and the use of bioactive coatings on the microelectrodes intended to hinder the immune response [5, 7, 8, 12, 26–38]. An emerging strategy to overcome recording failure in the microelectrodes is to reposition the microelectrodes post-implantation [39–45] in the event of a failure. However, it is unknown how the resulting glial scar, caused by repositioning, will impact the overall chronic glial scar along the length of the electrode as well as at the tip of the electrode, which has been repositioned away from the initial glial encapsulation.
The goal of this study was to determine the impact of repositioning a chronically implanted neural microelectrode in the axial direction on the glial scar formation along the length and tip of the microelectrode that has moved beyond the initial implant injury. Further, it was important to determine if there existed an optimal time for moving the microelectrode post-implantation, which minimizes glial scarring at the tip of the microelectrode.
Methods
Moveable microelectrode array preparation
Moveable microelectrodes were constructed using a syringe barrel and two tungsten microelectrodes. The syringe barrel was cut to approximately 3.5 mm in length. Two micro-screw holes were drilled directly across from each other on the cut syringe barrel approximately 1.5 mm above the top and micro-screws were driven into place. A groove was formed at the top of the syringe barrel in order to route the ground wire and shield it from any trauma for the duration of the implant. A 10-pin Omnetics™ male nano-connector was cut into strips of three pins for interconnects. Pins A and B had tungsten microelectrodes (wire diameter = 73 μm) insulated with Teflon (final diameter = 114 μm) soldered into the open cups (A-M Systems Inc., Carlsborg, WA) and the remaining pin C had a 100 μm stainless steel uninsulated ground wire soldered into place. Each ground wire was left sufficiently long in order to feed it out of the syringe barrel through a small groove. It was then connected to an adjacent bone screw in the skull. A small z-shaped kink was placed in each ground wire to facilitate expansion upon in vivo movement. Each implantable electrode was tested for conductance, and a layer of two-part epoxy was applied in order to insulate and hold the wires in place. Prior to implantation each microelectrode array was placed inside the syringe barrel in order to ensure a secure fit. Both the syringe barrel and microelectrode array were sterilized using 70% ethyl alcohol prior to surgery.
Surgical procedure
A total of 16 300–350 g male Sprague-Dawley rats were used in this study. All procedures and protocols for the research were approved by the Institute for Animal Care and Use Committee (IACUC) at Arizona State University, Tempe, AZ. Each animal experiment was preformed in compliance to the National Institutes of Health (NIH) guidelines regarding the care and use of laboratory animals (NIH publications number 80–23) revised in 1996. Care was taken to minimize animal suffering and to minimize the number of animals used sufficient to produce reliable scientific data.
Initial anesthesia of ketamine (1 ml kg−1), xylazine (20 mg ml−1) and acepromazine (10 mg ml−1) mixed with sterile water was administered (1 g ml−1). Each animal was prepared for surgery by shaving the head from in front of the eyes to the base of the skull and placed into stereotaxic ear bars. Once secure in the ear bars, the surgical site was sterilized using alcohol then betadine for a total of three iterations. Vital signs and internal body temperature were monitored throughout the surgical procedure in order to ensure homeostatic conditions. An oval-shaped area of skin (2.5 × 1.5 cm) and tissue above the midline of the skull were removed. The skull was cleaned of all tissue and debris using alcohol and hydrogen peroxide, which effectively dried the skull and created an environment for proper adhesion of the bone cement (Polymethyl methacrylate, PMMA). A 5 mm dental drill was used to bore a 5–7 mm diameter craniotomy, located 1.5 mm posterior and 1.5–2 mm lateral to bregma. The craniotomy was carefully cleared of all bone fragments, and the dura was carefully retracted away from the implant site. In order to avoid drying of the brain tissue, saturated gelfoam was loosely placed inside the craniotomy. Care was taken to avoid all visible blood vessels on the surface of the brain. A total of three bone screws were then placed in the skull: (1) contralateral to the implant site 2 mm posterior to and 2 mm lateral to lambda, (2) ipsilateral to the implant site 2 mm posterior to and 2 mm lateral to lambda, and (3) ipsilateral to the implant site 2 mm anterior to and 2 mm lateral to bregma. The skull was again cleaned of all debris and moisture was wicked away. The syringe barrel was placed directly over the craniotomy and secured in place using PMMA; extreme care was taken to ensure that no PMMA entered the open craniotomy or came into contact to the exposed brain or soft tissue on the skull. Once the PMMA hardened, the microelectrode array was lowered into the syringe barrel using a stereotaxic arm. Magnifying goggles were used to determine when the electrodes reached the surface of the brain. Once at the surface of the brain the electrodes were implanted at a speed of 50 μm per every 60 s until they reached a depth between 400 and 500 μm. Finally, the exposed skull was coated with PMMA, including the bone screws and syringe barrel, and the skin was sutured in a purse-strap pattern treated with an antibiotic ointment, and the animal was allowed to recover.
Movement protocol
In order to fully assess the impact of repositioning microelectrodes at different time points post-implantation on GFAP expression levels, three specific time points post initial implantation were chosen: microelectrode movement of 500 μm at (a) day 2, (b) day 14 and (c) day 28. Repositioning the microelectrode at day 2 (post initial implantation) occurs in the course of the initial stages of the immune response when the microglia and macrophages are actively clearing the implant site of debris and signaling the astrocytes to become active and migrate toward the injury. Repositioning at days 14 and 28 (post initial implantation) is both after the initial immune response has likely begun to subside and/or has subsided; astrocytes are likely to be the major cell type at the electrode–tissue interface for the latter two time points. The brain tissue was extracted 28 days (4 weeks) following the movement. Therefore, the animals which were in the day-2 movement protocol were implanted for a total of 30 days, day-14 movement protocol animals were implanted for 42 days and day-28 movement protocol animals were implanted for a total of 56 days. In addition, control animals were also implanted to a depth of ~500 μm, after which the microelectrodes were not moved for 30 days, 42 days and 56 days as summarized in table 1.
Table 1.
Summary of implanted animals in this study. Microelectrodes were moved at day 2, 14 or 28 post-implantation. All histological evaluation was performed at 28-day post-movement. Three sets of controls were also performed in which the animals were implanted with microelectrodes which were not moved for 30, 42 or 56 days.
| Number of animals | Protocol | Histological evaluation at day |
|---|---|---|
| 4 | Movement at day 2 | 30 |
| 5 | Movement at day 14 | 42 |
| 2 | Movement at day 28 | 56 |
| 1 | No movement | 30 |
| 2 | No movement | 42 |
| 2 | No movement | 56 |
Immunochemistry and imaging
Rat brain tissue was perfused via whole animal perfusion using 4% paraformaldehyde and immediately extracted from the skull and placed in 4% paraformaldehyde solution for 48 h. The brain tissue was then sliced horizontally into 100 μm thick sections using a vibrotome and placed in 24 well cell culture trays and stained using a widely reported immunohistochemistry technique [7, 25, 46, 47]. All mounted tissue slices were imaged using a Leica SP2 multiphoton scanning laser microscope at 10×. Each image was initially imaged at 10× and then a zoom factor of 2 was used making the total magnification 20×.
GFAP quantification
As reported in our earlier work, the Leica LCS Lite software was used to aid in quantification [7]. Briefly, pixel histograms were drawn around each implant site (400 μm × 400 μm) and also around a site far away from the implant site in the non-implant region (100 μm × 100 μm). Tukey boxplots of the pixel intensity values were then constructed from the non-implant region in order to identify the threshold for outliers. The majority of the pixel intensity values from the confocal images have low-intensity readings ranging from absolute black (0) and/or background intensities (pixel intensities generally ranging between 0 and 75). The outliers are pixels of the highest intensities and are indicative of the implant injury response, and therefore correlated to higher levels of GFAP in the tissue. By subtracting out the non-outlier values corresponding to the background and reserving the values specific to the implant region (outliers) each implant injury region is normalized. The outlier pixel intensity values were then summed resulting in one numerical value per tissue slice.
Determination of tissue levels
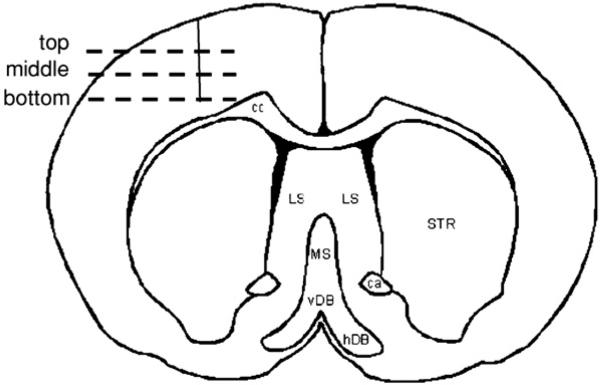
In order to determine and assess the amount of GFAP in the tissue around the tip of the electrode repositioned beyond the initial glial scar it was necessary to select tissue slices associated with the top, middle and bottom of the implant site (figure 1). This determination was made based on the level at which the actual tissue slice was located relative to the implant in the brain prior to slicing. Pixel values over multiple slices at each level (top, middle and bottom) were averaged. Three slices were eliminated due to abnormally high pixel intensities that were observed due to tissue folding (n = 2 slices) and an air bubble (n = 1 slice).
Figure 1.
Illustration of the top, middle and bottom sections of the implanted microelectrode in a coronal section of a rat brain.
Impedance monitoring
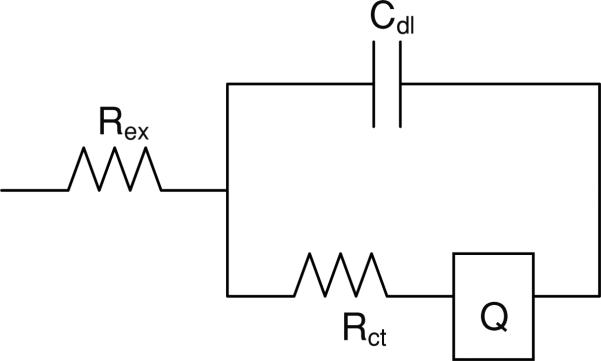
Electrodes were subjected to impedance measurement using an electrochemical workstation (model CHI660A, CH Instruments, TX) prior to implantation and a minimum of twice weekly for the duration of the implant. This system employs a three-electrode impedance method using an Ag/AgCl reference and a platinum counter electrode. Each pre-implantation test was performed in 1 M PBS in order to generate an impedance spectrum [48]. Complex impedance data were modeled using an electrical equivalent circuit shown in figure 2 in the ZSimpWin 3.21 program (E Chem Software, Ann Arbor, MI USA), and the individual parameters were estimated. The electrical equivalent circuit model shown in figure 2 was adapted from previous studies [49, 50]. In this model, Rex is the extracellular resistance, Cdl is the capacitive double layer between the metal and the surrounding ions, Rct is the charge transfer resistance at the tip of the electrode, and Q is the constant phase element.
Figure 2.
Equivalent electrical circuit model used to model the impedance. Rex is the extracellular resistance, Cdl is the double layer capacitance, Rct is the charge transfer resistance, and Q is the constant phase element.
Results
Immunohistological staining data
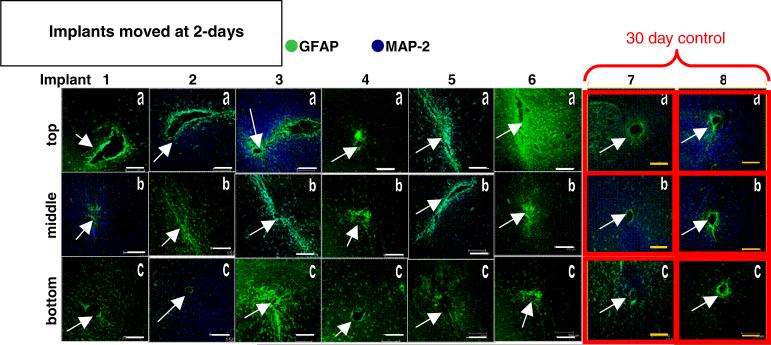
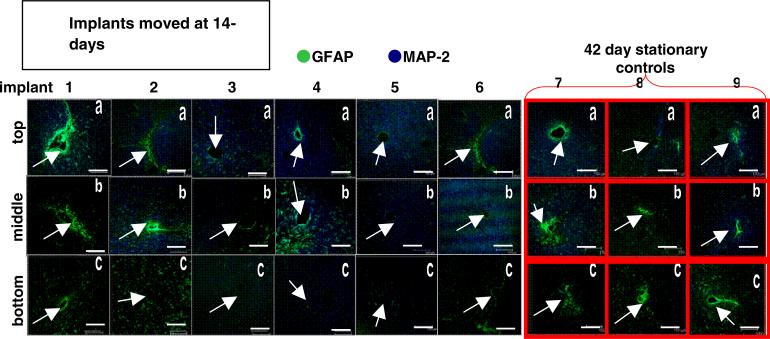
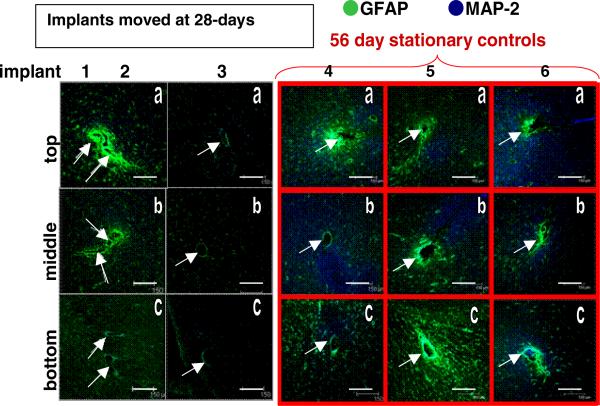
Histological images showing GFAP and MAP-2 expression levels in brain sections from each animal in the movement cohorts and their respective controls are shown in figures 3, 5, and 7. Repositioned microelectrodes were left in place for 28-day post-movement prior to histological evaluation. Columns display images of brain sections from a single implant site sampled from the top (labeled ‘a’), middle (labeled ‘b’) and bottom (labeled ‘c’) along the length of the microelectrode as defined in the methods section. The top is located closest to the skull, the middle is along the length of the microelectrode, and the bottom is located around the tip of the microelectrode deepest in the tissue. Images associated with the bottom sections will demonstrate glial scarring associated with repositioning the microelectrode beyond the initial implant site. Images outlined in red (gray) in the far right columns of figures 3, 5 and 7 are from the 30-day, 42-day and 56-day stationary controls, respectively. In figures 3, 5 and 7 GFAP expression is labeled green (gray; indicative of reactive astrocytes); MAP-2 expression is labeled blue (black; indicative of neuronal dendrites) and all scale bars are 150 μm.
Figure 3.
Immunohistological images from the implant site for the movement at day-2 cohort (columns 1–6) and the 30-day control (columns 7–8). Each column is a separate implant; each row is the top (a), middle (b), or bottom (c) sections of the implant site. Scale bars are 150 μm. Arrows indicate implant sites.
Figure 5.
Immunohistological images from the implant site for the movement at day-14 cohort (columns 1–6) and the 42-day control (columns 7–9). Each column is one separate implant; each row is the top (a), middle (b), or bottom (c) sections of the implant site. Scale bars are 150 μm. Arrows indicate implant sites.
Figure 7.
Immunohistological images from the implant site for the movement at day-28 cohort (columns 1–3) and the 56-day control (columns 4–6). Each column is one separate implant; each row is the top (a), middle (b) or bottom (c) sections of the implant site. Scale bars are 150 μm. Arrows indicate implant sites (two separate implant sites in each tissue section of the first column).
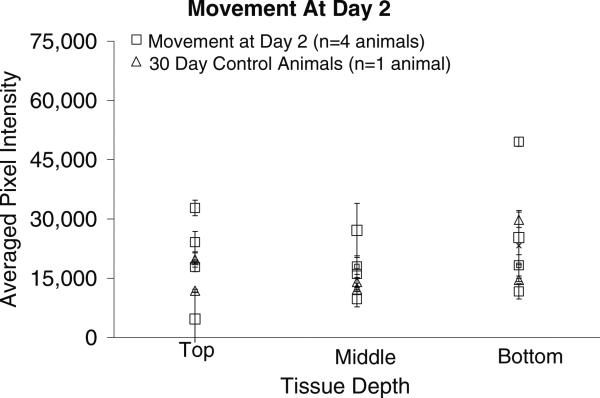
The pixel intensities associated with GFAP levels in the tissue surrounding the implant site for the microelectrodes moved once at day 2 post-implantation and the 30-day stationary controls are shown in figure 4. Comparing the pixel intensities from this cohort with those of the 30-day stationary control pixel intensities indicates that there is no significant difference in the GFAP levels between the top (p < 0.539), middle (p < 0.186) or bottom (p < 0.863) sections of tissue and the corresponding tissue sections of the 30-day control. The p-values of the t-tests are summarized in table 2.
Figure 4.
Graphical representation of GFAP pixel intensities (mean ± std dev over two or three brain sections at each depth) around the implant site for the movement at day-2 cohort and 30-day control animals. The pixel intensities are directly related to the level of GFAP expression in the tissue, with higher pixel intensities indicating higher levels of GFAP and a more significant glial scar. There is statistically no difference between the 30-day control tissue samples and the movement at day-2 tissue samples at the top, middle or bottom of the implant.
Table 2.
Summary of p-values from comparison of pixel intensities from each of the movement cohorts with their respective controls using t-tests. There are three comparisons which show a statistically significant difference in the pixel intensities: (1) bottom sections of day 14 versus 42-day control, (2) middle sections of day 28 versus 56-day control and (3) bottom sections of day 28 versus 56-day control. None of the sections from the day-2 movement cohort have significantly different GFAP expression levels compared to their control.
|
p-values | |||
|---|---|---|---|
| 2-day movement versus 30-day controls | 14-day movement versus 42-day controls | 28-day movement versus 56-day controls | |
| Top | 0.539 | 0.512 | 0.316 |
| Middle | 0.186 | 0.441 | 0.097 |
| Bottom | 0.863 | 0.025 | 0.012 |
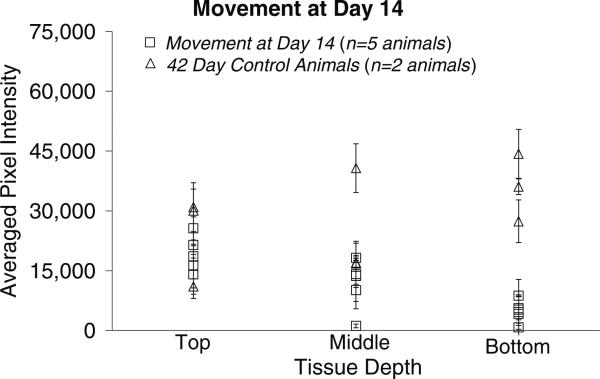
The pixel intensities associated with GFAP levels in the tissue surrounding the implant site for the microelectrodes moved once at day-14 post-implantation and the 42-day stationary controls are shown in figure 6. Comparing the pixel intensities from this cohort with those of the 42-day stationary control pixel intensities indicates that there is no significant difference in the GFAP levels between the top (p < 0.512) or middle (p < 0.441) sections of tissue when compared to corresponding sections of the stationary controls. However, the bottom sections of tissue from the implant region of the movement at day-14 cohort have significantly lower GFAP expression levels compared to the bottom sections of the stationary controls at 42 days (p < 0.025).
Figure 6.
Graphical representation of the GFAP pixel intensities (mean ± std dev over two or three brain sections at each depth) around the implant site for the movement at day-14 cohort and 42-day control animals. The pixel intensities are directly related to the amount of GFAP in the tissue, with higher pixel intensities indicating higher levels of GFAP and a more significant glial scar. There is no significant difference in the levels of GFAP in the top and middle sections. However, among the bottom sections there is a significant difference in GFAP levels between the movement at day-14 cohort and the 42-day control sections.
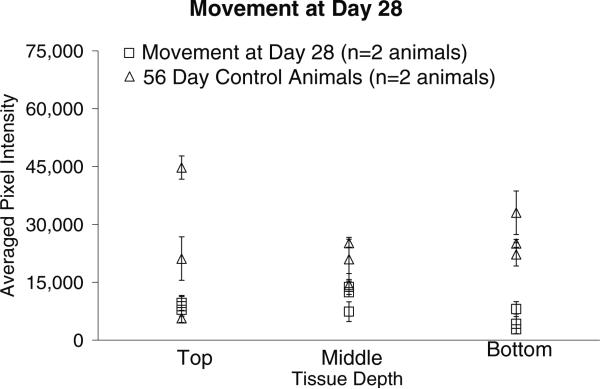
Images in column 1 of figure 7 display GFAP intensity levels around two implant sites within each section from the same animal, as indicated by the arrows. The pixel intensities associated with GFAP levels in the tissue surrounding the implant site for the microelectrodes moved once at day-28 post initial implantation and the 56-day stationary controls are shown in figure 8. Comparing the pixel intensities from this cohort with those of the 56-day stationary control pixel intensities indicates that there is no significant difference in the GFAP levels between the top (p < 0.316) and middle (p < 0.097) sections of tissue and a significant difference in the bottom sections of tissue (p < 0.012) when compared to corresponding sections of the 56-day stationary control.
Figure 8.
Graphical representation of the GFAP pixel intensities (mean ± std dev over two or three brain sections at each depth) around the implant site for the movement at day-28 cohort compared to 56-day control animals. The pixel intensities are directly related to the amount of GFAP in the tissue, higher pixel intensities indicate higher levels of GFAP and a more significant glial scar. There is no significant difference in the levels of GFAP in the top and middle sections. However, in the bottom sections there is a significant difference between the GFAP expression levels of the 56-day controls and the 28-day movement cohort.
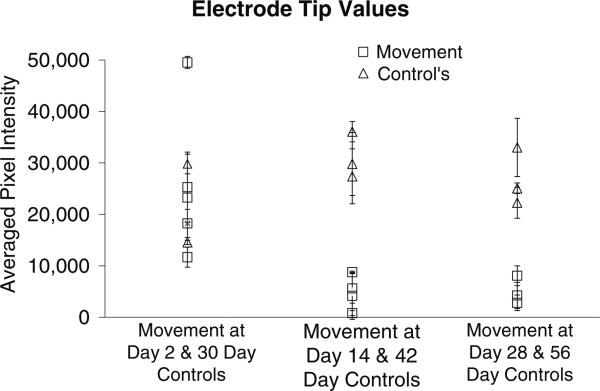
The pixel intensities associated with the bottom sections of the implant site (corresponding to the tip of the microelectrode that moved beyond the initial implant wound for the three cohorts) are compared as follows in groups of two in figure 9: (1) movement at day 2 and 30-day stationary controls, (2) movement at day 14 and 42-day stationary controls and (3) movement at day 28 and 56-day stationary controls. The pixel intensity values represented in figure 9 are summarized in table 3. Interestingly, the lowest pixel intensity corresponding to the microelectrode that was moved at day 2 (11 646 ± 1943 in column 1) is higher than the highest pixel intensities corresponding to the microelectrodes moved at day 14 (8733 ± 203 in column 3) or at day 28 (8047 ± 1940 in column 5).
Figure 9.
Graphical representation of the GFAP pixel intensities (mean ± std dev) only at the electrode tip (labeled ‘bottom’). GFAP expression is lower in the brain tissue when implant is moved at days 14 or 28 when compared to the case when implant is moved at day 2. Implant movement at or after 14-day post-implantation results in lower GFAP expression at the tip of the electrode as assessed 28-day post-movement.
Table 3.
Summary of the pixel intensities (mean ± std dev) for the animals depicted in figure 9. Each row represents the ‘bottom’ section of each of the implants and each column represents a cohort. The numbers in each cell correspond to mean and standard deviation in pixel intensities over two or three brain sections.
| 2-day repositioning | 30-day control | 14-day repositioning | 42-day control | 28-day repositioning | 56-day control |
|---|---|---|---|---|---|
| 25 274 ± 6857 | 29 798 ± 1929 | 8733 ± 203 | 29 798 ± 6124 | 8047 ±1940 | 22 244 ± 3021 |
| 49 533 ± 1170 | 14 538 ± 418 | 4622 ± 8238 | 27 386 ± 6124 | 2778 ± 1509 | 33 017 ± 5648 |
| 23 259 ± 5298 | 5230 ±3391 | 36 078 ± 1962 | 4223 ± 2554 | 25 068 ± 1039 | |
| 11 646 ±1943 | 748 ± 476 | ||||
| 18 246 ± 2719 | 4130 ± 4571 | ||||
| 5587 ± 2881 |
The magnitude of the electrochemical impedance of the microelectrodes at 1 kHz 28-day post-movement of the microelectrode indicates no significant difference between the day-2 movement cohort and the control at day 30 (p < 0.5), and day-14 movement cohort and the control at day 42 (p < 0.5). The Cdl increases with movement in all day-2 and day-14 movement microelectrodes.
Discussion
We have quantified the GFAP expression surrounding the implant sites for microelectrodes which were moved once at day 2, day 14 or day 28 post-implantation. The data from MAP-2 expression levels, however, did not reveal any consistent trends. Repositioning did not seem to have a discernible impact on the MAP2 expression in the implant sites. One of the interesting observations of this study is that repositioning at day 2 post-implantation results in a similar level of GFAP expression in the tissue surrounding the microelectrode when compared to 30-day stationary controls. In other words, the GFAP response to the second repositioning injury is not statistically distinguishable from the initial implantation injury. This is perhaps due to the timing of movement that occurred during the initial implantation injury response when the microglia and macrophages are in an active state and are the primary cells at the site of injury. It is possible that these cells respond to the second movement injury as if it were a continuation of the initial injury. As shown in figures 3, 5 and 7, GFAP signal intensity varies as a function of lateral distance from the microelectrode implant site. In order to assess GFAP around the injury site brain tissue 400 μm immediately adjacent to implantation was assessed. It has been reported in the literature, and in our previous study, that GFAP expression in the tissue projecting away from the implant site extends up to 500 μm in the first few days and becomes more compacted as the wound heals [5]. Therefore, assessing the tissue up to 400 μm around the implant will consistently yield the most significant scarring associated with implantation.
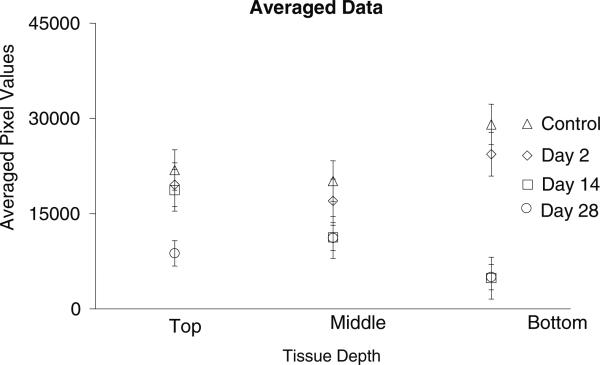
The second interesting observation is that data obtained from movement later in the healing cycle appear to suggest that movement at day 14 and day 28 can yield significantly lower level of GFAP expression in the tissue surrounding the portion of the microelectrode that was repositioned away from the initial implant injury when compared to controls. This observation raises the interesting possibility that moving the microelectrode 14 days or more after implantation might lead to lower levels GFAP expression in the long term around the tip of the microelectrode. This could be due to the fact that the movement occurs after the initial immune response to the implantation injury has subsided. The cells, which are predominant at the microelectrode–tissue interface are now astrocytes; the amount of microglia and macrophages are likely significantly reduced. Therefore, microelectrode movement after this time elicits its own individual immune response which appears to be less intense than the response to initial implantation. This could be due to less surgical disruption of tissue associated with movement and fewer cells injured. Debris such as pieces of pial membrane, cortical and vascular tissue from the surface of the brain are likely carried along by the microelectrode tip as it is initially lowered into the brain [38]. However, such debris is likely to be cleared (phagocytosed) from the microelectrode tip by day-14 post-implantation by the initial inflammatory response. Therefore, the subsequent movement by a microelectrode tip that is free of debris is likely to cause less stresses and inflammatory response after the second movement. The numeric pixel values for the implant cohorts revealed that the lowest pixel intensity in the day-2 movement cohort is numerically higher than the highest pixel intensities seen in the day-14 and day-28 repositioning cohorts as summarized in table 3. In figure 10, the averages of the pixel intensities at the repositioned tip of the microelectrode across all implants within each cohort (day 2, day 14 and day 28) shows that the day-2 movement cohort results in significantly higher GFAP expression levels compared to the movement at day-14 and day-28 cohorts. The sections labeled ‘top’, ‘middle’ or ‘bottom’ depending on their relative position along the length of the microelectrode would correspond approximately to layer I, II and III, respectively, of the rat cortex in the control animals, in which the total implanted depth of the microelectrode was 500 μm. In the movement cohort where the total implantation depth of the microelectrode was 1 mm, sections labeled ‘top’, ‘middle’ and ‘bottom’ would roughly correspond to layers I and II, III and IV, and layer V, respectively, of the rat cortex. The above estimates of cortical layers are made simply based on the depth at which the individual sections were situated.
Figure 10.
Summary of averaged (over all the animals in each cohort) pixel intensities (mean ± std dev) at each tissue depth for all of the movement animals and control animals. Each symbol represents an average of all of the pixel values within that tissue area.
Since the middle sections of the brain tissue around the microelectrode in the movement cohorts are at similar depths as the bottom sections of the tissue in the control cohort, one would expect to see similar or higher GFAP expression levels in the former than the latter assayed at similar time points post-implantation. However, closer examination reveals that the middle sections of the microelectrodes that moved on day 14 or day 28 have significantly lower pixel intensities than the bottom sections of the corresponding control microelectrodes (p < 0.05 in both cases). Since the control experiments and microelectrode movement cohorts were randomized and performed by the same person, a systematic bias is unlikely. More likely, it could be due, in part, to the continual tissue contusion caused by the sharpness and unevenness of the microelectrode tip in the case of the control. In the case of the movement cohorts, movement of the tip to a new location at day 14 or day 28 leaves the middle sections of the brain tissue surrounding the microelectrode shank. Therefore, it is possible that the bottom sections of the tissue (corresponding to the microelectrode tip) surrounding microelectrodes that were moved at day 14 and day 28 will eventually have similar levels of GFAP at 56 days or more post-movement as the 56-day stationary control. Further long-term studies are therefore necessary to confirm if the movement of microelectrodes to a new location post-implantation actually reduces GFAP levels around the microelectrode tip in the chronic condition.
One could argue that the reduced reactive astrocytes seen in the movement cohort is primarily because the microelectrodes in the movement cohort are 1 mm deep compared to 500 μm deep in the control experiments. However, the level of GFAP expression in the day-2 movement cohort in which the microelectrodes are implanted to a depth of 1 mm is similar to the 30-day control cohort suggesting that differences in implantation depth was not an important contributor in this study to the observed differences in GFAP expression levels. One of the goals in this study was to elicit a maximal tissue response due to microelectrode movement at specific time points post-implantation and carefully assess the impact of the time of movement on the tissue response. The rationale for moving the microelectrode over a distance of 400–500 μm was to assess the worst-case outcome in terms of level of tissue response due to microelectrode movement. The underlying assumption in this study was that a one-time maximal displacement of 500 μm (equivalent to the initial implantation depth) at different time-points post-implantation will result in a momentary maximal mechanical stress at the tissue–microelectrode interface. The exact magnitude of this mechanical stress produced is likely to be dependent on time of movement of the microelectrode post-implantation as the constitutive mechanical properties of the tissue immediately surrounding the implant undergoes changes during the weeks following implantation. Judging by the significantly lower levels of GFAP expression seen at the tips of microelectrodes when they are moved at day-14 or day-28 post-implantation, it is also possible that microelectrode movement after 14 days of implantation causes less mechanical stress at the microelectrode–tissue interface than that experienced during the initial implantation. It is possible that the initial insertion through the pial membrane and subsequently the brain itself after a process of tissue dimpling requires larger forces (leading to higher mechanical stresses) than the forces required for moving the microelectrode once they are implanted in the brain.
In addition, the speed of microelectrode movement through the brain tissue also plays an important role in determining tissue damage [38]. In this current study, speed of microelectrode movement during initial implantation and the subsequent movement post-implantation were held constant at 50 μm per every 60 s (0.83 μm s−1). It has been observed by Bjornsson et al that at speeds of 125–500 μms−1 portions of tissue (including pia and vasculature) are carried by the electrode through the brain resulting in significant vascular disruption at all levels of the implant. Furthermore, at these speeds the tissue has no time to respond, and downstream vasculature becomes more vulnerable to damage [38]. Detailed studies assessing the impact of extremely low implant speeds such as 1–10 μm s−1, as used in our studies, are yet to be completed. However, it is hypothesized that these extremely slow speeds could result in less vascular disruption due in part to the increased amount of time that the tissues have to respond to injury and dissipate the stress that is generated during the movement. This hypothesis is applicable to microelectrode movement post-implantation as well. When the repositioning is done at slow speeds, there is possibly less-stress build-up in the tissue and more time for stress to dissipate during movement. Therefore, there is likely less vascular damage and less glial response due to lower mechanical stress.
One of the clear trends observed in the impedance modeling data is that the double-layer capacitance, Cdl, value increases in all but one microelectrode immediately upon repositioning at day 2 and day 14. This is likely due to the recording site of the electrode entering a different tissue compartment with higher extra-cellular ion concentrations. Debris consisting of remnants of cell membrane that get damaged during the second movement and are stuck to the microelectrode tip could also be a factor in increasing the double layer capacitance of the microelectrode after movement.
Conclusions
Movement of the microelectrode at day 2 resulted in GFAP expression that was similar to that of control groups at the end of four weeks of implantation. Interestingly, GFAP expression at the tip of the microelectrodes moved at day 14 or day 28 was lower at the end of four weeks after movement than corresponding control groups implanted for the same duration. Therefore, the emerging strategy of moving microelectrodes post-implantation to seek or track single neuronal activity and improve the consistency and reliability of electrical recordings does not appear to result in any additional tissue damage regardless of the timing of the movement. Surprisingly, the significantly lower GFAP expression at the microelectrode tip 28-day post-movement raises the interesting possibility that moving the microelectrode after 14 days of implantation can be used to lower the electrical interference from reactive astrocytes. GFAP response due to a one-time movement of 500 μm downward into the brain tissue was tested in this study. It is possible that microelectrode movements of smaller displacements downward or movement in the upward direction may result in the microelectrode continuing to be within the initial injury site caused by implantation and consequently not lead to any significant change in the GFAP levels in the long term.
Acknowledgments
The authors would like to thank Arizona Biomedical Research Commission and the NIH (R21NS051773 and R01NS055312) for supporting this research. We would also like to thank Joseph Lawler and Nathan Jackson for help with experiments.
References
- 1.Kuchta J. Neuroprosthetic hearing with auditory brainstem implants. Biomed. Tech. (Berl) 2004;49:83–7. doi: 10.1515/BMT.2004.017. [DOI] [PubMed] [Google Scholar]
- 2.Rauschecker JP, Shannon RV. Sending sound to the brain. Science. 2002;295:1025–9. doi: 10.1126/science.1067796. [DOI] [PubMed] [Google Scholar]
- 3.Tagliati M, Shils J, Sun C, Alterman R. Deep brain stimulation for dystonia. Expert. Rev. Med. Devices. 2004;1:33–41. doi: 10.1586/17434440.1.1.33. [DOI] [PubMed] [Google Scholar]
- 4.McNaughton BL, O'Keefe J, Barnes CA. The stereotrode: a new technique for simultaneous isolation of several single units in the central nervous system from multiple unit records. J. Neurosci. Methods. 1983;8:391–7. doi: 10.1016/0165-0270(83)90097-3. [DOI] [PubMed] [Google Scholar]
- 5.Polikov VS, Tresco PA, Reichert WM. Response of brain tissue to chronically implanted neural electrodes. J. Neurosci. Methods. 2005;148:1–18. doi: 10.1016/j.jneumeth.2005.08.015. [DOI] [PubMed] [Google Scholar]
- 6.Porada I, Bondar I, Spatz WB, Kruger J. Rabbit and monkey visual cortex: more than a year of recording with up to 64 microelectrodes. J. Neurosci. Methods. 2000;95:13–28. doi: 10.1016/s0165-0270(99)00139-9. [DOI] [PubMed] [Google Scholar]
- 7.Stice P, Gilletti A, Panitch A, Muthuswamy J. Thin microelectrodes reduce GFAP expression in the implant site in rodent somatosensory cortex. J. Neural. Eng. 2007;4:42–53. doi: 10.1088/1741-2560/4/2/005. [DOI] [PubMed] [Google Scholar]
- 8.Szarowski DH, Andersen MD, Retterer S, Spence AJ, Isaacson M, Craighead HG, Turner JN, Shain W. Brain responses to micro-machined silicon devices. Brain. Res. 2003;983:23–35. doi: 10.1016/s0006-8993(03)03023-3. [DOI] [PubMed] [Google Scholar]
- 9.Merrill DR, Tresco PA. Impedance characterization of microarray recording electrodes in vitro. IEEE Trans. Biomed. Eng. 2005;52:1960–5. doi: 10.1109/TBME.2005.856245. [DOI] [PubMed] [Google Scholar]
- 10.Kam L, Shain W, Turner JN, Bizios R. Selective adhesion of astrocytes to surfaces modified with immobilized peptides. Biomaterials. 2002;23:511–5. doi: 10.1016/s0142-9612(01)00133-8. [DOI] [PubMed] [Google Scholar]
- 11.McConnell GC, Schneider TM, Owens DJ, Bellamkonda RV. Extraction force and cortical tissue reaction of silicon microelectrode arrays implanted in the rat brain. IEEE Trans. Biomed. Eng. 2007;54:1097–107. doi: 10.1109/TBME.2007.895373. [DOI] [PubMed] [Google Scholar]
- 12.Turner AM, Dowell N, Turner SW, Kam L, Isaacson M, Turner JN, Craighead HG, Shain W. Attachment of astroglial cells to microfabricated pillar arrays of different geometries. J. Biomed. Mater. Res. 2000;51:430–41. doi: 10.1002/1097-4636(20000905)51:3<430::aid-jbm18>3.0.co;2-c. [DOI] [PubMed] [Google Scholar]
- 13.Turner JN, Shain W, Szarowski DH, Andersen M, Martins S, Isaacson M, Craighead H. Cerebral astrocyte response to micromachined silicon implants. Exp. Neurol. 1998;156:33–49. doi: 10.1006/exnr.1998.6983. [DOI] [PubMed] [Google Scholar]
- 14.Biran R, Martin DC, Tresco PA. The brain tissue response to implanted silicon microelectrode arrays is increased when the device is tethered to the skull. J. Biomed. Mater. Res A. 2007;82:169–78. doi: 10.1002/jbm.a.31138. [DOI] [PubMed] [Google Scholar]
- 15.Frampton JP, Hynd MR, Williams JC, Shuler ML, Shain W. Three-dimensional hydrogel cultures for modeling changes in tissue impedance around microfabricated neural probes. J. Neural. Eng. 2007;4:399–409. doi: 10.1088/1741-2560/4/4/006. [DOI] [PubMed] [Google Scholar]
- 16.Aschner M, Allen JW, Kimelberg HK, LoPachin RM, Streit WJ. Glial cells in neurotoxicity development. Ann. Rev. Pharmacol. Toxicol. 1999;39:151–73. doi: 10.1146/annurev.pharmtox.39.1.151. [DOI] [PubMed] [Google Scholar]
- 17.Fawcett JW, Asher RA. The glial scar and central nervous system repair. Brain. Res. Bull. 1999;49:377–91. doi: 10.1016/s0361-9230(99)00072-6. [DOI] [PubMed] [Google Scholar]
- 18.Eng LF, Yu AC, Lee YL. Astrocytic response to injury. Prog. Brain. Res. 1992;94:353–65. doi: 10.1016/s0079-6123(08)61764-1. [DOI] [PubMed] [Google Scholar]
- 19.Fitch MT, Doller C, Combs CK, Landreth GE, Silver J. Cellular and molecular mechanisms of glial scarring and progressive cavitation: in vivo and in vitro analysis of inflammation-induced secondary injury after CNS trauma. J. Neurosci. 1999;19:8182–98. doi: 10.1523/JNEUROSCI.19-19-08182.1999. [DOI] [PMC free article] [PubMed] [Google Scholar]
- 20.Dawson LA, Djali S, Gonzales C, Vinegra MA, Zaleska MM. Characterization of transient focal ischemia-induced increases in extracellular glutamate and aspartate in spontaneously hypertensive rats. Brain. Res. Bull. 2000;53:767–76. doi: 10.1016/s0361-9230(00)00363-4. [DOI] [PubMed] [Google Scholar]
- 21.del Zoppo GJ, Mabuchi T. Cerebral microvessel responses to focal ischemia. J. Cereb. Blood Flow Metab. 2003;23:879–94. doi: 10.1097/01.WCB.0000078322.96027.78. [DOI] [PubMed] [Google Scholar]
- 22.Stoll G, Jander S, Schroeter M. Inflammation and glial responses in ischemic brain lesions. Prog. Neurobiol. 1998;56:149–71. doi: 10.1016/s0301-0082(98)00034-3. [DOI] [PubMed] [Google Scholar]
- 23.Wu VW, Schwartz JP. Mini-review: cell culture models for reactive gliosis: new perspectives. J. Neurosci. Res. 1998;51:675–81. doi: 10.1002/(SICI)1097-4547(19980315)51:6<675::AID-JNR2>3.0.CO;2-8. [DOI] [PubMed] [Google Scholar]
- 24.Polikov VS, Block ML, Fellous JM, Hong JS, Reichert WM. In vitro model of glial scarring around neuroelectrodes chronically implanted in the CNS. Biomaterials. 2006;27:5368–76. doi: 10.1016/j.biomaterials.2006.06.018. [DOI] [PubMed] [Google Scholar]
- 25.Turner JN, Shain W, Szarowski DH, Andersen M, Martins S, Isaacson M, Craighead H. Cerebral astrocyte response to micromachined silicon implants. Exp. Neurol. 1999;156:33–49. doi: 10.1006/exnr.1998.6983. [DOI] [PubMed] [Google Scholar]
- 26.Agnew WF, McCreery DB. Neural Prostheses Fundamental Studies. 1st edn Prentice Hall; Englewood cliffs, NJ: 1990. [Google Scholar]
- 27.Edell DJ, Toi VV, McNeil VM, Clark LD. Factors influencing the biocompatibility of insertable silicon microshafts in cerebral cortex. IEEE Trans. Biomed. Eng. 1992;39:635–43. doi: 10.1109/10.141202. [DOI] [PubMed] [Google Scholar]
- 28.Liu X, McCreery DB, Carter RR, Bullara LA, Yuen TG, Agnew WF. Stability of the interface between neural tissue and chronically implanted intracortical microelectrodes. IEEE Trans. Rehabil. Eng. 1999;7:315–26. doi: 10.1109/86.788468. [DOI] [PubMed] [Google Scholar]
- 29.Nicolelis MA, Dimitrov D, Carmena JM, Crist R, Lehew G, Kralik JD, Wise SP. Chronic, multisite, multielectrode recordings in macaque monkeys. Proc. Natl Acad. Sci. USA. 2003;100:11041–6. doi: 10.1073/pnas.1934665100. [DOI] [PMC free article] [PubMed] [Google Scholar]
- 30.Rousche PJ, Pellinen DS, Pivin DP, Jr, Williams JC, Vetter RJ, Kipke DR. Flexible polyimide-based intracortical electrode arrays with bioactive capability. IEEE Trans. Biomed. Eng. 2001;48:361–71. doi: 10.1109/10.914800. [DOI] [PubMed] [Google Scholar]
- 31.Stensaas SS, Stensaas LJ. The reaction of the cerebral cortex to chronically implanted plastic needles. Acta Neuropathol. (Berl) 1976;35:187–203. [PubMed] [Google Scholar]
- 32.Williams JC, Rennaker RL, Kipke DR. Long-term neural recording characteristics of wire microelectrode arrays implanted in cerebral cortex. Brain. Res. Protoc. 1999;4:303–13. doi: 10.1016/s1385-299x(99)00034-3. [DOI] [PubMed] [Google Scholar]
- 33.Yuen TG, Agnew WF. Histological evaluation of polyesterimide-insulated gold wires in brain. Biomaterials. 1995;16:951–6. doi: 10.1016/0142-9612(95)93121-s. [DOI] [PubMed] [Google Scholar]
- 34.Suner S, Fellows MR, Vargas-Irwin C, Nakata GK, Donoghue JP. Reliability of signals from a chronically implanted, silicon-based electrode array in non-human primate primary motor cortex. IEEE Trans. Neural. Syst. Rehabil. Eng. 2005;13:524–41. doi: 10.1109/TNSRE.2005.857687. [DOI] [PubMed] [Google Scholar]
- 35.Ghovanloo M, Otto KJ, Kipke DR, Najafi K. In vitro and in vivo testing of a wireless multichannel stimulating telemetry microsystem. Conf. Proc. IEEE Eng. Med. Biol. Soc. 2004;6:4294–7. doi: 10.1109/IEMBS.2004.1404196. [DOI] [PubMed] [Google Scholar]
- 36.Seymour JP, Kipke DR. Fabrication of polymer neural probes with sub-cellular features for reduced tissue encapsulation. Conf. Proc. IEEE Eng. Med. Biol. Soc. 2006;1:4606–9. doi: 10.1109/IEMBS.2006.260528. [DOI] [PubMed] [Google Scholar]
- 37.Seymour JP, Kipke DR. Neural probe design for reduced tissue encapsulation in CNS. Biomaterials. 2007;28:3594–607. doi: 10.1016/j.biomaterials.2007.03.024. [DOI] [PubMed] [Google Scholar]
- 38.Bjornsson CS, Oh SJ, Al-Kofahi YA, Lim YJ, Smith KL, Turner JN, De S, Roysam B, Shain W, Kim SJ. Effects of insertion conditions on tissue strain and vascular damage during neuroprosthetic device insertion. J. Neural. Eng. 2006;3:196–207. doi: 10.1088/1741-2560/3/3/002. [DOI] [PubMed] [Google Scholar]
- 39.Albus K, Sinske K, Heinemann U. Independent positioning of microelectrodes for multisite recordings in vitro. J. Neurosci. Methods. 2009;176:182–5. doi: 10.1016/j.jneumeth.2008.09.001. [DOI] [PubMed] [Google Scholar]
- 40.McKown MD, Schadt JC. A modification of the Harper–McGinty microdrive for use in chronically prepared rabbits. J. Neurosci. Methods. 2006;153:239–42. doi: 10.1016/j.jneumeth.2005.10.020. [DOI] [PubMed] [Google Scholar]
- 41.Mountcastle VB, Reitboeck HJ, Poggio GF, Steinmetz MA. Adaptation of the Reitboeck method of multiple microelectrode recording to the neocortex of the waking monkey. J. Neurosci. Methods. 1991;36:77–84. doi: 10.1016/0165-0270(91)90140-u. [DOI] [PubMed] [Google Scholar]
- 42.Muthuswamy J, Okandan M, Jain T, Gilletti A. Electrostatic microactuators for precise positioning of neural microelectrodes. IEEE Trans. Biomed. Eng. 2005;52:1748–55. doi: 10.1109/TBME.2005.855712. [DOI] [PMC free article] [PubMed] [Google Scholar]
- 43.Sato T, Suzuki T, Mabuchi K. A new multi-electrode array design for chronic neural recording, with independent and automatic hydraulic positioning. J. Neurosci. Methods. 2007;160:45–51. doi: 10.1016/j.jneumeth.2006.08.009. [DOI] [PubMed] [Google Scholar]
- 44.Swadlow HA, Bereshpolova Y, Bezdudnaya T, Cano M, Stoelzel CR. A multi-channel, implantable microdrive system for use with sharp, ultra-fine ‘Reitboeck’ microelectrodes. J. Neurophysiol. 2005;93:2959–65. doi: 10.1152/jn.01141.2004. [DOI] [PubMed] [Google Scholar]
- 45.Muthuswamy J, Okandan M, Gilletti A, Baker MS, Jain T. An array of microactuated microelectrodes for monitoring single-neuronal activity in rodents. IEEE Trans. Biomed. Eng. 2005;52:1470–7. doi: 10.1109/TBME.2005.851478. [DOI] [PMC free article] [PubMed] [Google Scholar]
- 46.Holecko MM, II, Williams JC, Massia SP. Visualization of the intact interface between neural tissue and implanted microelectrode arrays. J. Neural. Eng. 2005;2:97–102. doi: 10.1088/1741-2560/2/4/005. [DOI] [PubMed] [Google Scholar]
- 47.Williams JC, Hippensteel JA, Dilgen J, Shain W, Kipke DR. Complex impedance spectroscopy for monitoring tissue responses to inserted neural implants. J. Neural. Eng. 2007;4:410–23. doi: 10.1088/1741-2560/4/4/007. [DOI] [PubMed] [Google Scholar]
- 48.Muthuswamy J, Okandan M, Jackson N. Single neuronal recordings using surface micromachined polysilicon microelectrodes. J. Neurosci. Methods. 2005;142:45–54. doi: 10.1016/j.jneumeth.2004.07.017. [DOI] [PubMed] [Google Scholar]
- 49.Franks W, Schenker I, Schmutz P, Hierlemann A. Impedance characterization and modeling of electrodes for biomedical applications. IEEE Trans. Biomed. Eng. 2005;52:1295–302. doi: 10.1109/TBME.2005.847523. [DOI] [PubMed] [Google Scholar]
- 50.Weiland JD, Anderson DJ. Chronic neural stimulation with thin-film, iridium oxide electrodes. IEEE Trans. Biomed. Eng. 2000;47:911–8. doi: 10.1109/10.846685. [DOI] [PubMed] [Google Scholar]


