Abstract
To explore the mechanisms and evolution of cell-cycle control, we analyzed the position and conservation of large numbers of phosphorylation sites for the cyclin-dependent kinase Cdk1 in the budding yeast Saccharomyces cerevisiae. We combined specific chemical inhibition of Cdk1 with quantitative mass spectrometry to identify the positions of 547 phosphorylation sites on 308 Cdk1 substrates in vivo. Comparisons of these substrates with orthologs throughout the ascomycete lineage revealed that the position of most phosphorylation sites is not conserved in evolution; instead, clusters of sites shift position in rapidly evolving disordered regions. We propose that regulation of protein function by phosphorylation often depends on simple nonspecific mechanisms that disrupt or enhance protein-protein interactions. The gain or loss of phosphorylation sites in rapidly evolving regions could facilitate the evolution of kinase signaling circuits.
Cyclin-dependent kinases (Cdks) drive the major events of the eukaryotic cell-division cycle (1). Comprehensive identification and analysis of Cdk substrates would enhance our understanding of cell-cycle control and provide insights into the mechanisms and evolution of regulation by phosphorylation. We therefore developed methods for comprehensive identification of the sites of Cdk1 phosphorylation on large numbers of substrates in vivo. We used quantitative mass spectrometry to identify sites at which phosphorylation decreased in vivo after specific inhibition of Cdk1 (2). We used Stable Isotope Labeling of Amino Acids in Culture (SILAC) in the cdk1-as1 yeast strain, in which Cdk1 is replaced with a mutant protein engineered to be specifically and rapidly inhibited by the pyrimidine-based inhibitor 1-NM-PP1 (3). Cells of a cdk1-as1; arg4Δ; lys1Δ strain, which require exogenous lysine and arginine to survive, were grown in medium containing lysine and arginine (the ‘light’ culture) or in medium supplied with arginine and lysine labeled with stable heavy isotopes of carbon and nitrogen (13C and 15N) (Fig. S1). This ‘heavy’ culture was treated briefly (15 min) with 10 μM 1-NM-PP1 to inactivate Cdk1-as1. The cultures were then mixed together, lysed, and subjected to trypsinization. Phosphopeptides were purified from the peptide mixture and analyzed by tandem mass spectrometry. The precise sites of phosphorylation were inferred from the mass signature of peptide ion fragments in MS/MS spectra, and the ratio of heavy to light phosphopeptide in the MS spectra was used to infer relative abundance of all phosphopeptides with and without Cdk1 inhibition. We analyzed three different cell populations: an asynchronous population; a culture arrested in mitosis with the spindle poison nocodazole; and a culture arrested in late mitosis by overexpression of a non-degradable cyclin, Clb2-ΔN (2).
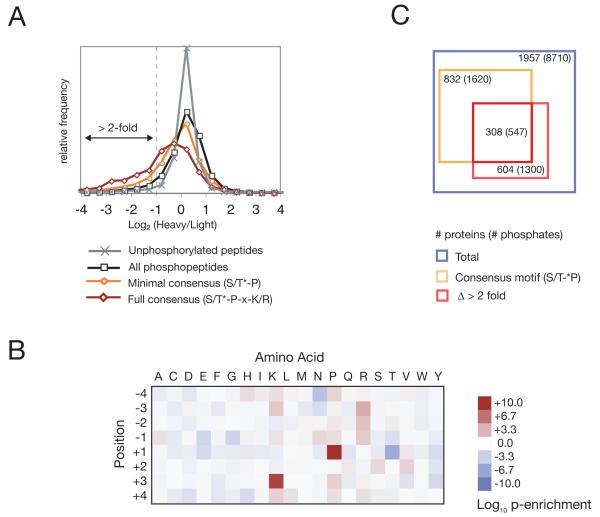
We collected 354,560 MS/MS spectra, of which 74,093 were successfully matched to phosphopeptide sequences. In total, we identified 10,656 unique phosphorylation sites (Database S1), of which 8,710 sites on 1957 proteins were assigned a precise position with >95% confidence (Database S2). The log2 heavy/light (H/L) ratios for non-phosphopeptides were tightly distributed around zero (a 1:1 ratio), indicating that global protein abundance was not affected by brief Cdk1 inhibition, whereas the log2 H/L ratios for phosphopeptides were more broadly distributed (Fig. 1A; see Database S2 for a list of H/L ratios). A leftward shift in the H/L ratio of a phosphopeptide indicates that the abundance of that phosphopeptide decreased when Cdk1 was inhibited, as expected for Cdk1 substrates. Indeed, we observed a leftward shift in peptides phosphorylated at a Cdk1 consensus sequence (S/T*-P, or S/T*-P-x-K/R, where x represents any amino acid and the asterisk indicates the site of phosphorylation), and the phosphopeptides with the lowest H/L ratios (log2 H/L < −3) were enriched for the Cdk1 consensus site (Fig. 1B), indicating that peptides whose phosphorylation decreased most after Cdk1 inhibition were enriched for direct targets of Cdk1. We therefore used two criteria to define a phosphorylation site as a Cdk1 substrate. First, the phosphorylated serine or threonine must be followed by a proline, to conform to the minimal Cdk1 consensus sequence. Second, the phosphopeptide must decline in abundance at least 50% after Cdk1 inhibition (as indicated by log2 H/L < −1) in one or more of our three experiments. Based on this double filtering, 547 unique phosphorylation sites were identified on 308 candidate Cdk1 substrates (Fig. 1C; substrate list in Tables S1, S2).
Fig. 1.
Large-scale identification of Cdk1 substrates in vivo. (A) Distributions of log2 heavy/light (H/L) ratios for unphosphorylated peptides (gray), all phosphopeptides (black) and phosphopeptides containing a minimal (orange) or full (red) Cdk1 consensus phosphorylation motif. (B) Log10 p-values (binomial distribution) for the enrichment (red) or depletion (blue) of each amino acid (columns) at each position flanking the phosphorylated serine or threonine (rows) in phosphopeptides that changed greatly in abundance (log2 H/L < −3) relative to residues flanking serines and threonines proteome-wide. (C) Venn diagram representing the number of proteins and unique phosphorylation sites identified in the three experiments (2). The blue square indicates the total number of proteins and phosphorylation sites for which H/L ratios could be determined rigorously and for which the precise position of the phosphate could be assigned with 95% confidence. The orange square indicates proteins and phosphopeptides containing a minimal consensus motif, and the red square indicates proteins and phosphopeptides that decreased in abundance over 50% after Cdk1 inhibition (log2 H/L < −1). Cdk1 substrates (listed in Table S1) were defined by the overlap between the orange and red squares. Squares are scaled to the number of proteins.
Phosphorylation of Cdk1 consensus sites was observed on 67% (122/181) of proteins previously identified as Cdk1 substrates in vitro (4). 66% (80/122) of these proteins contained sites at which phosphorylation decreased (log2 H/L < −1) following inhibition of Cdk1 (only 45 of 122 are expected if there is no correlation between the experiments in vitro and in vivo; χ2 test p < 10−10).
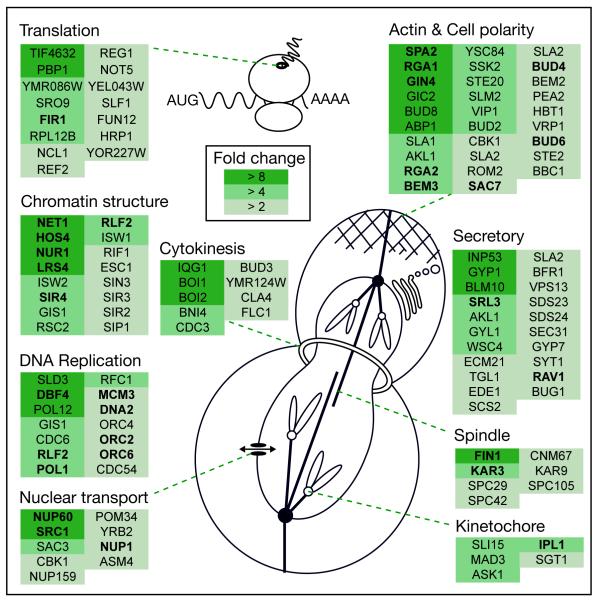
A gene ontology analysis of the candidate substrates revealed a strong enrichment for cell cycle-related functional categories (e.g. GO:0007049, Cell Cycle, hypergeometric p < 10−20) (Table S3). Substrates are also involved in processes that are not traditionally thought of as being under cell-cycle control, including translation, chromatin remodeling, protein secretion, and nuclear transport (Fig. 2).
Fig. 2.
Selected Cdk1 substrates grouped by cellular process. A subset of proteins phosphorylated in a Cdk1-dependent manner are organized into functional groups. The color of the box surrounding each protein corresponds to the fold-change of the most dynamically regulated phosphorylation site of each protein.
To modulate protein function, addition of a phosphate at a specific site can drive a precise conformational change in a protein loop or domain, thereby altering its activity or its interactions with other proteins (Fig. S2A). This mechanism generally relies on coordination of the phosphate by networks of hydrogen bonds and is therefore highly context-dependent and unlikely to arise by a small number of random mutations. Alternatively, addition of phosphates to a protein surface can directly disrupt interactions with other proteins (5, 6) or can generate new interactions with phosphopeptide-binding modules such as 14-3-3, polo-box, WW, and SH2 domains (7, 8) (Fig. S2B). In these cases, the position of the phosphate(s) is less context-dependent and therefore less constrained, and this form of phosphoregulation is expected to arise more readily through random mutation.
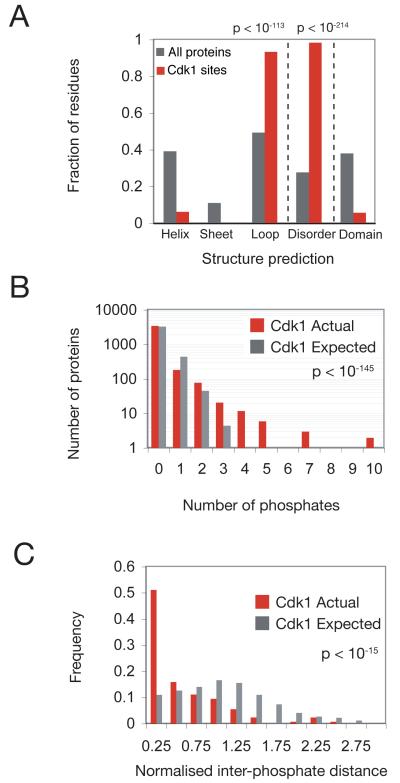
To assess the relative importance of these regulatory mechanisms in Cdk1 function, we analyzed the structural context and conservation of the 547 Cdk1-dependent phosphorylation sites. We found that more than 90% of these sites are predicted to be in loops and disordered regions (Fig. 3A; Table S4), consistent with previous analyses of phosphorylation sites in general (9). Furthermore, we found that many Cdk1 targets have a greater number of phosphates than would be expected by chance (p < 10−145; median Mann-Whitney p-value from comparison of true distribution to 1000 simulations; Fig. 3B), indicating that Cdk1 substrates tend to be phosphorylated at multiple sites. We also found that Cdk1-dependent phosphorylation sites tend to cluster in the primary amino acid sequence (Fig. 3C; p < 10−15; median Mann-Whitney p-value from comparison of true distribution to 1000 simulations), suggesting that multiple phosphorylations modulate the same protein surface.
Fig. 3.
Structural analysis of Cdk1-dependent phosphorylation sites. (A) The predicted structural environment of residues in all proteins in the S. cerevisiae genome (black) and the residues that are phosphorylated in a Cdk1-dependent manner (red). Secondary structure (PsiPred) and disorder (PONDR) prediction algorithms (2) were used to predict the structural environment, and pre-computed domain predictions were downloaded from SGD (ftp://ftp.yeastgenome.org/yeast/). All differences are significant at p < 10−69 (binomial distribution). See Table S4 for details. (B) The distribution of Cdk1-dependent phosphorylation sites per protein (red) is compared to the distribution of sites per protein from simulations in which the same number of phosphorylation sites is randomly scattered across a set of mitotic proteins with probability proportional to protein length (gray). To conservatively estimate the number of proteins present in mitosis, we used the set of 3838 proteins that are detectable by western blotting (21). 1000 simulations were performed and each simulated distribution was compared to the true distribution by calculating the Mann-Whitney p-value. The “Cdk1 Expected” distribution is the average of the 1000 simulations. (C) The distribution of average distances between phosphates within a given protein. The average distances between Cdk1 sites were calculated for all proteins with two or more detected phosphorylation sites (red) and compared to the expected distribution generated by averaging the results of 1000 simulations in which the same number of phosphates was randomly assigned positions within each protein (gray). Because the expected distance between phosphates in a protein depends on the length of the protein, the average distances between phosphates shown here are normalized to protein length. The median Mann-Whitney p-value from comparison of each of the 1000 simulated distributions to the true distribution is shown.
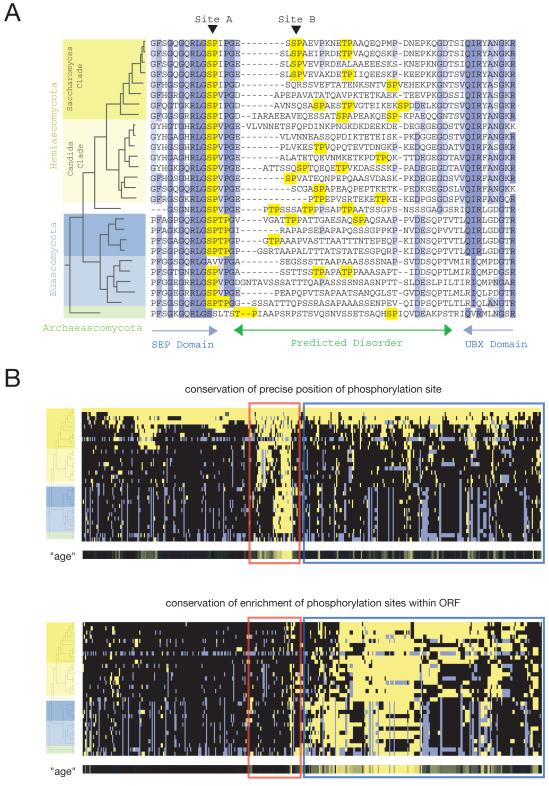
We used the complete genome sequences of 32 fungal species (Fig. S3) to examine the evolution of Cdk1 phosphorylation sites. For each Cdk1 substrate, orthologous sequences were identified and aligned (10, 11). A representative short stretch of alignment from the protein Shp1 is illustrated in Fig. 4A. This region of Shp1 contains two experimentally identified phosphorylation sites with different evolutionary dynamics. The precise position of site A, which lies on the edge of a predicted folded domain, has been preserved throughout the lineage. In contrast, the position of site B, which lies in a predicted disordered region, is conserved only in the closely related sensu stricto Saccharomyces group. However, Cdk1 consensus sites are found at other positions in this region throughout the lineage. Thus, although phosphorylation in the disordered region appears to be conserved, the precise position of the sites is less constrained.
Fig. 4.
Evolution of Cdk1-dependent phosphorylation sites. (A) Representative multiple sequence alignment of 27 orthologs of S. cerevisiae Shp1. The ascomycete phylogeny (Fig. S3) is shown to the left of the alignment. Amino acid conservation is indicated by blue boxes, and minimal Cdk1 consensus motifs are highlighted in yellow. Blue arrows indicate predicted domains and the green arrow indicates a predicted disordered region (PONDR). (B) Hierarchical clusters summarize the evolution of all 547 Cdk1 phosphorylation sites: each row is a different species and each column is a different phosphorylation site. The phylogeny (32 species; see Fig. S3) is represented by a tree at the left. In the top clustergram, yellow indicates that a consensus site (S/T-P) aligns with the phosphorylation site detected in S. cerevisiae (top row). Gray indicates that no single ortholog was detected in that species. In the bottom clustergram, yellow indicates that there is an enrichment of Cdk1 consensus sites in the ortholog of the S. cerevisiae protein we identified as a Cdk1 substrate. Enrichment in each ortholog was assessed by assuming that the expected frequency of a consensus motif is equal to the global frequency across all ORFs in the species, and then using the Poisson distribution to calculate the probability of observing greater than or equal to the actual number of consensus sites. Enrichment was defined by a p-value of less than 0.01 (for example, a typical 400-residue protein is expected to contain 2.8 sites, but must contain 8 or more sites to achieve p<0.01; see Table S5 for details). Two groups are highlighted within the clustergrams: one with conservation of precise site position (red box) and one with conservation of enrichment of consensus sites (blue box). Beneath each clustergram is a metric termed “age”, which summarizes each column as a single conservation score (Fig. S4). More intense yellow indicates greater conservation.
Hierarchical clustering of all 547 Cdk1 phosphorylation sites showed that relatively few phosphorylation sites exhibit strong evolutionary conservation of their precise position (Fig. 4B, top panel, red box; Fig. S4). These phosphorylations might be expected to drive precise conformational changes and might therefore evolve more slowly (Fig. S2A). Indeed, this type of substrate is highly enriched for metabolic enzymes (hypergeometric p = 0.001 for metabolic enzymes with precise-position age more than 0.5 units greater than enrichment age), which are generally more ancient than other ORFs (Fig. S5) and therefore might have evolved this form of regulation long ago.
A larger number of phosphorylation sites showed a different behavior: the precise position of the phosphorylation was conserved only in very closely related species but there was a statistically significant enrichment of consensus sites throughout the lineage (Fig. 4B, bottom, blue box; Table S5). This pattern of evolution is consistent with context-independent forms of regulation as discussed above (Fig. S2B).
Precise phosphorylation site positioning might not be required for regulation of a protein by interactions with phosphopeptide-binding domains. We found a highly significant overlap between Cdk1 substrates and the binding partners of the phosphopeptide-binding domain found in 14-3-3 proteins. S. cerevisiae has two 14-3-3 proteins, Bmh1 and Bmh2. 94 of 278 Bmh1/2-interacting proteins (12) were identified as Cdk1 substrates in our studies (hypergeometric p < 1 × 10⁻²⁰, assuming 3838 total ORFs; Fig. S6A). 14-3-3 proteins typically act as dimers and therefore contain two phosphate-binding sites that bind with higher affinity to multiphosphorylated proteins (13). Indeed, substrates that interact with Bmh1 and Bmh2 were more likely to be enriched with multiple Cdk1 consensus sites (Mann-Whitney p < 10−4, Fig. S6B). Thus, shifting multisite phosphorylation might act in some cases to create generic interactions with phosphate-binding domains.
Several established Cdk substrates are regulated in multiple species by multisite phosphorylation in rapidly evolving regions (Table S6). For example, clusters of Cdk1 phosphorylation sites in components of the pre-replicative complex vary in position during evolution but are still likely to confer the same regulation (14-16). Our work reveals that many Cdk1 substrates are phosphorylated in vivo at rapidly evolving site clusters, which are likely to modify substrate function by simply disrupting or generating protein-protein interactions (Fig. S2B).
An important implication of flexibility in phosphorylation site positioning is that combinatorial control by multiple kinases is readily evolved. Indeed, the protein kinase Ime2, a distant relative of Cdk1 that is expressed solely in meiotic cells, phosphorylates a large number of Cdk1 substrates at distinct sites but can still have the same effect as Cdk1 on substrate function (17).
The evolution of Cdk1 signaling appears to share features with the evolution of transcriptional regulation (Fig. S7). Transcriptional regulators and Cdks both maintain their biochemical specificities (the DNA consensus motif and peptide consensus motif, respectively) over long evolutionary timescales. However, in both cases there is rapid evolution of the intergenic and disordered regions, respectively, that contain these motifs. In transcriptional regulation, DNA sequence motifs can function from many positions relative to the gene being controlled and, because of their short length and sequence degeneracy, can evolve rapidly (18-20). Similarly, many Cdk1 phosphorylation sites are not tightly constrained within the protein target sequence, and the signals for phosphorylation are short and easily evolved. These features allow cell-cycle control mechanisms to adapt rapidly to developmental challenges and opportunities that arise over time.
Supplementary Material
Acknowledgments
22. We thank J. Feldman, R. Fletterick, M. Jacobson, H. Li, M. Matyskiela, P. O’Farrell, M. Sullivan and S. Naylor for helpful comments; A. K. Dunker, E. Garner, C. Oldfield, K. Shimizu and T. Ishida for disorder prediction algorithms; the Broad Institute, Sanger Center, Génolevures and the Joint Genome Institute for genome sequence data; and O. Jensen, C. Zhang and K. Shokat for reagents. This work was supported by grants from the NIH (GM50684 to D.O.M., HG3456 to S.P.G., and GM037049 to A.D.J.) and fellowships from the NSF (L.J.H., B.B.T.).
Footnotes
Supporting Online Material www.sciencemag.org Materials and Methods Figs. S1-S7 Tables S1-S6 References Databases S1, S2
References and Notes
- 1.Morgan DO. The Cell Cycle: Principles of Control. New Science Press; London: 2007. [Google Scholar]
- 2.Materials and methods are available as supporting material on Science online.
- 3.Bishop AC, et al. Nature. 2000;407:395. doi: 10.1038/35030148. [DOI] [PubMed] [Google Scholar]
- 4.Ubersax JA, et al. Nature. 2003;425:859. doi: 10.1038/nature02062. [DOI] [PubMed] [Google Scholar]
- 5.Strickfaden SC, et al. Cell. 2007;128:519. doi: 10.1016/j.cell.2006.12.032. [DOI] [PMC free article] [PubMed] [Google Scholar]
- 6.Serber Z, Ferrell JE., Jr. Cell. 2007;128:441. doi: 10.1016/j.cell.2007.01.018. [DOI] [PubMed] [Google Scholar]
- 7.Yaffe MB, Elia AE. Curr Opin Cell Biol. 2001;13:131. doi: 10.1016/s0955-0674(00)00189-7. [DOI] [PubMed] [Google Scholar]
- 8.Pawson T, Gish GD, Nash P. Trends Cell Biol. 2001;11:504. doi: 10.1016/s0962-8924(01)02154-7. [DOI] [PubMed] [Google Scholar]
- 9.Iakoucheva LM, et al. Nucleic Acids Res. 2004;32:1037. doi: 10.1093/nar/gkh253. [DOI] [PMC free article] [PubMed] [Google Scholar]
- 10.Tuch BB, Galgoczy DJ, Hernday AD, Li H, Johnson AD. PLoS Biol. 2008;6:e38. doi: 10.1371/journal.pbio.0060038. [DOI] [PMC free article] [PubMed] [Google Scholar]
- 11.Edgar RC. Nucleic Acids Res. 2004;32:1792. doi: 10.1093/nar/gkh340. [DOI] [PMC free article] [PubMed] [Google Scholar]
- 12.Kakiuchi K, et al. Biochemistry. 2007;46:7781. doi: 10.1021/bi700501t. [DOI] [PubMed] [Google Scholar]
- 13.Bridges D, Moorhead GB. Sci STKE. 2005;2005:re10. doi: 10.1126/stke.2962005re10. [DOI] [PubMed] [Google Scholar]
- 14.Moses AM, Heriche JK, Durbin R. Genome Biol. 2007;8:R23. doi: 10.1186/gb-2007-8-2-r23. [DOI] [PMC free article] [PubMed] [Google Scholar]
- 15.Moses AM, Liku ME, Li JJ, Durbin R. Proc Natl Acad Sci U S A. 2007;104:17713. doi: 10.1073/pnas.0700997104. [DOI] [PMC free article] [PubMed] [Google Scholar]
- 16.Drury LS, Diffley JF. Curr Biol. 2009;19:530. doi: 10.1016/j.cub.2009.02.034. [DOI] [PubMed] [Google Scholar]
- 17.Holt LJ, Hutti JE, Cantley LC, Morgan DO. Mol Cell. 2007;25:689. doi: 10.1016/j.molcel.2007.02.012. [DOI] [PMC free article] [PubMed] [Google Scholar]
- 18.Wray GA, et al. Mol Biol Evol. 2003;20:1377. doi: 10.1093/molbev/msg140. [DOI] [PubMed] [Google Scholar]
- 19.Carroll SB, Grenier JK, Weatherbee SD. In: From DNA to diversity: molecular genetics and the evolution of animal design. Malden, editor. vol. ix. Blackwell Pub.; 2005. p. 258. [Google Scholar]
- 20.Tuch BB, Li H, Johnson AD. Science. 2008;319:1797. doi: 10.1126/science.1152398. [DOI] [PubMed] [Google Scholar]
- 21.Ghaemmaghami S, et al. Nature. 2003;425:737. doi: 10.1038/nature02046. [DOI] [PubMed] [Google Scholar]
Associated Data
This section collects any data citations, data availability statements, or supplementary materials included in this article.


