Abstract
Background
Previously, we showed that the cardioversion threshold (CVT) for ventricular tachycardia (VT) is phase-dependent, when a monophasic shock (1MP) is used. I
Objective
In this study, we aimed to extend these findings to a biphasic shock (1BP), and to compare efficacy of phase-independent multiple monophasic (5MP) and biphasic shocks (5BP).
Methods
Panoramic optical mapping with Blebbistatin (5 µM) was performed in post-MI rabbit hearts (n = 8). Flecainide (1.64 ± 0.68 µM) was administered to promote sustained arrhythmias. 5MP and 5BP were applied within one VT cycle length (CL). Results were compared to 1BP and antitachycardia pacing (ATP).
Results
We observed monomorphic VT with CL = 149.6 ± 18.0 ms. Similar to 1MP, CVTs of 1BP were found to be phase-dependent and the max vs. min CVT was 8.6 ± 1.7 vs. 3.7 ± 1.9 V/cm, respectively (p = 0.0013). Efficacy of 5MP was higher than 1BP and 5BP. CVT was 3.2 ± 1.4 vs. 5.3 ± 1.9 V/cm, for 5MP vs. 5BP, respectively (p = 0.00027). 5MP vs. averaged 1BP CVT was 3.6 ± 2.1 vs. 6.8 ± 1.5 V/cm, respectively (p = 0.00024). ATP was found completely ineffective in this model.
Conclusions
Maintenance of shock-induced virtual electrode polarization (VEP) by multiple monophasic shocks over a VT cycle is responsible for unpinning of reentry leading to self-termination. Elimination of VEP by shock polarity reversal during multiple biphasic shocks proved ineffective. A significant reduction in CVT may be achieved by applying multiple monophasic shocks within one VT CL or one single shock at the proper coupling interval.
Keywords: Ventricular tachycardia, Cardioversion, Optical mapping, Infarction
INTRODUCTION
Prior myocardial infarction (MI) is manifest in 75% of victims.1, 2 The most common event leading to SCD is ventricular tachycardia (VT) degenerating into ventricular fibrillation (VF). Sustained VT in patients with chronic MI is predominately found to be monomorphic VT, which is caused by stable reentry.3, 4 The mechanism of reentry in ischemic heart disease relates to electrical remodeling at the infarct border zone (IBZ) which refers to the region of functioning myocytes at the edge of myocardial scars, which is characterized by slow and more heterogeneous conduction properties.5–7
The risk of arrhythmic death is found to be higher than that of non-arrhythmic death in patients over a two-year period after MI.8 Radiofrequency catheter ablation is successfully used to interrupt the reentrant circuit. But there are risks associated when the patient has to remain in VT for a relatively long period of time required for the selection of ablation sites. Moreover, VT of other morphologies may reoccur and cause SCD even if the ablation procedure was successful.4, 9, 10 ICD therapy, which is now used as the primary treatment in patients with serious ventricular arrhythmias, has higher efficacy than antiarrhythmic drug therapy in preventing SCD in high-risk post-MI patients.11–14 Therefore, the defibrillation therapy for post-MI patients deserves further studies and improvements, especially in the model of chronic MI.
Previously, we have shown that the CVTs of a single monophasic shock (1MP) for sustained VT, in a model of isolated rabbit RV preparations with acute MI and in the intact rabbit hearts with chronic MI, depend on the VT cycle length (CL) and the coupling interval of the cardioversion shock.15, 16
The goals of this study are: 1) to provide deeper insights into mechanisms of arrhythmia and cardioversion in the rabbit model of chronic MI; 2) to explore whether the CVTs of a single biphasic shock (1BP) for sustained VT are also phase-dependent; and 3) to compare the efficacy of phase-independent multiple monophasic and biphasic shocks in this infarct rabbit model.
MATERIALS and METHODS
Survival Surgery
The experimental protocol was approved by the Institutional Animal Care and Use Committee of Washington University. Nine New Zealand White rabbits of either sex were used in this study. The infarction was created by left coronary ligation during in vivo survival surgery as previously described.17 One rabbit died of congestive heart failure and subsequent pulmonary effusion 10 days after the surgery. Therefore, eight rabbits with chronic MI were used for in vitro experiments.
Heart Preparation
Rabbits were allowed to heal for an average of 102 ± 41 days before acute optical mapping experiments. Rabbits were injected intravenously with sodium pentobarbital (50 mg/kg) and 1000–2000 U heparin and the heart was removed Langendorff-perfused and optically mapped as previously described.18 To eliminate the motion artifacts in optical recordings, we used Blebbistatin (5µM, BB; Fisher Scientific, Fair Lawn, NJ).19
Acute Experimental Protocol
Imaging was performed using a panoramic imaging system as previously described.20, 21 Flecainide was used to promote sustained (lasting more than 3 minutes) ventricular arrhythmias in rabbit hearts. A dose of flecainide started with 0.5µM and was increased at a step of 0.5µM until sustained ventricular arrhythmia could be induced by burst pacing or a multiple shock protocol (4 pulses, 5 V/cm, 130–170 ms coupling interval). For the same VT morphology, five monophasic shocks (5MP) with duration of 10 ms (Online Figure 1A) and five biphasic shocks (5BP) with durations of 6 ms for the first phase and 4 ms for the second phase (Online Figure 1C) were applied within one VT CL. The ratio between the 1st and 2nd phase leading edge voltages was 2:1. Besides 5MP and 5BP, 1BP (Online Figure 1D) was also applied at various phases throughout one CL for the same VT morphology. All the cardioversion shocks were applied from two external stainless steel mesh electrodes, which were configured and connected to the pulse generator as previously described.16 CVTs were determined for each shock waveform. Antitachycardia pacing (ATP, 8 pulses, 88% of VT CL) was applied in 6 hearts, 6 trials per heart.
Data Analysis
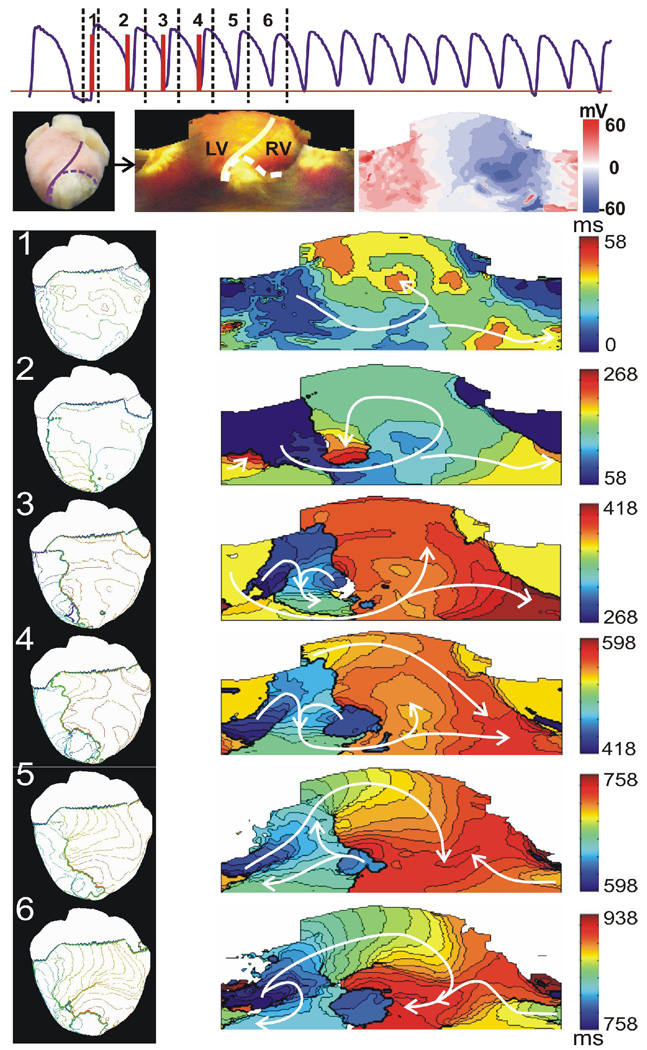
A 3D geometry of the heart was reconstructed and optical signals were registered with the epicardial surface as previously described.20, 21 The epicardial geometry is represented by spherical coordinates (θ, φ, r), where (θi, φi) is an evenly spaced grid, which can be easily redrawn on a 2D plane. A 2D unwrapped epicardium map is shown in the middle panel of Figure 1. Although unwrapping the 3D geometry to a 2D plane causes distortion at the apex, the 2D grid is very useful in calculating and visualizing epicardial data for which the analyses do not involve distance between data points, for example, the calculation of phase maps. In all 2D unwrapped maps the anterior septum is located on the middle.
Figure 1.
Initiation of a stable VT by multiple shock protocol. Top: Optical signal (purple) showing that a VT was induced by four monophasic shocks (red, 5 V/cm, 163 ms between each shock). Numbers 1–6 correspond to the time windows of activation maps 1–6 in the lower panels, respectively. Mid: Left panel is a digital photograph of the anterior view of the heart. Middle panel is the 2D unwrapped epicardium map. The solid line represents the septum. Infarct region is indicated with a dashed line. Right panel is a 2D unwrapped map of shock-induced VEP for a 5 V/cm 1MP. Bottom: Six successive activation maps show the process of the initiation of a stable reentrant circuit. Left column shows anterior view of 3D activation maps. Right column contains 2D unwrapped activation maps.
CVTs of different shock waveforms were compared. Comparisons of each pair were made for the same VT morphology and then averaged for all the morphologies. A paired Student’s t-test was used, and p < 0.05 was considered statistically different.
RESULTS
Initiation of sustained ventricular arrhythmias
Sustained VT could not be induced in this model by either multiple plateau-phase shocks or burst pacing. All induced ventricular arrhythmias were short-lived meandering rotors that self-terminated within several seconds. Therefore, we used flecainide (1.64 ± 0.68 µM) to promote sustained VT. The effective refractory period (ERP) was 183 ± 11 ms before administration of flecainide, and increased to 198 ± 15 ms thirty minutes after administration of flecainide (p=0.0005).
Multiple shocks (CL=125–160ms) were the most effective way to induce VT. Figure 1 shows a representative example of initiation of VT by the multiple shocks. The first shock was applied following 1 minute of continuous pacing (CL=300ms). The VEP pattern of 1MP (5 V/cm) is shown in Figure 1, the rightmost one in the middle panel. The first activation map in Figure 1 shows the epicardial activation sequence after a diastolic field excitation. In the first activation map, the depolarized region was excited first. The wave front spread across the apex toward the base of the heart and excited the hyperpolarized area. A counterclockwise reentry close to the infarct region is observed in activation map 2 and 3. A new wave front was induced by the last shock in activation map 4. After the shock sequence, a clockwise reentry meandered for a short time and then stabilized at the IBZ forming a mother rotor (See activation map 5 and 6).
Mechanism of sustained ventricular arrhythmia in CMI
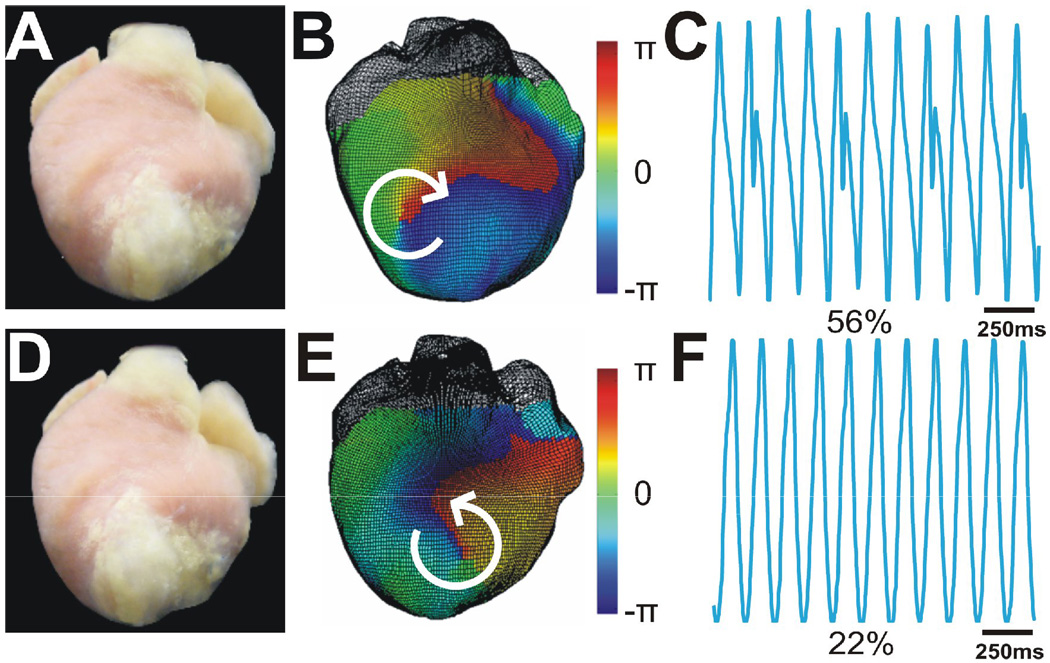
A total of 95 sustained VTs were induced in 8 hearts. They were monomorphic VTs with CL=149.6±18.0ms. We identified 28 different ECG morphologies of VT (3.5±0.9 VT morphologies per heart). A mother rotor, anchored to the infarct region, was the primary mechanism of sustained VT in 89% (25 of 28) morphologies. Figure 2 shows phase maps and Lead I ECG recordings of two main VT morphologies (56% inductions for the clockwise reentry and 22% inductions for the counterclockwise, respectively) in a representative heart. Similar patterns were observed in all hearts.
Figure 2.
Two main morphologies of sustained stable VT in one heart. A. Photograph of anterior view of heart. Infarct region is white tissue from mid LV to apex. B. 3D phase maps of stable reentrant VTs rotated clockwise and anchored at IBZ. C. Lead I ECG during clockwise VT. This was the predominant VT morphology which appears at 56% inductions. The small peak that appeared every three beats indicates 3:1 retrograde excitation of atria during VT. D-F. Similar panels as A,B, and C only for a second primary VT morphology (22% inductions) which was counter-clockwise.
Efficacy of Antitachycardia Pacing
All ATP trials failed to terminate the sustained VT.
Termination of sustained VT by a single biphasic shock
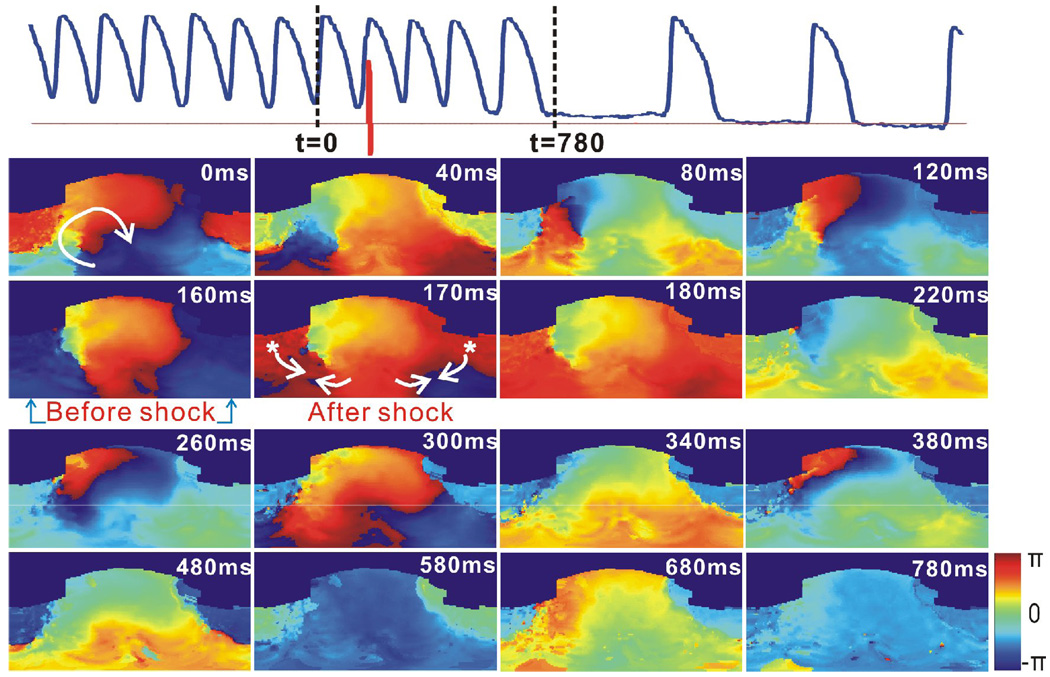
Figure 3 shows an example of 1BP applied at an appropriate phase, and terminated a sustained stable VT after three post-shock extra beats. The shock, with an amplitude of 4 V/cm, was applied at t=160ms when the reentry wave front just arrived at the apex. The shock-induced secondary source generated a new wave front propagating in the direction opposite to the reentry wave front. The excitable gap in the reentry circuit was completely eliminated, and the reentry detached from the IBZ anchoring site. After the unpinning of the reentry, the arrhythmia meandered for three extra beats and then self terminated.
Figure 3.
Termination of stable VT by 1BP applied at the proper phase. Heart and VT morphology correspond to Figure 1 and 2. Top: Optical action potential (blue) shows that VT terminated after 1BP (red, 4 V/cm, t=160 ms). Lower panels are 2D wrapped phase maps from t=0 to t=780 ms. Asterisks indicate shock-induced secondary sources. Arrows represent the directions of the wave front propagation.
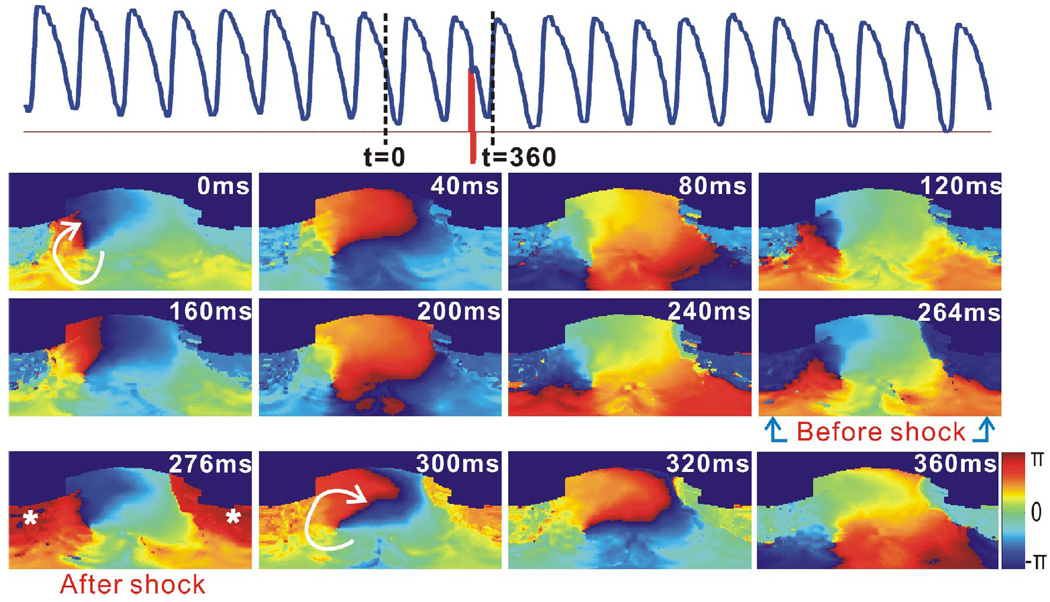
Figure 4 shows an example of cardioversion failure, when the shock was applied at the inappropriate phase of the reentry. As shown in the phase map at t=264, a shock, with a strength of 4 V/cm, was applied when the reentry wave front spread most of the right ventricle, and was about to turn around toward the left ventricle. The posterior and lateral RV base was excited simultaneously by the shock-induced VEP effect and the reentry wave front. However, there existed a large excitable area in the clockwise propagation direction of the reentry wave front, at the anterior RV base, after the shock at t=276 ms. Moreover, the greater refractory area in front of the reentry wave front at t=320 ms, compared to the same phase of VT at t=40 ms, became fully excitable at t=360 ms. Therefore, the reentry persisted and the shock failed.
Figure 4.
Failure of cardioversion due to the improper application time of 1BP. This VT had the same morphology as that in Figure 3. Top: Optical action potential (blue) shows the cardioversion failure of a 1BP (red, 4 V/cm, t=266 ms). Lower panels are 2D wrapped phase maps.
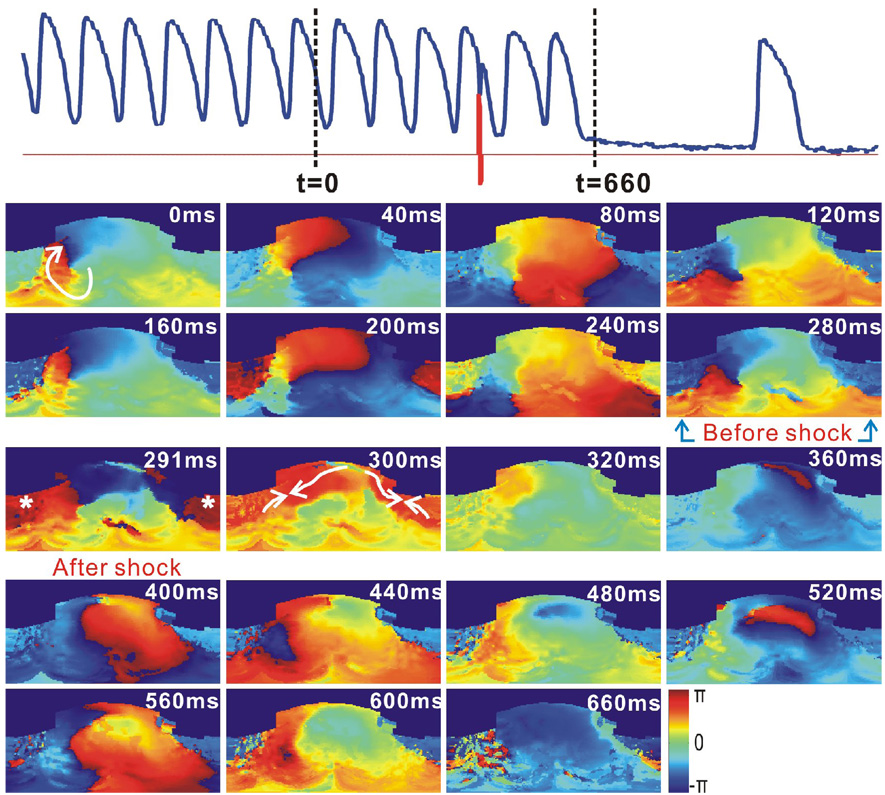
Figure 5 shows an example that an inappropriate application time requires a higher CVT. As shown in the phase map at t=280 ms, the shock with a strength of 8 V/cm is applied at the same phase of reentry as that in Figure 4. In the phase map at t=291 ms right after the shock, we observe two regions, which were effected by the shock-induced VEP. Besides the depolarized region (red), there is a hyperpolarized region (blue) at the anterior LV and RV base. A faster conduction occurred in this example, compared to the one shown in Figure 4, because a stronger shock produces deeper deexcitation.22 Therefore, the rapid propagation through the excitable regions, which is shown in the phase map at t=300 ms, led to the elimination of excitable gaps soon after the shock and therefore a successful unpinning. The arrhythmia self-terminated after meandering for two extra beats.
Figure 5.
Termination of stable VT with improper application time of cardioversion shock requires higher energy. This VT had the same morphology as previous figures. Top: Optical action potential (blue) showing that VT was terminated by 1 BP shock (red, 8 V/cm, t=281 ms). Lower panels are 2D wrapped phase maps.
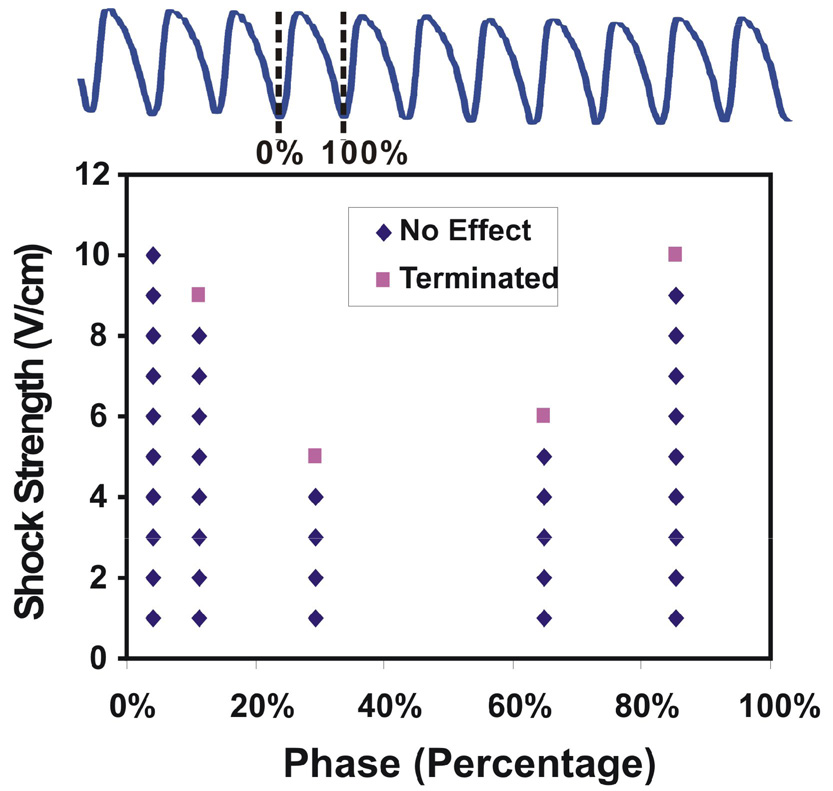
Figure 6 shows a representative plot of coupling intervals versus CVTs of 1BP for one VT morphology, after recalculating the actual shock application time and the exact VT CL. In this example, the minimum CVT is 5 V/cm at 29%, while the maximum CVT for this VT morphology is more than 10 V/cm since the shock strength of 10 V/cm failed at 4% of CL. This difference in CVTs is significant in all eight hearts, where the maximum vs. minimum CVT of 1BP applied at various phases was 8.6 ± 1.7 vs. 3.7 ± 1.9 V/cm, respectively (p=0.0013). Therefore, similar to our previous results on 1MP, the CVTs of 1BP are phase-dependent and the appropriate time of shock (reentry vulnerability window) varies with the VT morphology.
Figure 6.
Plot of the application phases of the shock versus CVTs with 1BP for the VTs with a same morphology. The application phase varied within one VT CL. Shock strength started with 1 V/cm and was increased by 1 V/cm until VT was terminated or the shock strength reached the maximum amplitude we could deliver (10 V/cm). The CVT varied greatly as a function of the application phase.
Termination of sustained VT by five monophasic and five biphasic shocks
Due to the phase-dependent efficacy of both 1MP and 1BP, successive multiple pulses within one VT CL were explored. We used five pulses in order to cover the whole phase grid which we scanned separately with one single shock. In eight infarcted hearts, the CVT of 5MP versus 5BP was 3.2 ± 1.4 vs. 5.3 ± 1.9 V/cm, respectively (p=0.00027).
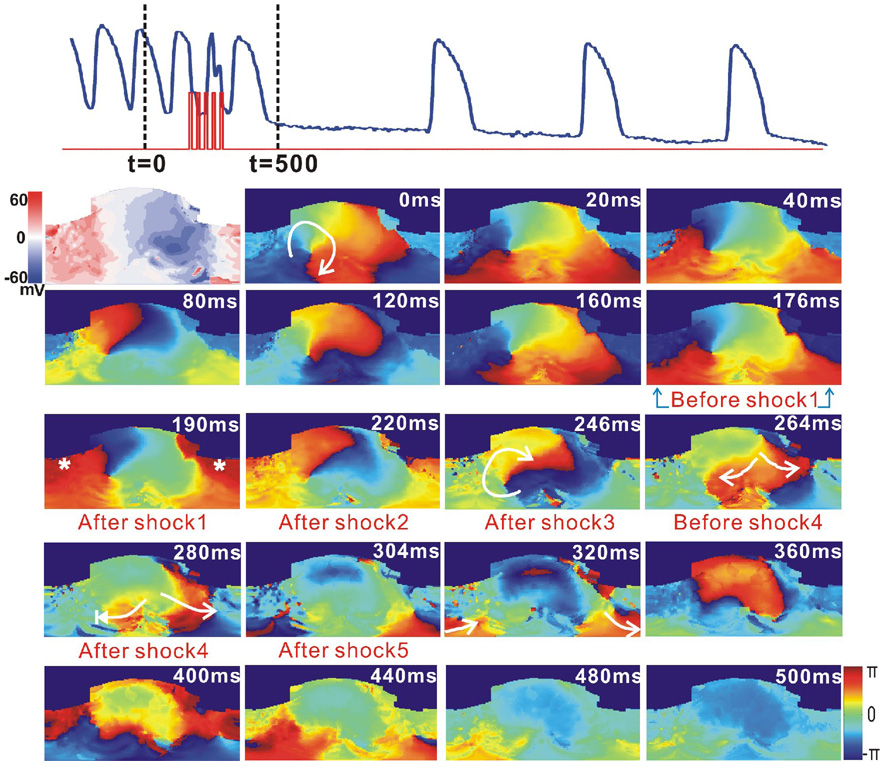
Figure 7 shows the application of 5MP with strength of 4 V/cm terminated a stable reentrant VT after one post-shock beat. The phase maps from 0 to 120 ms show a nearly complete VT reentry. As shown in the phase map at t=190 ms, the depolarized region (red) consumed part of the excitable gap. The remaining four shocks provided additional depolarization of already depolarized myocardium in this region via VEP effect. Therefore, the clockwise reentry wave front was halted when it propagated to the refractory area at t=264 ms, and the wave front vanished at t=280 ms after the fourth shock.
Figure 7.
Termination of VT by 5MP applied within one VT CL. Top: Optical action potential (blue) shows that VT unpinned and self-terminated after application of 5MP (red, 4 V/cm, t=177 ms). The first panel below the optical trace is a VEP map measured from a 1MP shock (5V/cm) applied at the plateau-phase. The other panels are 2D unwrapped phase maps.
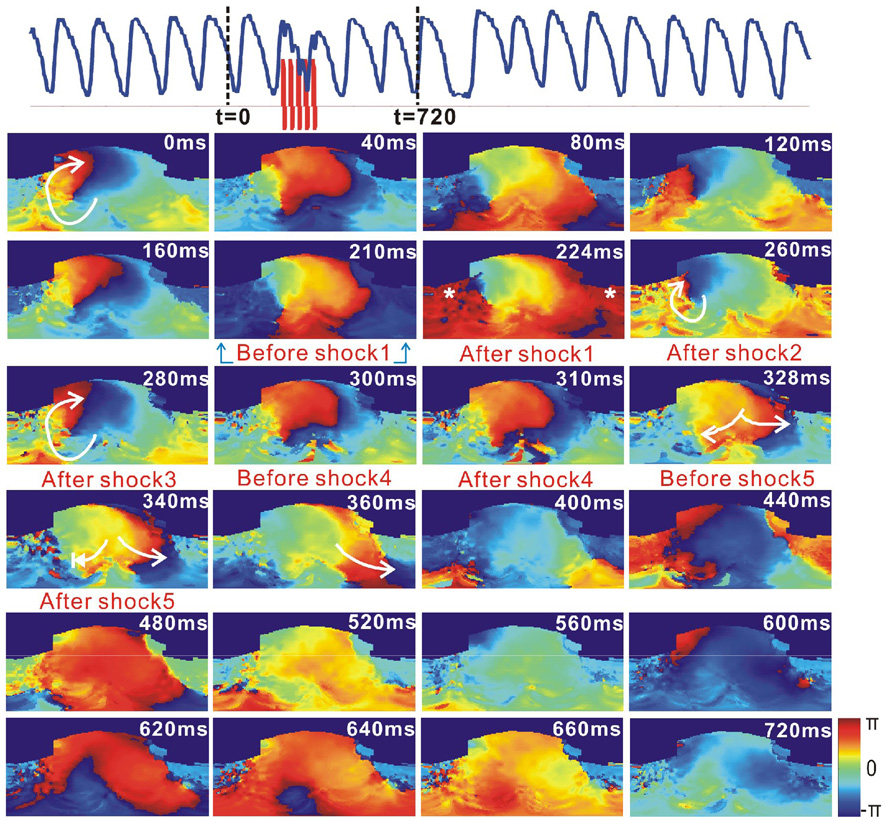
Figure 8 shows an example of a reentrant VT destabilized by the application of 5BP with strength of 5 V/cm. The first biphasic shock excited part of RV, as shown in the phase map at t=224 ms. The following four shocks prolonged the refractory period of the same area, which was excited by the first shock. After the last shock, the clockwise wave front encountered the refractory region and the reentry circuit was disrupted and destabilized. However, this arrhythmia self-terminated after meandering for approximately one minute beyond the administration of the shocks, unlike the one shown in Figure 7.
Figure 8.
Destabilization of stable VT by 5BP. Top: Optical action potential (blue) shows that VT was destabilized after application of 5BP (red, 5 V/cm, t=213 ms). Lower panels are 2D wrapped phase maps. Termination of this VT was not recorded in this file. However, it self-terminated after approximately one minute.
For all the VT morphologies, a maximum CVT of 1BP is higher than that of 5MP: 8.8 ± 1.2 vs. 3.2 ± 1.2 V/cm, respectively (p=0.00001). Interestingly, 5MP has nearly a two-fold lower CVT than averaged 1BP CVT at 3.6 ± 2.1 vs. 6.8 ± 1.5 V/cm, respectively (p=0.00024). Meanwhile, CVT of 5MP is similar to the minimum CVT of 1BP at 4.3 ± 1.9 vs. 4.9 ± 2.7 V/cm, respectively (p=0.37).
DISCUSSION
In this study, we have demonstrated that (1) in accordance with our previous studies on 1MP, 1BP has a strong phase-dependent efficacy in terminating monomorphic VT.15, 16; (2) an application of 5MP during one cycle of VT may offer a novel approach to cardioversion, which is not phase dependent; (3) in contrast to single shock cardioversion, a 5-pulse cardioversion approach is more efficacious with monophasic shocks compared to biphasic shocks; (4) ATP, applied from RV endocardium, is not efficient in this model of VT.
The evolution of defibrillation therapy from its initial discovery by Prevost and Bettelli included significant work on optimization of the defibrillation waveform.23 The original study of Prevost and Battelli reported the possibility of defibrillation by both alternating current (AC) and capacitor discharge energy delivery. However, during the 1st half of the 20th century, defibrillation studies were primarily focused on AC defibrillation, including seminal reports on the first clinical defibrillation in open heart and closed chest configurations.24, 25 Gurvich was the first to demonstrate significantly higher efficacy of DC defibrillation as compared to AC, including first monophasic and then biphasic shocks.26, 27 Following his lead during the second half of the 20th century, defibrillation therapy evolution focused on DC shock defibrillation by optimizing the biphasic waveform. Yet, multiple pulse electrotherapies remained under investigation in basic electrophysiology laboratories.28 Success of this approach is evident from the widespread application of antitachycardia pacing for treatment of VT.
In clinical trials, ATP has been approved in order to terminate 90% of spontaneous VT with a CL longer than 300 ms.29–31 Wathen MS et al applied 1~3 ATP trains to fast VTs which are defined by a CL 240–320 ms, and successfully terminated 84% of episodes with mean CL 280–320 ms versus 69% of episodes with mean CL 240–280 ms.32 However, in this study, ATP applied from RV endocardium did not terminate the sustained monomorphic VT. Thus, the efficacy of termination of VT by ATP may well depend on the nature of VT; for example, the VT CL, the conduction velocity, and the methods used to initiate VTs. Besides, the location of the pacing electrode, with respect to the myocardium infarct may also affect the success rate of this therapy.33
Sustained VT could not be induced, in all eight rabbit hearts with chronic myocardium infarct, without the administration of Flecainide (1.64 ± 0.68 µM), which is a class IC anti-arrhythmic drug. Flecainide has been shown to have significant ventricular proarrhythmic effects, such as converting unsustained VT to sustained VT, by decreasing both the longitudinal and transverse conduction velocity of ventricular myocardium without blocking the central common pathway in healing infarcts.34, 35 In this study, 95 sustained ventricular arrhythmias were monomorphic VT, 89% of which are observed to be rotors anchored to IBZ. We also observed shock-induced polymorphic VT whose rotor kept meandering until it self-terminated before achieving stabilization at IBZ. Flecainide slowed the conduction and shortened wavelength, which allowed circus movement in the dimension of rabbit heart. Ischemia or hypoxia in patients also promotes arrhythmia by reducing the conduction velocity. Therefore, the model in this study can be used to further understand the mechanism of initiation and termination of VT in the patient with myocardium infarct under the condition of ischemia and/or hypoxia.
We observed the same phase-dependency of 1BP as 1MP in termination of monomorphic VT in this model. 1BP applied at the appropriate phase could successfully unpin the VT reentry with relatively low shock strength by creating a new post-shock wave front that activates all the excitable gaps in the loop ahead of the reentry wave front. Consequently, the VT self-terminated after several extra beats (Figure 3). For 1BP applied at an inappropriate phase, it fails because it could not eliminate all the excitable gaps (Figure 4). It could also fail by changing the VT morphology instead of terminating it. However, with higher shock strength, an improperly-timed biphasic shock could unpin reentry by causing rapid propagation through newly excitable regions, which results in the elimination of excitable gaps and successful cardioversion (Figure 5). Therefore, elimination of the excitable gap by shock-induced depolarization (Figure 3) or hyperpolarization (Figure 5) is a crucial way to interrupt the reentrant circuit as well as the main mechanism of cardioversion for this model. Since the shock-induced VEP pattern is settled, if we could sense the reentry wave front and apply the shock before the reentry wave front reaches the depolarized region of the VEP, reentry can be terminated with lower shock strengths.
In our previous study, the maximum and minimum of 1MP applied at different phases of VT were found to be: 7.75 ± 1.89 V/cm versus 4.13 ± 1.55 V/cm, p=0.005.16 We would like to compare the cardioversion efficacy between 1MP and 1BP in this study. However, each experiment already lasts 8~10 hours without including the 1MP protocol. Moreover, our animal model is exactly the same as the previous study. Therefore, we can rely on the results from the previous study, which suggest that 1BP has a similar efficacy with 1MP.
Due to the phase-dependency of 1MP and 1BP, we studied the phase-independent multiple pulses. We found that multiple pulses unpinned reentry VT by maintaining the shock-induced depolarization effect, which sustained the tissue refractory until the reentry wave front was annihilated. The CVT of 5MP was approximately one half lower than that of 5BP. This is because the sequential multiple monophasic pulses reinforce the shock-induced VEP effect, which could keep the tissue refractory. In contrast, the second phase of the biphasic shocks reverses the VEP effect of the first phase and prevents maintenance of the secondary source. Therefore, after comparison among 1BP, 1MP, 5BP, and 5MP, we found that 5MP was phase-independent and the most efficient waveform for the low-voltage cardioversion of the rabbit heart with MI.
STUDY LIMITATIONS
In order to optically record the electric activity on the surface of the heart and to register the optical recordings to the myocardium, we have to use the excitation-contraction uncoupler, Blebbistatin. This agent frees up adenosine triphosphate that would be used by contraction and thus improves metabolic state of the heart including possible protection against arrhythmia.
Our fluorescence optical mapping system only allows us to study the action potentials from epicardium. The electric activity of septum and endocardium cannot be mapped. Therefore, those intramural reentry circuit or post-shock breakthrough cannot be explored in this study.
In order to panoramically map the whole ventricular surface of the rabbit heart, the spatial resolution is reduced to approximately 1.7×1.7 mm2, which is relatively low with respect to the size of a single myocardial cell. Each channel of photodiode array also collects optical signal scattered from neighboring tissues due to the light scattering effect. Moreover, the infarct region contains largely fibrotic scars intermingled with surviving myocardial fibers and adhesions from the pericardium caused by the surgery. Therefore, the signal from the infarct region has lower signal-to-noise ratio than normal tissue.
Supplementary Material
Acknowledgments
SOURCES OF FUNDING
This work was supported by NIH grant R01HL-067322.
Footnotes
Publisher's Disclaimer: This is a PDF file of an unedited manuscript that has been accepted for publication. As a service to our customers we are providing this early version of the manuscript. The manuscript will undergo copyediting, typesetting, and review of the resulting proof before it is published in its final citable form. Please note that during the production process errors may be discovered which could affect the content, and all legal disclaimers that apply to the journal pertain.
Conflict of Interest:
Dr. Efimov is a consultant to Cardialen Inc.
REFERENCES
- 1.Huikuri HV, Castellanos A, Myerburg RJ. Sudden death due to cardiac arrhythmias. N Engl J Med. 2001;345(20):1473–1482. doi: 10.1056/NEJMra000650. [DOI] [PubMed] [Google Scholar]
- 2.Rubart M, Zipes DP. Mechanisms of sudden cardiac death. J Clin Invest. 2005;115(9):2305–2315. doi: 10.1172/JCI26381. [DOI] [PMC free article] [PubMed] [Google Scholar]
- 3.de Bakker JM, van Capelle FJ, Janse MJ, et al. Reentry as a cause of ventricular tachycardia in patients with chronic ischemic heart disease: electrophysiologic and anatomic correlation. Circulation. 1988;77(3):589–606. doi: 10.1161/01.cir.77.3.589. [DOI] [PubMed] [Google Scholar]
- 4.Stevenson WG, Khan H, Sager P, et al. Identification of reentry circuit sites during catheter mapping and radiofrequency ablation of ventricular tachycardia late after myocardial infarction. Circulation. 1993;88(4 Pt 1):1647–1670. doi: 10.1161/01.cir.88.4.1647. [DOI] [PubMed] [Google Scholar]
- 5.Cabo C, Boyden PA. Electrical remodeling of the epicardial border zone in the canine infarcted heart: a computational analysis. Am J Physiol Heart Circ Physiol. 2003;284(1):H372–H384. doi: 10.1152/ajpheart.00512.2002. [DOI] [PubMed] [Google Scholar]
- 6.Peters NS, Coromilas J, Severs NJ, et al. Disturbed connexin43 gap junction distribution correlates with the location of reentrant circuits in the epicardial border zone of healing canine infarcts that cause ventricular tachycardia. Circulation. 1997;95(4):988–996. doi: 10.1161/01.cir.95.4.988. [DOI] [PubMed] [Google Scholar]
- 7.Ursell PC, Gardner PI, Albala A, et al. Structural and electrophysiological changes in the epicardial border zone of canine myocardial infarcts during infarct healing. Circ Res. 1985;56(3):436–451. doi: 10.1161/01.res.56.3.436. [DOI] [PubMed] [Google Scholar]
- 8.Yap YG, Duong T, Bland M, et al. Temporal trends on the risk of arrhythmic vs. non-arrhythmic deaths in high-risk patients after myocardial infarction: a combined analysis from multicentre trials. Eur Heart J. 2005;26(14):1385–1393. doi: 10.1093/eurheartj/ehi268. [DOI] [PubMed] [Google Scholar]
- 9.Kim YH, Sosa-Suarez G, Trouton TG, et al. Treatment of ventricular tachycardia by transcatheter radiofrequency ablation in patients with ischemic heart disease. Circulation. 1994;89(3):1094–1102. doi: 10.1161/01.cir.89.3.1094. [DOI] [PubMed] [Google Scholar]
- 10.Morady F, Harvey M, Kalbfleisch SJ, et al. Radiofrequency catheter ablation of ventricular tachycardia in patients with coronary artery disease. Circulation. 1993;87(2):363–372. doi: 10.1161/01.cir.87.2.363. [DOI] [PubMed] [Google Scholar]
- 11.A comparison of antiarrhythmic-drug therapy with implantable defibrillators in patients resuscitated from near-fatal ventricular arrhythmias. The Antiarrhythmics versus Implantable Defibrillators (AVID) Investigators. N Engl J Med. 1997;337(22):1576–1583. doi: 10.1056/NEJM199711273372202. [DOI] [PubMed] [Google Scholar]
- 12.Buxton AE, Lee KL, Fisher JD, et al. A randomized study of the prevention of sudden death in patients with coronary artery disease. Multicenter Unsustained Tachycardia Trial Investigators. N Engl J Med. 1999;341(25):1882–1890. doi: 10.1056/NEJM199912163412503. [DOI] [PubMed] [Google Scholar]
- 13.Connolly SJ, Gent M, Roberts RS, et al. Canadian implantable defibrillator study (CIDS) : a randomized trial of the implantable cardioverter defibrillator against amiodarone. Circulation. 2000;101(11):1297–1302. doi: 10.1161/01.cir.101.11.1297. [DOI] [PubMed] [Google Scholar]
- 14.Moss AJ, Hall WJ, Cannom DS, et al. Improved survival with an implanted defibrillator in patients with coronary disease at high risk for ventricular arrhythmia. Multicenter Automatic Defibrillator Implantation Trial Investigators. N Engl J Med. 1996;335(26):1933–1940. doi: 10.1056/NEJM199612263352601. [DOI] [PubMed] [Google Scholar]
- 15.Ripplinger CM, Krinsky VI, Nikolski VP, et al. Mechanisms of unpinning and termination of ventricular tachycardia. Am J Physiol Heart Circ Physiol. 2006;291(1):H184–H192. doi: 10.1152/ajpheart.01300.2005. [DOI] [PubMed] [Google Scholar]
- 16.Ripplinger CM, Lou Q, Li W, et al. Panoramic imaging reveals basic mechanisms of induction and termination of ventricular tachycardia in rabbit heart with chronic infarction: Implications for low-voltage cardioversion. Heart Rhythm. 2008 doi: 10.1016/j.hrthm.2008.09.019. [DOI] [PMC free article] [PubMed] [Google Scholar]
- 17.Li L, Nikolski V, Wallick DW, et al. Mechanisms of enhanced shock-induced arrhythmogenesis in the rabbit heart with healed myocardial infarction. Am J Physiol Heart Circ Physiol. 2005;289(3):H1054–H1068. doi: 10.1152/ajpheart.01253.2004. [DOI] [PubMed] [Google Scholar]
- 18.Efimov IR, Cheng YN, Biermann M, et al. Transmembrane voltage changes produced by real and virtual electrodes during monophasic defibrillation shock delivered by an implantable electrode. J Cardiovasc Electrophysiol. 1997;8(9):1031–1045. doi: 10.1111/j.1540-8167.1997.tb00627.x. [DOI] [PubMed] [Google Scholar]
- 19.Fedorov VV, Lozinsky IT, Sosunov EA, et al. Application of blebbistatin as an excitation-contraction uncoupler for electrophysiologic study of rat and rabbit hearts. Heart Rhythm. 2007;4(5):619–626. doi: 10.1016/j.hrthm.2006.12.047. [DOI] [PubMed] [Google Scholar]
- 20.Lou Q, Ripplinger CM, Bayly PV, et al. Quantitative panoramic imaging of epicardial electrical activity. Ann Biomed Eng. 2008;36(10):1649–1658. doi: 10.1007/s10439-008-9539-3. [DOI] [PMC free article] [PubMed] [Google Scholar]
- 21.Qu F, Ripplinger CM, Nikolski VP, et al. Three-dimensional panoramic imaging of cardiac arrhythmias in rabbit heart. J Biomed Opt. 2007;12(4):044019. doi: 10.1117/1.2753748. [DOI] [PubMed] [Google Scholar]
- 22.Efimov IR, Gray RA, Roth BJ. Virtual electrodes and deexcitation: new insights into fibrillation induction and defibrillation. J Cardiovasc Electrophysiol. 2000;11(3):339–353. doi: 10.1111/j.1540-8167.2000.tb01805.x. [DOI] [PubMed] [Google Scholar]
- 23.Prevost JL, Battelli F. La Mort Par Les Décharges Électriques. Journ. de Physiol. 1899;1:1085–1100. [Google Scholar]
- 24.Beck CS. New developments in surgery of the heart. Postgrad Med. 1947;1(6):421–423. doi: 10.1080/00325481.1947.11691706. [DOI] [PubMed] [Google Scholar]
- 25.Zoll PM, Linenthal AJ, Gibson W, et al. Termination of ventricular fibrillation in man by externally applied electric countershock. N Engl J Med. 1956;254(16):727–732. doi: 10.1056/NEJM195604192541601. [DOI] [PubMed] [Google Scholar]
- 26.Gurvich NL, Yunyev GS. Restoration of a regular rhythm in the mammalian fibrillating heart. Am Rev Sov Med. 1946;3:236. [PubMed] [Google Scholar]
- 27.Gurvich NL, Yunyev GS. Restoration of heart rhythm during fibrillation by a condenser discharge. Am Rev Sov Med. 1947;4:252. [PubMed] [Google Scholar]
- 28.Salama G, Kanai A, Efimov IR. Subthreshold stimulation of Purkinje fibers interrupts ventricular tachycardia in intact hearts. Experimental study with voltage-sensitive dyes and imaging techniques. Circ Res. 1994;74(4):604–619. doi: 10.1161/01.res.74.4.604. [DOI] [PubMed] [Google Scholar]
- 29.Nasir N, Jr, Pacifico A, Doyle TK, et al. Spontaneous ventricular tachycardia treated by antitachycardia pacing. Cadence Investigators. Am J Cardiol. 1997;79(6):820–822. doi: 10.1016/s0002-9149(96)00881-8. [DOI] [PubMed] [Google Scholar]
- 30.Peinado R, Almendral J, Rius T, et al. Randomized, prospective comparison of four burst pacing algorithms for spontaneous ventricular tachycardia. Am J Cardiol. 1998;82(11):1422–1425. A1428–A1429. doi: 10.1016/s0002-9149(98)00654-7. [DOI] [PubMed] [Google Scholar]
- 31.Schaumann A, von zur Muhlen F, Herse B, et al. Empirical versus tested antitachycardia pacing in implantable cardioverter defibrillators: a prospective study including 200 patients. Circulation. 1998;97(1):66–74. doi: 10.1161/01.cir.97.1.66. [DOI] [PubMed] [Google Scholar]
- 32.Wathen MS, DeGroot PJ, Sweeney MO, et al. Prospective randomized multicenter trial of empirical antitachycardia pacing versus shocks for spontaneous rapid ventricular tachycardia in patients with implantable cardioverter-defibrillators: Pacing Fast Ventricular Tachycardia Reduces Shock Therapies (PainFREE Rx II) trial results. Circulation. 2004;110(17):2591–2596. doi: 10.1161/01.CIR.0000145610.64014.E4. [DOI] [PubMed] [Google Scholar]
- 33.Krinsky VI, Agladze K. Interaction of rotating waves in an active chemical medium. Physica. 1983;D(8):50–56. [Google Scholar]
- 34.Coromilas J, Saltman AE, Waldecker B, et al. Electrophysiological effects of flecainide on anisotropic conduction and reentry in infarcted canine hearts. Circulation. 1995;91(8):2245–2263. doi: 10.1161/01.cir.91.8.2245. [DOI] [PubMed] [Google Scholar]
- 35.Ferrero A, Chorro FJ, Canoves J, et al. Effect of flecainide on longitudinal and transverse conduction velocities in ventricular myocardium. An experimental study. Rev Esp Cardiol. 2007;60(3):315–318. [PubMed] [Google Scholar]
Associated Data
This section collects any data citations, data availability statements, or supplementary materials included in this article.


