Abstract
Molecular gradients are important for various biological processes including the polarization of tissues and cells during embryogenesis and chemotaxis. Investigations of these phenomena require control over the chemical microenvironment of cells. We present a technique to set up molecular concentration patterns that are chemically, spatially and temporally flexible. Our strategy uses optically manipulated microsources, which steadily release molecules. Our technique enables the control of molecular concentrations over length scales down to about 1 µm and timescales from fractions of a second to an hour. We demonstrate this technique by manipulating the motility of single human neutrophils. We induced directed cell polarization and migration with microsources loaded with the chemoattractant formyl-methionine-leucine-phenylalanine. Furthermore, we triggered highly localized retraction of lamellipodia and redirection of polarization and migration with microsources releasing cytochalasin D, an inhibitor of actin polymerization.
Gradients of molecules are important for cell differentiation during embryonic development1,2, for food gathering of single cellular organisms3–5 and for the immune response of higher organisms6. Chemotaxis, the directed migration of a cell along a chemical gradient, is a key element of the mammalian immune system4,5,7,8. Prokaryotes and eukaryotes have different mechanisms of chemotaxis: whereas bacteria temporally sense gradients and exhibit a biased random walk3, eukaryotes can spatially sense gradients and regulate the actin cytoskeleton to migrate toward sources of chemoattractant4,5,7,8. Over the past decade, mathematical models of eukaryotic chemotaxis have matured and incorporated various biochemical reaction-diffusion schemes9,10. Different models describe qualitatively different modes of gradient sensing and show qualitatively different spatial and temporal dynamics. To test predictions from competing models in experiments, precise control over chemical microenvironments of cells is needed.
Established techniques to create linear or radial gradients of soluble molecules have used diffusion chambers and micropipettes. Emerging techniques that incorporate microfluidic devices11,12, photoinduced uncaging12,13 or photolysis of nanoparticles14 allow more control over the geometry and the dynamics of the molecular concentration patterns. However, there is so far no technique available that allows the creation of persistent gradient patterns that can be flexibly shaped in three dimensions down to micrometer scales.
Here we present a strategy for cell stimulation that enables the control of concentrations of soluble molecules over length scales from about 100 µm to 1 µm at timescales from hours to a fraction of a second. This strategy is based on optically manipulated microsources (OMMs), microparticles that provide a controlled release of soluble molecules that act as chemoattractants or perturb the actin cytoskeleton. We individually trapped multiple microsources and independently manipulated them with holographic optical tweezers15–17.
RESULTS
Microsource fabrication and structure
We fabricated microsources releasing the chemoattractant formyl-methionine-leucine-phenylalanine (fMLP; 438 g mol−1) and microsources releasing the actin polymerization inhibitor cytochalasin D (508 g mol−1)18,19 from polylactic-co-glycolic acid (PLGA) using a solvent evaporation–spontaneous emulsion technique20. Particles releasing fMLP stimulated chemotactic responses in single neutrophil-differentiated HL-60 cells, and particles releasing cytochalasin D perturbed the actin cytoskeleton of single HL-60 cells with high spatial localization.
The nominal loading (mass of the loaded chemical divided by the total mass of the loaded chemical and PLGA) was 0.01–0.17. We measured the structure of the PLGA particles by scanning electron microscopy (SEM). The SEM image (Supplementary Fig. 1) revealed that the particles were spherical. We measured the size distribution of the beads by SEM and by dynamic light scattering. The particles had a mean diameter of 500–1,000 nm and an average polydispersity (s.d. of diameter divided by mean diameter) of ~40%.
Controlled release of encapsulated agents
We determined the concentration profile of molecules released from a microsource close to a coverslip by the release rate, the diffusion coefficient of the released molecule and the boundary condition imposed by the impenetrable coverslip. The concentration profile around a particle at a height h above a coverslip was approximated (derivation in Supplementary Note 1) by
| (1) |
in which a is the particle radius, ρ and z are the cylindrical coordinates, c0 is the concentration on the surface of the bead and cb is the homogeneous background concentration. The concentration on the surface of the bead,
| (2) |
was determined by the flux, j0, of molecules from the particle surface and the diffusion coefficient, D, of the molecules. This equation is only exact when h ≫ a. An example for a concentration profile around a particle is shown in Supplementary Figure 2.
To estimate the flux from individual beads, we measured the release of fMLP from ensembles of PLGA beads (Supplementary Note 1). Beads at a concentration of 1 mg ml−1 released 60 µM of fMLP during the first hour after suspending the beads in buffer solution. Release measurements on individual PLGA particles loaded with the fluorescent dye rhodamine B showed that the release rate was proportional to the bead volume (Supplementary Note 2 and Supplementary Fig. 3). Assuming the same particle size–dependence for fMLP yielded a flux of j0 = 5,000 molecules µm−2 s−1 (60,000 molecules per second) from a microsource with a diameter of 2 µm. Using equation 2 and the diffusion coefficient of fMLP, D = ~1,000 µm2 s−1, the estimated concentration on the surface of the bead was therefore c0 = 8 nM.
The concentration distribution of fMLP around a single microsource was sufficient to induce chemotaxis. If a 2-µm bead were placed near the membrane of a cell with a diameter of 20 µm, the cell would be exposed to an fMLP concentration of about 8 nM at the side facing the bead and a concentration of 0.2 nM at the opposite side if no homogeneous background concentration was present. If the background concentration is the dissociation constant (Kd) (~10 nM) for fMLP binding to its receptor11, the front of the cell is exposed to an 80% larger concentration than the back of the cell. Concentration differences on that order of magnitude at an ambient concentration with a value of approximately the Kd value can induce chemotaxis in neutrophils11.
Cell response to microsources of chemoattractants
Differentiated HL-60 cells are a neutrophil-like cell line that is used as a model system for studying neutrophil chemotaxis21. In positive control experiments, we characterized the migration of HL-60 cells in gradients of fMLP in a Zigmond diffusion chamber22. The potency of fMLP to stimulate chemotaxis was not reduced when it was encapsulated and released from PLGA beads (Supplementary Note 3 and Supplementary Fig. 4). By using HL-60 cells transfected with YFP-actin plasmid, we found that freely diffusing fMLP-loaded PLGA beads induced cell polarization and actin accumulation (Supplementary Fig. 5).
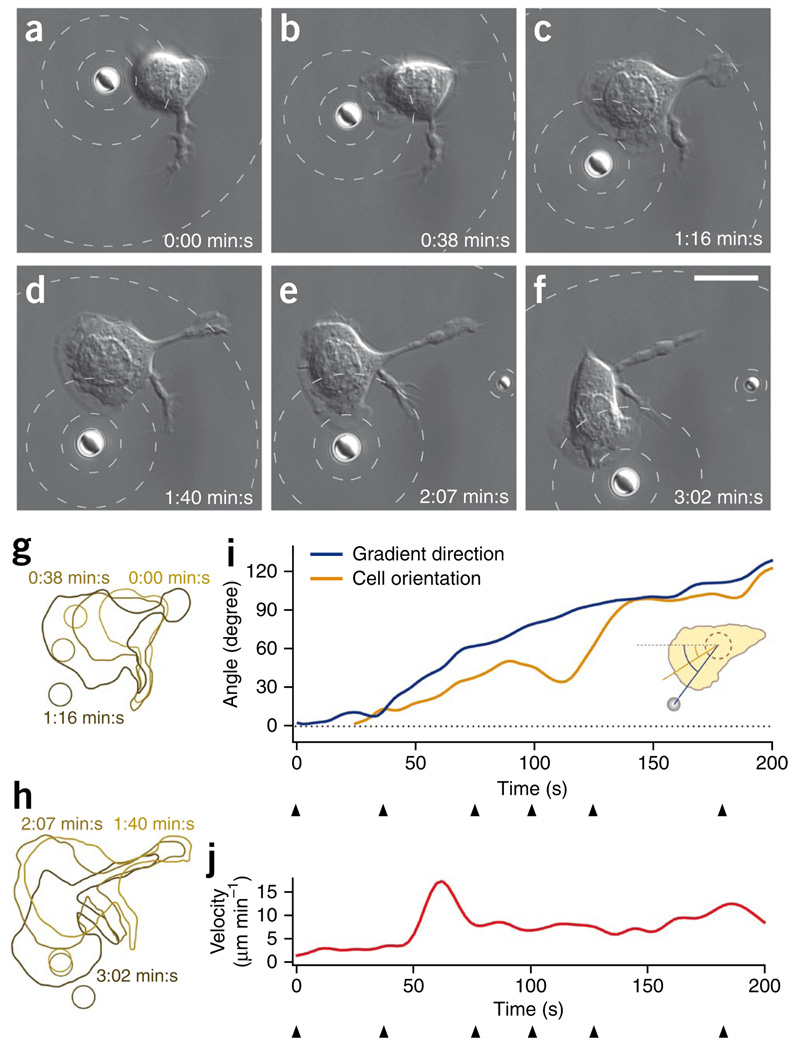
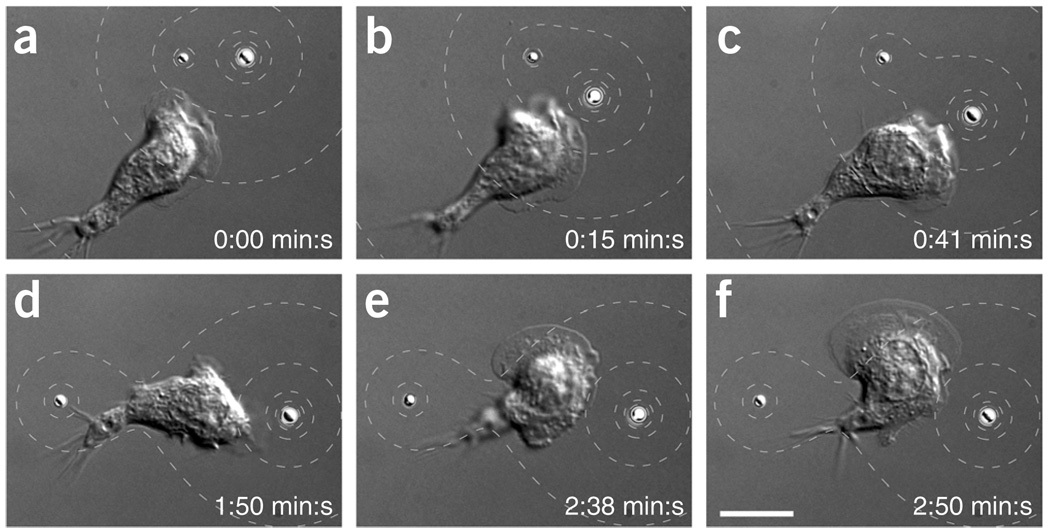
Individual optically trapped PLGA microparticles loaded with fMLP could induce a chemotactic response in single neutrophils. We introduced the microparticles to samples of HL-60 cells plated on coverslips and imaged the cells by differential interference contrast microscopy. We assayed the interaction of a cell with a single fMLP-loaded particle manipulated with holographic optical tweezers (Fig. 1 and Supplementary Video 1). We moved an individual fMLP-loaded particle close to the membrane of a neutrophil (Fig. 1a). The cell started to polarize and migrate in the direction of the particle (Fig. 1b). We then moved the particle counter-clockwise around the cell, and the cell changed its polarization and migration directions in response to the altered particle position (Fig. 1c–f). We estimated fMLP concentration around the bead (Fig. 1). The influence of the motion of the bead on the concentration pattern was negligible. In this and subsequent cell stimulation experiments, we moved the particles at speeds not exceeding 1 µm s−1. At such low speeds, the steady-state solution (equation 1) was a good approximation for the concentration distribution at any time (Supplementary Note 4). Furthermore, the presence of a cell changed the concentration pattern around a bead only negligibly (Supplementary Note 5 and Supplementary Fig. 6).
Figure 1.
A single optically manipulated bead loaded with chemoattractant induces directed polarization and migration of a neutrophil. (a–f) Differential interference contrast (DIC) microscopy images. PLGA particle loaded with fMLP was moved close to the membrane of an HL-60 cell (a). Cell polarized and migrated in the direction of the particle (b). Particle was moved counter-clockwise around the cell and the cell changed polarization and migration direction (c–f). The dashed contour lines indicate the spatially varying concentration of fMLP around the bead. The concentration on the surface of the bead (c0) was 2 nM above the background, cb = 20 nM. The contour lines show fMLP concentration levels of 50%, 25% and 10% of c0 above cb. Scale bars, 10 µm. (g,h) Sketches showing the cell contour and the bead contour from the images in a–f (split into two sketches for clarity). The different colors of the contours indicate the different time points of the image series. (i,j) Direction of the gradient and cell orientation (direction from the center of the cell to the center of the leading edge) (i) and cell velocity (j) as a function of time. The directions were quantified as angles with respect to the dashed reference line. Arrowheads mark the time points shown in a–f.
We analyzed the time-dependent orientation and motion of the cell (Fig. 1g,h) to determine whether it followed the bead motion: we extracted the cell position, the direction of the cell orientation and the direction of the gradient of fMLP from each of the time-lapse images. The angle that quantified the direction of the gradient increased continuously with time (Fig. 1i). The cell orientation could not be defined at the earliest time points (time t ≤ 25 s) because the cell was lacking a leading edge. After the cell created a leading edge, the cell orientation followed the gradient direction with a time delay of up to 60 s. The cell responded to the stimulus created by the bead by polarizing and migrating in the direction of the stimulus. Upon first exposure to the bead, the cell reached a peak velocity of more than 15 µm min−1, which decreased to ~7–13 µm min−1 for the remainder of the experiment (Fig. 1j). An additional movie of a single HL-60 cell stimulation with an individual optically trapped PLGA particle loaded with fMLP is shown in Supplementary Video 2.
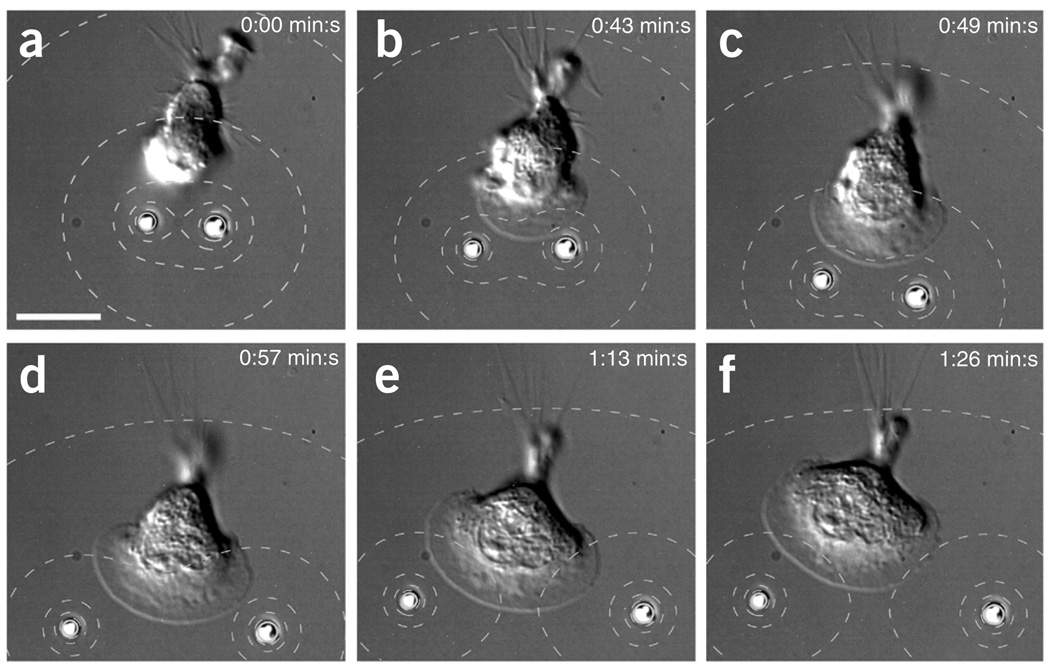
The capability to trap and manipulate multiple microsources simultaneously offers a high degree of spatial flexibility for the creation of cell stimulus patterns that are not easily achieved with micropipettes. We assayed the response of a single HL-60 cell to a highly localized bipolar stimulus created with two optically trapped beads releasing fMLP (Fig. 2 and Supplementary Video 3). Upon positioning of the beads close to the cell, the cell formed a lamellipodium, which broadened as it advanced toward the well-separated beads.
Figure 2.
Bipolar stimulation with chemoattractant induced formation and broadening of a lamellipodium. (a–d) Upon positioning of fMLP-loaded beads close to a HL-60 cell (a), the cell formed a lamellipodium in the direction of the beads (b) that broadened as the cell advanced toward the beads (c,d). (e,f) Ultimately, the lamellipodium reached its maximal size and the cell oriented toward the lower left bead. The contour lines in the DIC images show fMLP concentration (80, 60, 40, 20 and 10% of c0 = 1 nM above the background cb = 10 nM). Scale bars, 10 µm.
Control experiments with optically manipulated unloaded PLGA beads showed no chemotactic response of the cells (Supplementary Videos 4 and 5). Furthermore, we quantified the heating of the trapped particles owing to the laser tweezers by using the temperature-dependent fluorescent dye Rhodamine B. The intensity of the fluorescence emitted from Rhodamine B decreases by 2.3% per 1 °C temperature increase23. For the trapping powers used in this study (~5 mW) the particles heated up by less than 0.1 °C (Supplementary Note 6 and Supplementary Fig. 7). As the plain PLGA beads did not affect the cell behavior, this temperature increase is negligible.
Cell response to actin polymerization inhibitors
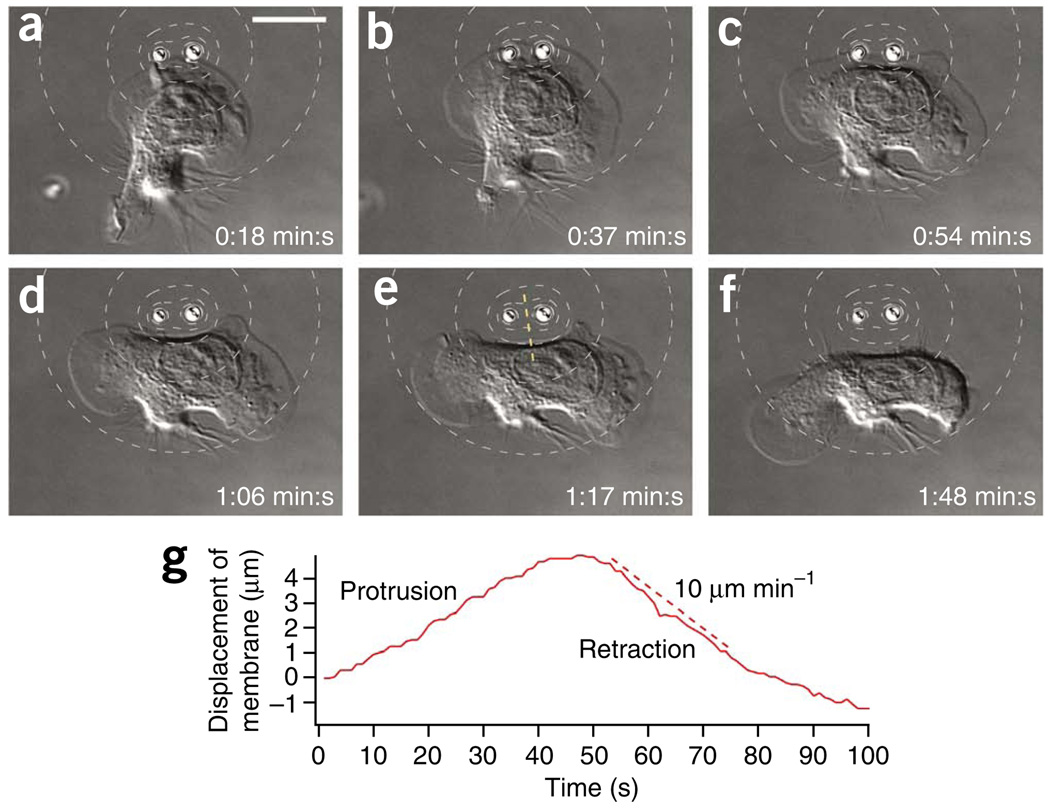
We manipulated the motility of neutrophils using beads releasing the actin polymerization inhibitor cytochalasin D in the presence of a homogeneous background concentration of 100 nM fMLP. OMMs created highly localized stimuli, which induced strongly localized cytoskeletal perturbations (Fig. 3 and Supplementary Video 6). We stimulated an HL-60 cell with two optically trapped beads releasing cytochalasin D. We positioned the beads close to each other and to the center of the lamellipodium. After about 45 s, the lamellipodium started to retract at 10 µm min−1 in a small region around the beads. As a result, the lamellipodium was initially split into two parts. About 1 minute after the split, one of the two lamellipodia retracted while the other one persisted.
Figure 3.
OMMs of cytochalasin D induced highly localized retraction in the center of a lamellipodium. (a,b) Two beads releasing cytochalasin D close to the center of the lamellipodium of a migrating HL-60 cell. (c–e) Lamellipodium retracted in a small region around the beads (c) yielding a lamellipodium that was split into two parts (d,e). (f) Only one lamellipodium remained. The contour lines in the DIC images show cytochalasin D concentration (80, 60, 40, 20 and 10% of c0 above the background). Scale bars, 10 µm. (g) The displacement of the membrane along the dashed yellow line in e.
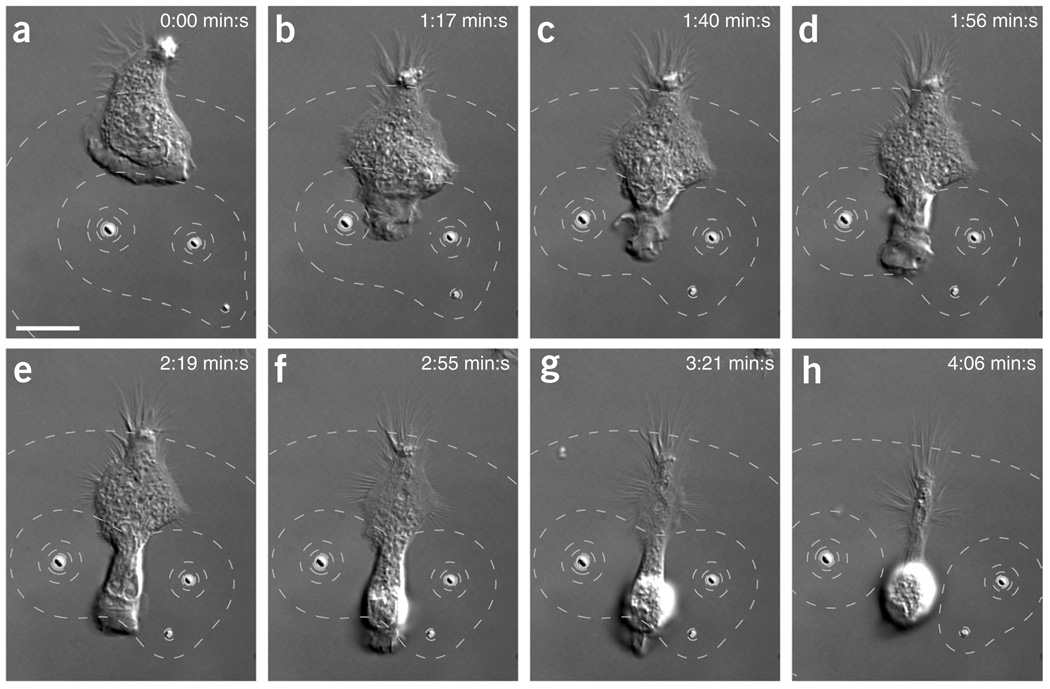
Bipolar perturbations caused notable changes to cell motility. We positioned two beads, separated by ~20 µm, in front of a migrating cell (Fig. 4 and Supplementary Video 7). The cell squeezed through the narrow gap created by the two microsources: the lamellipodium retracted on the two sides closest to the beads while the central part of the lamellipodium continued to progress. To analyze the response of an HL-60 cell to a temporally varying bipolar perturbation with cytochalasin D, we first stopped cell migration with two microsources (Fig. 5a,b and Supplementary Video 8). Then, we repositioned the two beads on two opposing ends of the cell along the direction of cell polarization. Subsequently, the cell repolarized in a direction perpendicular to the axis defined by the beads (Fig. 5c–f).
Figure 4.
Migrating cell squeezes between two optically manipulated microsources of cytochalasin D. (a) Two beads in front of a migrating HL-60 cell. (b–f) As the bead-to-bead distance increased to about 20 µm, the lamellipodium of the cell migrating toward the two particles retracted on the two sides closest to the beads while the central part of the leading edge continues to extend. (g,h) The cell rounded up and retracted its leading edge. The contour lines in the DIC images show cytochalasin D concentration (80, 60, 40, 20 and 10% of c0 above background). Scale bars, 10 µm.
Figure 5.
Response of HL-60 cells to time-varying bipolar stimulus of cytochalasin D. (a–c) The cell stopped its migration and retracted its lamellipodium in response to two microsources of cytochalasin D placed in the direction of cell migration. (d) The two beads positioned on two opposing ends of the cell in the direction of cell polarization. (e,f) The cell repolarized in a direction perpendicular to the axis defined by the beads. The contour lines in the DIC images show cytochalasin D concentration (80, 60, 40, 20 and 10% of c0 above background) Scale bars, 10 µm.
Holographic optical tweezers provide a high degree of spatial flexibility for the creation of molecular concentration patterns through their ability to independently manipulate multiple particles. We assayed this flexibility by stimulating single cells simultaneous with three or five microsources (Supplementary Fig. 8). Furthermore, the dynamic reconfiguration of optical traps provided a high degree of temporal flexibility. Our holographic optical tweezers17 setup allowed us to move individual microsources independently of each other at speeds up to 25 µm s−1. Therefore it was possible to switch within about 1 s between well-defined spatial stimulation patterns on length scales of tens of micrometers. One second was enough time for the concentration distribution around a bead to reach steady state (Supplementary Note 4).
DISCUSSION
The length scale of the chemical concentration patterns that can be generated by our technique depends on various factors. On the lower end, it is determined by the size of the particles that are releasing the stimulus. On the upper end, it is determined by the size of the microscope field of view in which particles can be optically manipulated and also by the number of particles that can be trapped simultaneously. Here we used particles with radii of 1.5–4 µm. Holographic optical tweezers setups allow trapping of about 100 particles simultaneously. Packing particles close together (particles with a diameter larger than about 1 µm can be packed to contact) allows mimicking large sources of chemoattractant with multiple small beads. The possibility to vary the size of microsources allows investigation of the response of cells to stimuli that vary in their degree of localization. For example, it has been found that localized release of cytokines from microparticles can induce a response in T cells that is different from the response to exogenous addition of cytokines24. Therefore, OMMs could, for example, enable further investigation into how paracrine delivery of agents may impact immune system cell function.
In addition to using multiple beads to create flexible spatial stimulation, we applied flexible temporal stimulation patterns to a cell by dynamically changing the distance of one or more beads away from the cell. The maximal frequency of stimulation we can create by our current implementation of holographic optical tweezers is about 30 Hz, which can be transmitted over a range of about 10 µm. However, if necessary, much larger stimulation frequencies could be generated with devices such as acousto-optical deflectors that can be driven in the range of kHz and above. Over larger distances, the maximal frequency that can be transmitted decreases (Supplementary Note 4).
Finally, OMMs offer a high degree of chemical flexibility. The PLGA particles that we used here trap the encapsulated molecules physically during the particle fabrication process. This enables the encapsulation and controlled release of a large variety of molecules including proteins, small peptides, fluorescent dyes, oligonucleotides and small-molecule drugs20,25. In contrast, caged molecules require the chemical development of a caged version for each type of molecule. Furthermore, PLGA is a well-established material that has no adverse side effects on cellular viability26,27. However, PLGA microparticles had been designed for release over long periods of time with large numbers of particles. Further optimization, including the use of other materials such as colloidosomes28 and mesoporous silica nanoparticles29,30, could potentially increase the concentration of released molecules by two orders of magnitude (Supplementary Note 7).
The spatial, temporal and chemical flexibility of OMMs make them applicable to a broad range of research areas in cell and developmental biology, where it is of interest to stimulate single cells or developing organisms locally with specific molecules.
Methods
Methods and any associated references are available in the online version of the paper at http://www.nature.com/naturemethods/.
Supplementary Material
ACKNOWLEDGMENTS
We thank S. Dandekar, A. Houk, A. Millius and S. Wilson for help with cell culturing and sample preparation, A. Schaefer for helpful discussions, and M. Elimelech and W. Mitch for use of equipment. This work was supported by a fellowship (BMBF-LPD 9901/8-162) from the German Academy of Sciences Leopoldina to H.K., a US National Institutes of Health grant (1U54-RR0222332) and US National Science Foundation grants (CBET-0619674 and DBI–0619674) to E.R.D., a US National Institutes of Health grant (RO1-GM084040) to O.D.W and a US National Science Foundation CAREER grant (CBET-0747577) to T.M.F.
Footnotes
Note: Supplementary information is available on the Nature Methods website.
AUTHOR CONTRIBUTIONS
H.K. and E.R.D. designed and performed the research, analyzed data and wrote the paper. J.G.P., J.D.F., S.S.W. and O.D.W. performed research and analyzed data. C.O.M. and Y.Z. performed research. J.P. and T.M.F. designed research and contributed new reagents and analytic tools. D.W. designed research.
Reprints and permissions information is available online at http://npg.nature.com/reprintsandpermissions/.
References
- 1.Gurdon JB, Bourillot PY. Morphogen gradient interpretation. Nature. 2001;413:797–803. doi: 10.1038/35101500. [DOI] [PubMed] [Google Scholar]
- 2.Meinhardt H. Models of biological pattern formation: from elementary steps to the organization of embryonic axes. Curr. Top. Dev. Biol. 2008;81:1–63. doi: 10.1016/S0070-2153(07)81001-5. [DOI] [PubMed] [Google Scholar]
- 3.Wadhams GH, Armitage JP. Making sense of it all: bacterial chemotaxis. Nat. Rev. Mol. Cell Biol. 2004;5:1024–1037. doi: 10.1038/nrm1524. [DOI] [PubMed] [Google Scholar]
- 4.Kay RR, Langridge P, Traynor D, Hoeller O. Changing directions in the study of chemotaxis. Nat. Rev. Mol. Cell Biol. 2008;9:455–463. doi: 10.1038/nrm2419. [DOI] [PubMed] [Google Scholar]
- 5.Van Haastert PJM, Devreotes PN. Chemotaxis: signalling the way forward. Nat. Rev. Mol. Cell Biol. 2004;5:626–634. doi: 10.1038/nrm1435. [DOI] [PubMed] [Google Scholar]
- 6.Cyster JG. Chemokines and cell migration in secondary lymphoid organs. Science. 1999;286:2098–2102. doi: 10.1126/science.286.5447.2098. [DOI] [PubMed] [Google Scholar]
- 7.Weiner OD. Regulation of cell polarity during eukaryotic chemotaxis: the chemotactic compass. Curr. Opin. Cell Biol. 2002;14:196–202. doi: 10.1016/s0955-0674(02)00310-1. [DOI] [PMC free article] [PubMed] [Google Scholar]
- 8.Parent CA, Devreotes PN. A cell’s sense of direction. Science. 1999;284:765–770. doi: 10.1126/science.284.5415.765. [DOI] [PubMed] [Google Scholar]
- 9.Iglesias PA, Levchenko A. Modeling the cell’s guidance system. Sci. STKE. 2002;2002:re12. doi: 10.1126/stke.2002.148.re12. [DOI] [PubMed] [Google Scholar]
- 10.Skupsky R, Losert W, Nossal RJ. Distinguishing modes of eukaryotic gradient sensing. Biophys. J. 2005;89:2806–2823. doi: 10.1529/biophysj.105.061564. [DOI] [PMC free article] [PubMed] [Google Scholar]
- 11.Herzmark P, et al. Bound attractant at the leading vs. the trailing edge determines chemotactic prowess. Proc. Natl. Acad. Sci. USA. 2007;104:13349–13354. doi: 10.1073/pnas.0705889104. [DOI] [PMC free article] [PubMed] [Google Scholar]
- 12.Beta C, Wyatt D, Rappel WJ, Bodenschatz E. Flow photolysis for spatiotemporal stimulation of single cells. Anal. Chem. 2007;79:3940–3944. doi: 10.1021/ac070033y. [DOI] [PubMed] [Google Scholar]
- 13.Samadani A, Mettetal J, van Oudenaarden A. Cellular asymmetry and individuality in directional sensing. Proc. Natl. Acad. Sci. USA. 2006;103:11549–11554. doi: 10.1073/pnas.0601909103. [DOI] [PMC free article] [PubMed] [Google Scholar]
- 14.Sun BY, Chiu DT. Synthesis, loading, and application of individual nanocapsules for probing single-cell signaling. Langmuir. 2004;20:4614–4620. doi: 10.1021/la0364340. [DOI] [PubMed] [Google Scholar]
- 15.Dufresne ER, Grier DG. Optical tweezer arrays and optical substrates created with diffractive optics. Rev. Sci. Instrum. 1998;69:1974–1977. [Google Scholar]
- 16.Dufresne ER, Spalding GC, Dearing MT, Sheets SA, Grier DG. Computer-generated holographic optical tweezer arrays. Rev. Sci. Instrum. 2001;72:1810–1816. [Google Scholar]
- 17.Mejean CO, Schaefer AW, Millman EA, Forscher P, Dufresne ER. Multiplexed force measurements on live cells with holographic optical tweezers. Opt. Express. 2009;17:6209–6217. doi: 10.1364/oe.17.006209. [DOI] [PMC free article] [PubMed] [Google Scholar]
- 18.Cooper JA. Effects of cytochalasin and phalloidin on actin. J. Cell Biol. 1987;105:1473–1478. doi: 10.1083/jcb.105.4.1473. [DOI] [PMC free article] [PubMed] [Google Scholar]
- 19.Urbanik E, Ware BR. Actin filament capping and cleaving activity of cytochalasin-B, cytochalasin-D, cytochalasin-E and cytochalasin-H. Arch. Biochem. Biophys. 1989;269:181–187. doi: 10.1016/0003-9861(89)90098-2. [DOI] [PubMed] [Google Scholar]
- 20.Fahmy TM, Samstein RM, Harness CC, Saltzman WM. Surface modification of biodegradable polyesters with fatty acid conjugates for improved drug targeting. Biomaterials. 2005;26:5727–5736. doi: 10.1016/j.biomaterials.2005.02.025. [DOI] [PubMed] [Google Scholar]
- 21.Servant G, et al. Polarization of chemoattractant receptor signaling during neutrophil chemotaxis. Science. 2000;287:1037–1040. doi: 10.1126/science.287.5455.1037. [DOI] [PMC free article] [PubMed] [Google Scholar]
- 22.Zigmond SH. Ability of polymorphonuclear leukocytes to orient in gradients of chemotactic factors. J. Cell Biol. 1977;75:606–616. doi: 10.1083/jcb.75.2.606. [DOI] [PMC free article] [PubMed] [Google Scholar]
- 23.Ebert S, Travis K, Lincoln B, Guck J. Fluorescence ratio thermometry in a microfluidic dual-beam laser trap. Opt. Express. 2007;15:15493–15499. doi: 10.1364/oe.15.015493. [DOI] [PubMed] [Google Scholar]
- 24.Steenblock ER, Fahmy TM. A comprehensive platform for ex vivo T-cell expansion based on biodegradable polymeric artificial antigen-presenting cells. Mol. Ther. 2008;16:765–772. doi: 10.1038/mt.2008.11. [DOI] [PubMed] [Google Scholar]
- 25.Vasir JK, Labhasetwar V. Biodegradable nanoparticles for cytosolic delivery of therapeutics. Adv. Drug Deliv. Rev. 2007;59:718–728. doi: 10.1016/j.addr.2007.06.003. [DOI] [PMC free article] [PubMed] [Google Scholar]
- 26.Cohen S, Yoshioka T, Lucarelli M, Hwang LH, Langer R. Controlled delivery systems for proteins based on poly(lactic/glycolic acid) microspheres. Pharm. Res. 1991;8:713–720. doi: 10.1023/a:1015841715384. [DOI] [PubMed] [Google Scholar]
- 27.Jiang WL, Gupta RK, Deshpande MC, Schwendeman SP. Biodegradable poly(lactic-co-glycolic acid) microparticles for injectable delivery of vaccine antigens. Adv. Drug Deliv. Rev. 2005;57:391–410. doi: 10.1016/j.addr.2004.09.003. [DOI] [PubMed] [Google Scholar]
- 28.Dinsmore AD, et al. Colloidosomes: selectively permeable capsules composed of colloidal particles. Science. 2002;298:1006–1009. doi: 10.1126/science.1074868. [DOI] [PubMed] [Google Scholar]
- 29.Slowing II, Trewyn BG, Giri S, Lin VSY. Mesoporous silica nanoparticles for drug delivery and biosensing applications. Adv. Funct. Mater. 2007;17:1225–1236. [Google Scholar]
- 30.Carroll NJ, et al. Droplet-based microfluidics for emulsion and solvent evaporation synthesis of monodisperse mesoporous silica microspheres. Langmuir. 2008;24:658–661. doi: 10.1021/la7032516. [DOI] [PubMed] [Google Scholar]
Associated Data
This section collects any data citations, data availability statements, or supplementary materials included in this article.


